Thermal neutron flux measurements in STAR experimental hall.
Abstract
We report on measurements of thermal neutron fluxes at different locations in the STAR experimental hall during pp = 510 GeV Run 13 at RHIC. We compared these measurements with calculations based on PYTHIA as minimum bias events generator, the detailed GEANT3 simulation of the STAR detector and the experimental hall, and using GCALOR as neutron transport code. A good (within 30%) agreement was found at locations near (1m) and very far (10m) from the beam pipe. For intermediate locations ( 5m) the simulation overestimates neutron flux by a factor of 3.
keywords:
thermal neutrons, measurements, simulation1 Introduction
Since the time of for the SSC detectors [1, 2] it has been understood that the main source of background in a detector at modern colliders are collisions at interaction point. The contribution from other sources (beam gas interactions, beam halo particles, etc.) estimated to be below 10%[3]. Extensive simulations of background conditions were part of detectors optimizations for SSC and LHC experiments. ATLAS[4] and CMS[5] have made simulations for all types of backgrounds including neutrons. Estimations of the neutron fluxes in experimental areas were based on simulations only, without support from experimentally measured data. Only recently the ATLAS-MPX collaboration[6] published results of absolute background measurements in the ATLAS experimental hall including thermal neutrons and made a comparison with results of simulations with GEANT3+GCALOR[7] and Fluka[8]. Their conclusion was [6] : “Measured thermal neutron fluxes are found to be largely in agreement with the original simulations, mostly within a factor of two. Significant deviations are observed in the low radiation regions of ATLAS cavern, where measured thermal neutron fluxes are found to be lower than predicted by Monte Carlo simulations.”
The STAR detector at the Relativistic Heavy Ion Collider (RHIC)[9] is planning series of upgrades in the near future with detectors using different types of silicon sensors. Reliable estimations of neutron background at STAR are required to evaluate different technologies for these upgrades. This necessity and the lack of experimental results for neutron background estimates were our motivations for this work. Same questions have been raised in context of ongoing detector R&D for proposed Electron Ion Collider (EIC[10]):
-
1.
What are neutron background conditions currently at the STAR detector and will be at EIC?
-
2.
How reliable can we estimate these conditions ?
To answer these questions we:
- 1.
-
2.
compared experimental results with simulation in order to understand how reliable this simulation is, and
-
3.
estimated fluxes of the intermediate energy neutrons using simulation results.
For the purpose of future discussions we will classify neutrons by kinetic energy() as follows:
-
1.
intermediate energy neutrons with in range 100 keV1 MeV, which are most damaging for electronics and silicon detectors, and
-
2.
thermal neutrons with below 250 meV. This definition includes cold (), thermal as such (), and part of epithermal (25 meV400 meV) neutrons. The thermal neutrons generate quanta producing noise in detector elements.
2 Measurements
2.1 counter
We used a filled proportional counter[12] (), loaned to us by BNL Instrumentation Division, to measure fluxes of thermal neutrons in WAH.
- 1.
- 2.
-
3.
The signal was shaped with the threshold set to 20% of the maximum signal (764 keV), which corresponds to an unambiguous thermal neutron registration (contamination of and charged particles were due to only multiple hits during signal collection time of the detector 5 and neglected herein).
-
4.
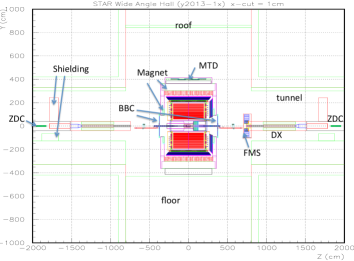
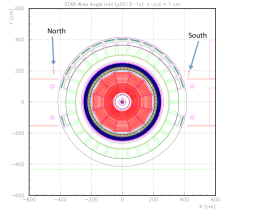
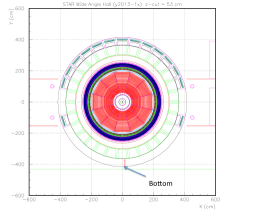
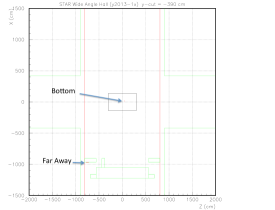
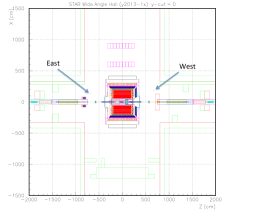
During the run was positioned at 6 locations[15] of WAH (Fig.1): the South and North (Fig.2) on the level of the second platform just outside of MTD from the south and north sides of the detector, the Bottom on the floor under MTD (Fig.3 and Fig.4), the West and East near the entrances to the tunnel (Fig.5), and the Far Away (Fig.4) on the floor just after the entrance to WAH.
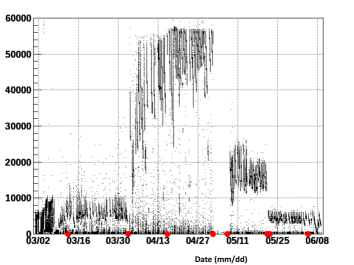
The shaped signal was fed to the so called STAR RICH scalers (channel 16), and the rate of the scaler (Hz) was recorded in STAR online database (each 15 s) and in STAR daq stream (with frequency 1 Hz) together with others scalers (particularly, ZDC West, ZDC East, and ZDC West and East coincidence). The rate versus date of data taking for different counter locations is shown in Fig.6.
2.2 Event rate
In this study we used the East and West ZDC scalers. In order to estimate event rate [MHz] the following approach[16, 17] was used:
-
1.
: number of bunch crossings,
-
2.
: number of crossings that contain a coincidence of the West and East counters with probability
, -
3.
: number of crossings that contain a hit in the East counter, ,
-
4.
: number of crossings that contain a hit in the West counter, ,
-
5.
: a probability to produce an East hit,
-
6.
: a probability to produce a West hit,
-
7.
: a probability to produce at least one or more East and West coincidences in the beam crossing.
Then we used 3 equations:
and solved them with respect to
where is the mean value of Poisson distribution.
2.3 Fluxes
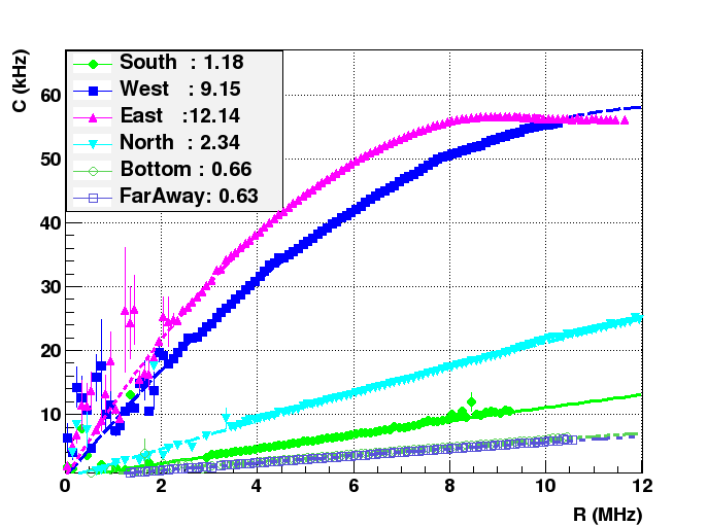
The measured fluxes are obtained from the rate (C) using the counter sensitivity. Dependences of the measured C at the different locations on are shown in Fig.7. In order to normalize C to 1 MHz of pp interaction rate () and also account for saturation effects in due to its dead time, the dependences were approximated by The measurements of for different locations are presented in Table 1.
| Location | (kHz) | RC | MC | ratio |
|---|---|---|---|---|
| South | 1.18 | 13.6 1.4 | 34.7 5.9 | 0.39 0.08 |
| West | 9.15 | 105.2 10.5 | 124.1 11.1 | 0.85 0.11 |
| East | 12.14 | 139.5 13.9 | 105.3 10.3 | 1.33 0.18 |
| North | 2.34 | 26.9 2.6 | 39.9 6.3 | 0.67 0.13 |
| Bottom | 0.66 | 7.6 0.8 | 23.9 4.9 | 0.32 0.07 |
| FarAway | 0.63 | 7.2 0.7 | 7.0 2.6 | 1.03 0.40 |
3 Simulation
To estimate fluxes, PYTHIA version 6.4.26[19] as pp 510 GeV minimum biased event generator and GEANT3+GCALOR[7] for propagation particles in WAH were used. The STAR detector and WAH geometry description was taken as version [20] used for RHIC Run 13. The only two essential changes from default STAR simulation were:
(1) reducing cut for neutral hadrons (CUTNEU) from 1 MeV to GeV, and
(2) increasing maximum particle time of flight cut (TOFMAX) from to s.
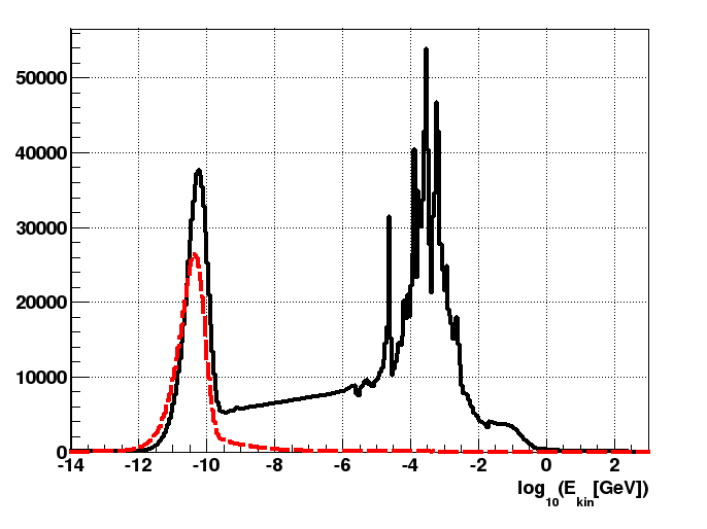
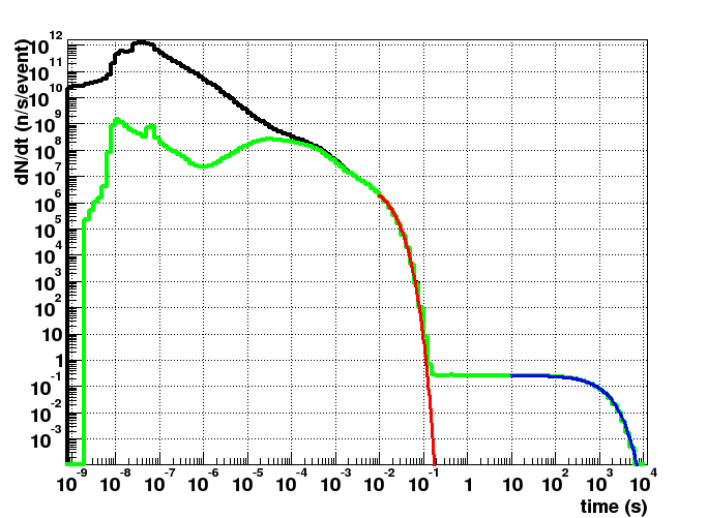
The simulated spectrum of neutrons in WAH and the spectrum convoluted with the neutron cross section are presented in Fig.8. From this spectrum we can conclude that of neutrons with were detected by .
The neutron’s time of flight distribution from the simulation is presented in Fig.9. There are two distinct components in the distribution: the first one with = 7.1 ms which corresponds to neutron dissipation from WAH and the second component suppressed by a factor of with respect to the first one with which is due to neutron decays (in the simulation neutron life time was used). Unfortunately, with our maximum recording rate of 1 Hz we could not detect the dissipation component.
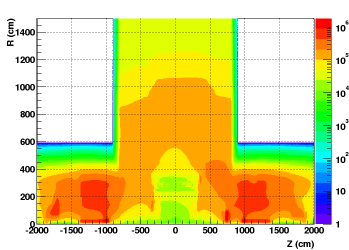
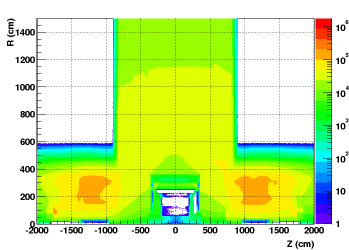
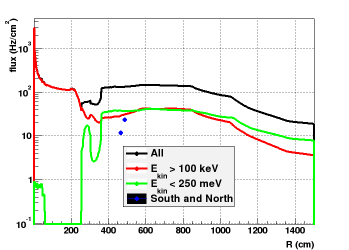
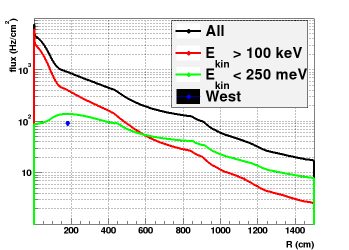
Flux was defined as sum of track length of a particle collected in a given volume in unit time divided by the volume size. The fluxes were normalized to 1 MHz rate of pp inelastic events at = 510 GeV. Fluxes for all neutrons and neutrons with are show in Fig.10 and Fig.11, respectively. The radial dependence of fluxes at Z 0 and Z 675 cm for all neutrons, neutrons with and neutrons with are shown in Fig.12.
4 Conclusions
From this study we conclude that we can estimate neutron background for STAR detector with good precision. The results of the measurement and simulation are presented with absolute values and their ratios in Table 1. The comparison is good (within ) for the West, East and Far Away locations. However, for the South, North and Bottom locations the simulation overestimated flux by a factor of 3. This conclusion is very close to one [6] which we cited in the introduction. The mismatch between the measurement and the simulation may be due to inaccurate description of geometry and material in the WAH, which would affect the neutron dissipation from the interaction region. The deviation could also be related to the neutron transport parameters.
5 Acknowledgments
We thank Brookhaven National Laboratory Instrumentation Division and, especially, G.Smith and N. Schaknowski, for the detector. We thank the STAR Collaboration, the RHIC Operations Group and RCF at BNL. This work was supported by the Offices of NP and HEP within the U.S. DOE Office of Science.
References
- [1] Donald E. Groom, “Radiation Levels in SSC Detectors,” Nucl. Instrum. Meth. A279 (1989) 1-6.
- [2] M.V.Diwan, et al., “Radiation environment and shielding for a high luminosity collider detector,” BNL-52492 Formal Report, SSCL-SR-1223.
- [3] A.I.Drozhdin, M.Huhtinen, and N.V.Mokhov, “Accelerator Related Background in the CMS Detector at LHC,” CERN/TIS-RP/96-08/PP.
- [4] Yu. Fisyak, “Study of neutron and gamma backgrounds in ATLAS,” CERN-ATL-CAL-94-039. S.Baranov, et al., “Estimation of Radiation Background, Impact on Detectors, Activation and Shielding Optimization in ATLAS,” ATL-GEN-2005-001.
- [5] M.Huhtinen, “Radiation Environment Simulations for the CMS Detector,” CERN CMS TN/95-198. Y.Fisyak, R.Breedon, “Comments on the simulation of background for the CMS muon system,” CMS TN/96-019.
- [6] M.Campbell et al., “Analysis of the Radiation Field in ATLAS Using 2008-2011 Data from the ATLAS-MPX Network,” ATL-GEN-PUB-2013-001 http://cds.cern.ch/record/1544435/files/ATL-GEN-PUB-2013-001.pdf
- [7] C.Zeitnitz and T.A.Gabriel, “The GEANT-GCALOR Interface and Benchmark Calculations for Zeus Calorimeters,” Nucl. Instrum. Meth. A349 (1994) 106-111
- [8] G. Collazuol, A. Ferrari, A. Guglielmi, and P.R. Sala, “Hadronic models and experimental data for the neutrino beam production,” Nucl. Instrum. Meth. A449, 609-623 (2000)
- [9] H.K.Ackerman et al., “STAR detector overview,” Nucl. Instrum. Meth. A499: 624,2003.
- [10] BNL-98815-2012-JA, JLAB-PHY-12-1652, arXiv:1212.1701
- [11] http://www.rhichome.bnl.gov/RHIC/Runs/index.html#Run-13
-
[12]
counter,
RS_P4-1614-204 GE Power System Reuter-Stokes,
http://www.ge-mcs.com/download/reuter-stokes/GEA13545B_ThermalCount.pdf - [13] http://www.nndc.bnl.gov/exfor/servlet/E4sGetTabSect?SectID=13235&req=61079&PenSectID=872
- [14] Nathan Johnson,GE Energy,Reuter-Stokes Measurements Solutions, nathan.johnson@ge.com, private communication.
- [15] STAR uses a right-handed coordinate system with its origin at the nominal interaction point and z-axis coinciding the the axis of the beam pipe. The x-axis points south, the y-axis points upward, and the z-axis points to the west. STAR Note 0229A.
- [16] James Dunlop, dunlop@bnl.gov, private communication.
- [17] D.Cronin-Hennessy and P.F.Derwent, “The CDF Run I luminosity measurement,” Fermilab-Pub-99/162-E.
- [18] ATLAS Collaboration, “Measurement of the Inelastic Proton-Proton Cross-Section at =7 TeV with the ATLAS Detector,” arXiv:1104.0326
- [19] T. Sjstrand, S. Mrenna and P. Skands, JHEP05, 026 (2006)
- [20] https://drupal.star.bnl.gov/STAR/comp/simu/geometry-tags