The Metallicity Dependence of the Cepheid P-L Relation in M101
Abstract
The impact of metallicity on the Cepheid Period-Luminosity (P-L) relation is investigated using HST ACS V and I images of M101. Variations in the reddening-free Wesenheit parameter (W), which is employed as a proxy for luminosity, are examined as a function of the radial distance from the center of M101 (and thus metallicity). We determine that there is no dependence of the slope on metallicity. However, the intercept is found to depend on metallicity by mag dex-1 and mag dex-1 using 2 and 3 sigma rejection criteria, respectively. Sigma-clipping impacts the derived metallicity dependence, and the 2-sigma criterion applied likely mitigates blending, particularly in the crowded inner regions of M101. A metallicity-corrected distance for M101 is obtained from 619 Cepheids (), a result that agrees with the recently determined SN Ia distance. The metallicity effects described can be bypassed by working at near and mid-infrared wavelengths (e.g., the Carnegie Hubble Program).
1 Introduction
Determining accurate distances to astronomical objects is a fundamental but challenging problem in astronomy, having far-reaching consequences not only for our understanding of individual objects, but more generally for the fundamental parameters of the Universe such as the Hubble Constant. The Cepheid period-luminosity (P-L) relationship has been used extensively in calibrating the extragalactic distance scale (e.g., Freedman & Madore 2011). There is, however, controversy over whether the slope and absolute intercept of this relation are universal, and to what extent they vary if they are not (e.g. Sandage et al. 2009, Tammann et al. 2008, and the references therein). We address this important question in this paper.
Theoretical models suggest that differences in the Cepheid P-L relation slope and zero-point can potentially be caused by variations in chemical composition (e.g. Marconi 2005, Caputo 2008), which could be quantifiable by investigating how these quantities depend on host-galaxy metallicity. However, more recent results from these groups (Bono et al. 2010), and others (e.g., Majaess et al. 2011, Pellerin & Macri 2011a; 2011b, Udalski et al. 2001) argue that there is an insignificant correction for metallicity in VI, and that claims to the contrary may be due to crowding. This is in agreement with the result of Rizzi et al. (2007), who find that tip of the red giant branch (TRGB) distances agree well with Cepheid distances when a metallicity correction is not applied to the Cepheid P-L relation. Many other studies find no correction on the P-L slope, but a significant correction in intercept typically around -0.25 mag dex-1 (Freedman & Madore 2011, and the references therein), although the results from some authors differ from this considerably. For instance, Romaniello et al. (2008) find the opposite sign on the correction in V (with higher metallicity stars appearing fainter), and Shappee & Stanek (2011), find a relatively steep correction in M101 of -0.80 or -0.72 mag dex-1 using two different methods. Gerke et al. (2011) also find a steep dependence on metallicity of -0.56 mag dex-1 in M81. Based on these contradictory results, it is apparent that this issue is still controversial, and requires further investigation.
The Hubble Space Telescope (HST) Key Project (Freedman, et al. 2001) sought to improve the extragalactic distance scale using Cepheids discovered in HST Wide Field and Planetary Camera 2 (WFPC2) data to calibrate several secondary distance measurement methods. They list uncertainty in the metallicity calibration of the Cepheid period-luminosity relation as one of their largest sources of error. Following Freedman & Madore’s (1990) work on M31, the HST Key Project in part undertook measurements of the metallicity dependence of the P-L relation using HST WFPC2 observations of M101 in V (F55W) and I (F814W) (Kennicutt et al. 1998). They compared the P-L relations in two radially separated fields of differing metallicities, finding a dependence of the zero-point on metallicity of mag dex-1. This study involved relatively small number statistics (26 Cepheids in the outer field, and 50 in the inner field), and the final result relied on data in only two radial zones (i.e., the difference between the outer and inner fields). The statistical significance of this and other metallicity tests at the time were low, so Freedman et al. (2001) adopted an overall metallicity correction (with a very large uncertainty) equal to the midrange of all the published empirical values ( mag dex-1), with the caveat that further investigation into the metallicity dependence was needed. Additionally, Macri et al. (2001) suggested that blending could be an issue with the M101 images. They tested this by creating artificial images of their own WFPC2 data of M31 and M81, as it would appear at the same distance and exposure time as the M101 data. They found a difference in the P-L zero-point between the original and artificial images that could account for a significant fraction of the metallicity dependence calculated by Kennicutt et al. (1998).
These issues with the WFPC2 M101 images motivated the acquisition of the data used in this project: two fields in M101 imaged by HST in the same filters as with Freedman et al. (2001), but with the superior imaging quality of the Advanced Camera for Surveys (ACS). The higher resolution and larger number statistics achievable from this data set provide the opportunity to conduct a more refined analysis of the metallicity dependence of the P-L relation over a variety of metallicities available across the field of views.
2 Data
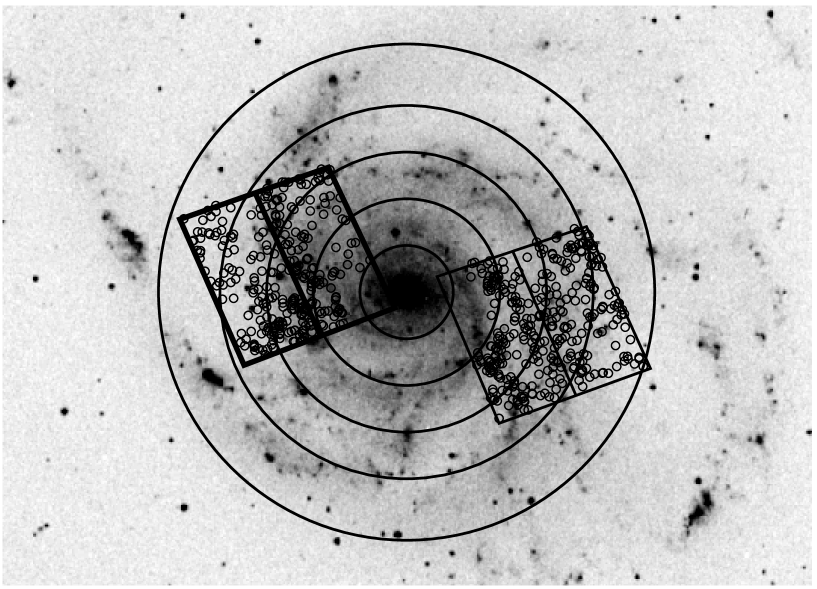
Two separate fields in M101 were observed with the HST/ACS Wide Field Camera (WFC). Each field was visited on 12 occasions ranging from days apart. On each visit (epoch), two cosmic-ray-split exposures were taken in both F814W and F555W, with a total exposure time per visit of 724 sec in F814W and 1330 sec in F555W. Figure 1 shows the location of these ACS fields overlaid on a DSS111The Digitized Sky Surveys were produced at the Space Telescope Science Institute under U.S. Government grant NAG W-2166. The images of these surveys are based on photographic data obtained using the Oschin Schmidt Telescope on Palomar Mountain and the UK Schmidt Telescope. The plates were processed into the present compressed digital form with the permission of these institutions. image of M101.
We first masked the bad pixels in the calibrated and flat-fielded individual images from the HST pipeline. Then, for each epoch, the two images in each filter were integer-shifted and combined using IRAF.222IRAF is distributed by the National Optical Astronomy Observatories, which are operated by the Association of Universities for Research in Astronomy, Inc., under cooperative agreement with the National Science Foundation. We registered the images for each field to within 1 pixel, and used DOLPHOT333By Andrew Dolphin, americano.dolphinsim.com/dolphot to identify stars and obtain their Johnson-Cousins V and I magnitudes at each epoch. For this process we used the recommended settings given in the DOLPHOT/ACS User’s Guide444americano.dolphinsim.com/dolphot/dolphotACS.pdf.
In order to avoid including objects that were too elongated, sharp, or extended to be stars (such as cosmic rays or galaxies), we selected only those detections that were determined by DOLPHOT to be a good star (type = 1). We further eliminated highly uncertain magnitudes from our analysis by excluding any individual images that were assigned a flag of 8 or greater by DOLPHOT, which refers to extreme cases of problems affecting the photometry (such as too many bad or saturated pixels). Any stars that had fewer than two good individual magnitude measurements were eliminated altogether. After applying these selection criteria, there were 425,803 objects detected in Field 1, and 487,238 in Field 2.
2.1 Selecting Cepheid Candidates
We selected possible variable stars using the variability index (L) proposed by Stetson (1996), which combines the kurtosis (K) and the Stetson variability index (J) into a single, more robust measurement of a star’s variability (Stetson 1996, Welch & Stetson 1993). The J term determines variability likelihood based on how much the individual magnitudes vary from the average magnitude, and whether the form of the variations is correlated between pairs of observations or filters. The kurtosis encapsulates the overall shape of the magnitude distribution, which will contribute to higher L values if the light curve is shaped similar to a square-wave or sinusoid, and lower values if it is composed of purely random (Gaussian) variations or only a single magnitude spike. The variability index L, is thus:
| (1) |
| (2) |
| (3) |
The sums are either taken over each of the ith observations regardless of filter, or over each of the kth pairing of observations, which in our case were comprised of the observations in V and I that were taken in each epoch. N is the total number of good observations in both filters, and Np is the total number of pairs that contained at least one good observation in one filter.
The residual of the ith magnitude measurement (mi) from the weighted average magnitude in that filter () is given by:
| (4) |
where Nx is the total number of observations in the xth filter that contributed to the mean, and is the photometric error on mi.
The average magnitude was calculated, as suggested by Stetson (1996), through an iterative process of weighting each magnitude measurement by (1+(/2)2)-1, which applies less weight to outliers from the mean. Each magnitude was also multiplied by in order to apply less weight to more photometrically uncertain measurements. We found that the average calculations converged to within 0.001 mag in iterations.
The quantity Pk combines the individual residuals within each pair of observations. In the case where the kth epoch contains good magnitude measurements in both filters (mi and mj), it is given by:
| (5) |
If the kth epoch only contained one good magnitude (mi) in a single filter, it is instead given by:
| (6) |
Furthermore, the variability index is weighted by wk, where, if there are good measurements in both filters, if there is only one good measurement, and if there are none. This is normalized by wmax, which is the total weight a star would have if it had good magnitude measurements in all of the available images (in our case, this is equal to the number of epochs, or 12).
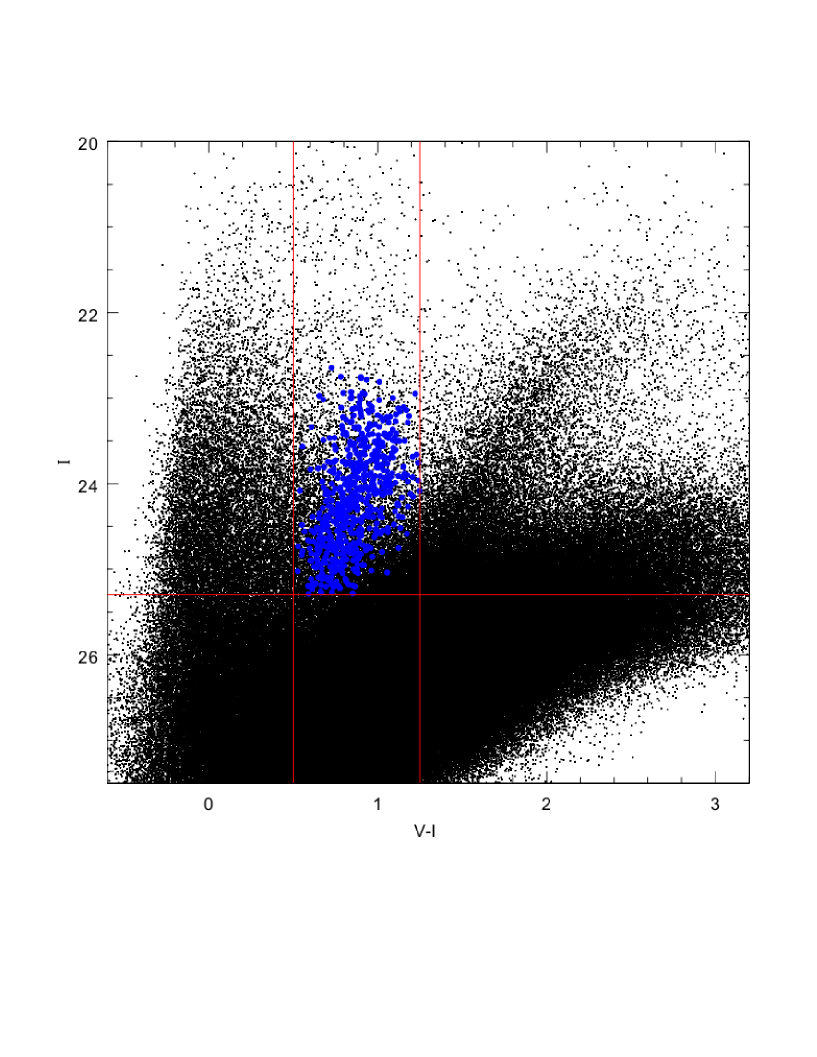
We chose a cutoff of L for the variable candidates, which corresponds to the range of values for our particular dataset within which L is correlated with the standard deviation, and is thus less likely to be dominated by random noise. We applied further constraints on the sharpness of the star as measured by DOLPHOT in V (accepting values of –0.3 to 0.3), and the crowding as measured in both V () and I (). Objects with sharpness and crowding measurements outside of these ranges were empirically found to contain a large number of extreme outliers from the expected parameters for Cepheids. Also, in order to reject stars that are not within the instability strip, and thus are likely not Cepheids, we then applied cutoffs as determined from the star’s position on the color-magnitude diagram: (V–I), and m (see Figure 2). The application of these constraints results in 650 candidate Cepheids in Field 1, and 975 in Field 2. We further constrained the sample size through visual inspection of the data, as explained in Section 2.2.
2.2 Measuring Periods and Magnitudes
In order to find trial periods for each of the candidate Cepheids, we employed the light curve string-length minimization technique originally introduced by Lafler & Kinman (1965). This method works on the principle that magnitude data points ordered by phase for a chosen period will have a minimum total path length between them when the chosen period is equal to the true period. Stetson (1996) improved upon the original formula for the string length by making it more robust against uncertain or corrupt data points, as well as to data that are not evenly sampled in phase space. After ordering the data points in ascending phase for a chosen trial period (P), this string length within a filter x is calculated using:
| (7) |
where w(i, i+1) is a weight factor given by:
| (8) |
The phase of the ith observation is = ()/P, where is the observation’s Julian date at the mid-point of the exposure.
We calculated string lengths in V for each Cepheid candidate using trial periods between 2 and 30 days, in steps of 0.01 days. This period range is limited by the sample itself, within which shorter period (fainter) Cepheids are lost in the noise, and longer periods are unobtainable because they extend beyond the window of observations. Figure 3 shows an example of the string length as a function of trial period, and Figure 4 shows the light curve and phase diagram for this star using the period obtained through string length minimization. The true period should in principle correspond to the absolute minimum value of S(P), but in practice this is not always the case: rather, the true period could correspond to any of the lowest local minima. Given this, we visually reviewed the phase curves for periods corresponding to the first few local minima, choosing the one that produced the smoothest, most ordered phase curve.
At this point we eliminated more stars from our Cepheid candidate list, setting aside those that had periods greater than the window of observations, as well as those that had periods days, which would only introduce errors into our final analysis as their light curves are extremely noisy. We also rejected variable stars that had profile shapes that were clearly not those of Cepheids, such as profiles with a very slow rise in brightness and a very fast decline, or profiles with a long flat peak or a single brief increase (or decrease) in brightness within an otherwise flat profile. Also, extremely uncertain data were rejected by eliminating stars with measurements that were too noisy or had photometric errors that were too large to be certain of the correct period. We also rejected stars where the V and I light curves were uncorrelated over a significant portion of the curve. After applying these additional constraints, we obtained a final list of 292 Cepheids in Field 1, and 327 Cepheids in Field 2. The physical locations of these Cepheids are shown in Figure 1 (small circles), and their locations on the color-magnitude diagrams are displayed in Figure 2 (blue filled circles).
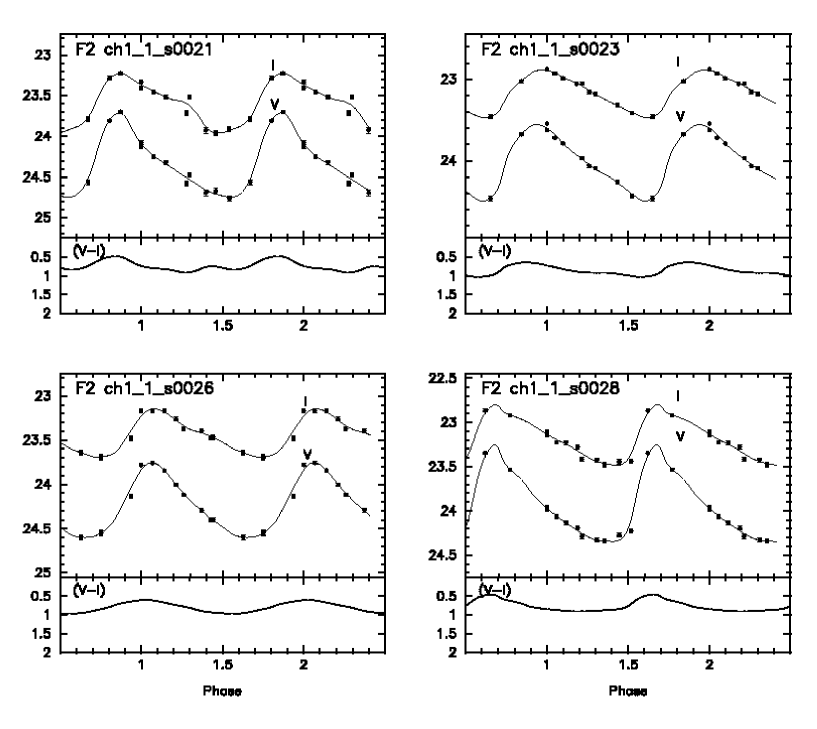
Average magnitudes for these Cepheids were determined using GLOESS (e.g., Persson et al. 2004), an algorithm that smoothly fits a curve to the data points using local regression, and then determines the average magnitude of the fit. Examples of some of the phase-ordered Cepheid light curves and their fits are given in Figure 5. All of the light curves are available in the online edition. Table 1 lists the Celestial coordinates, average magnitudes, periods, V and I amplitudes, radial distance from the center of the galaxy, and log(O/H) metallicity for ten of the Cepheid candidates (full table available online).
We check our magnitudes and periods for accuracy by comparing our results to Stetson et al. (1998), whose HST WFPC2 images overlap with our Field 1. Figure 6 shows a comparison of the periods and V and I band magnitudes of the Cepheid stars with positions in the registered images that match within 7 pixels. We find no systematic difference between the two samples, with a median residual in the periods of only 0.07 days, and a standard deviation from zero of the difference between the samples of 0.13 mag, 0.24 mag, and 0.74 days for V, I, and period, respectively.
3 Results
3.1 Metallicity Dependence of the Wesenheit P-L Relation
We use the Wesenheit parameter (Madore 1982) for luminosity in our P-L relations, which is unaffected by reddening, and thus results in lower scatter in our plots than V or I. Use of the Wesenheit parameter has also been shown to produce a more linear P-L relation than that obtained from the individual pass-bands (Ngeow & Kanbur, 2005), and a constant slope regardless of metallicity (Bono et al. 2010). It is particularly robust in V and I: Bono et al. (2010), for instance, find a metallicity gradient of the zero-point in WVI of only mag dex-1, compared to their more significant gradient in WBV of mag dex-1. In light of its robustness relative to straight P-L relations, Bono et al. (2010) suggest that the Wesenheit parameter provides a preferable method of measuring the distance modulus of galaxies relative to the LMC, as long as any metallicity dependence of the zero-point is taken account. The Wesenheit parameter is calculated for each star using their V and I magnitudes with:
| (9) |
A global total-to-selective absorption ratio A(V)/E(V-I) of 2.45 was used for both the Key Project (Freedman, et al. 2001) and the independent measurement of the metallicity dependence in M101 conducted by Shappee & Stanek (2011) on the same dataset used in this paper. We adopt the same value for consistency.
Figure 7 shows W as a function of the log of the periods for all of our Cepheid candidates, including a linear least-squares fit to the data that iteratively excludes all data-points with greater than 2-sigma deviation from the fit. This results in an overall P-L relation of:
| (10) |
For comparison, we list the slopes for Wesenheit VI P-L relations derived from different galaxies in Table 2. The relation for non-Lutz-Kelker bias corrected Galactic Cepheids was obtained by Benedict et al. (2007), and we derived W for the LMC and SMC by applying Equation 9 to the V and I P-L relations determined from OGLE III data by Soszynksi et al. (2008) and (2010), respectively. Our slope for M101 of falls within the mutual 1- uncertainties of the Galactic and LMC slopes, and is just outside of 1- for the SMC. The SMC has a particularly low metallicity, but there is no apparent trend of slope with the average iron metallicity of each galaxy, as given in Table 2 and measured by Mottini et al. (2006).
Even when using the reddening-free Wesenheit parameter, there is significant scatter in the P-L plot in Figure 7. Some of this may be due to differences in metallicity, which depends on the location of the star within its host galaxy, where metallicity in general increases toward the galaxy center. We investigate these potential metallicity effects by separating the Cepheids into -wide annuli according to their radial distance from the center of the galaxy, and then recalculating the P-L relation for each of these distance bins. The average [O/H] metallicity of each star is calculated using the relationship derived by Kennicutt et al. (2003) from abundance measurements of HII regions in M101:
| (11) |
We use a disk scale length, Ro, of 14.85′, or 32.4 kpc at Kennicutt et al.’s (2003) adopted distance of 7.5 Mpc to M101.
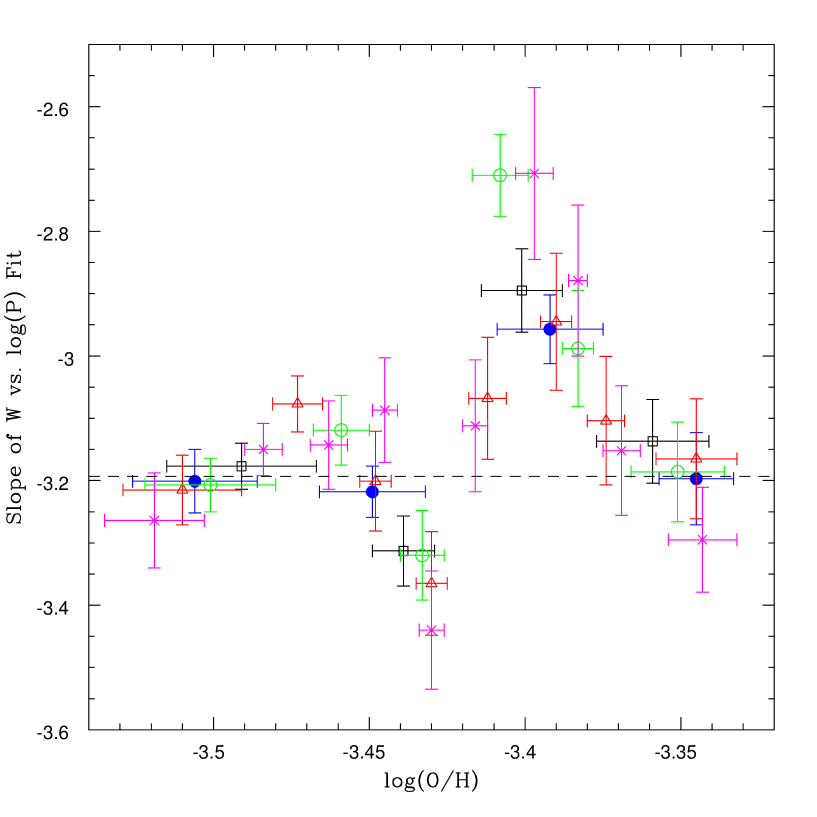
The slope of the P-L relations is plotted in Figure 8 for the arcminute annuli with blue filled circles, as a function of the average log(O/H) metallicity of each of the Cepheids in each distance bin. To determine if the dependence of the slope on metallicity varies with bin selection, we also plot the slopes for four other sample sets chosen in different ways: 4 annuli with stars in each (black open squares), 6 annuli with stars in each (green open circles), 8 annuli with stars in each (red open triangles), and 10 annuli with stars in each (magenta crosses). We see no difference in behavior of the slope vs. metallicity with distance bin selection, and no significant dependence of the slope in any of the sample sets on metallicity. As such we adopt the slope calculated from the entire sample (from Eq. 10) for each of the arcminute-sized distance bins. This is consistent with the lack of a trend in slope as a function of average galaxy metallicity as shown in Table 2.
Figures 9 through 12 demonstrate the P-L relation for each of the distance bins, with the slope of the fit fixed to that from the entire dataset. The fits deviate from that of the entire dataset (thick long-dashed line) in a systematic way, with the intercept becoming progressively fainter as the distance from the center of the galaxy increases. It is also of note that there is a smaller proportion of long-period to short-period Cepheids at progressively larger radial distances. This demonstrates the radial composition gradient within the galaxy, as higher metal abundances have been shown to produce a higher frequency of brighter, longer period Cepheids (Becker et al. 1977).
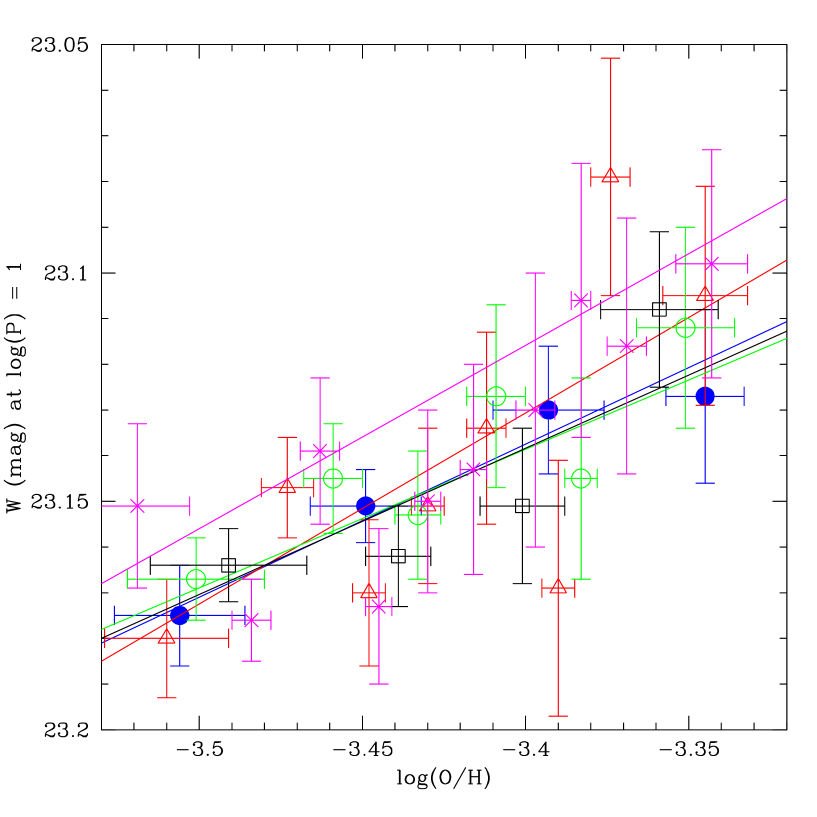
The intercept of the P-L relations is plotted in Figure 13 as a function of the average log(O/H) metallicity in each distance bin. Here we do find a significant dependence on metallicity, with a weighted linear least-squares fit to the data yielding a slope of mag dex-1. This corresponds to an increase in brightness of Cepheids with increasing metallicity, and decreasing distance from the galaxy center.
The sample choice above relies on only four distance bins, with a variable number of Cepheids in each. To determine if this has an effect on our results, we calculate the P-L relation intercept as a function of metallicity for several different samples of Cepheids chosen in different ways, using the same distance bins as those selected for Figure 8. The results are plotted in Figure 14, and include the above arcminute annuli (blue filled circles) that have a variable number of stars in each (49 to 204), and four other sample sets with variable annulus sizes selected to have roughly the same number statistics in each bin: 4 annuli with stars in each (black open squares), 6 annuli with stars in each (green open circles), 8 annuli with stars in each (red open triangles), and 10 annuli with stars in each (magenta crosses). Weighted linear least-squares fits were determined for each sample, and plotted in the figure with the same color as their corresponding data points. The slope varies between the samples from -0.30 to -0.42 mag dex-1, which agrees within the uncertainties with the 1 arcminute bin size result of mag dex-1. As such, we conclude that there is no significant dependence on sample selection.
3.2 Distance to M101
We find the distance to M101 with respect to the LMC using the LMC P-L relations below (Vo and Io), as determined by Soszynski et al. (2008) from the 3361 Cepheids in OGLE-III (Optical Gravitational Lensing Experiment Survey).
| (12) |
| (13) |
Applying Equation 9 to these V and I P-L relations, with an adopted A(V)/E(V-I) of 2.45, yields a reddening-free Wesenheit P-L relation for the LMC of
| (14) |
If we adopt a true distance modulus to the LMC of 18.48 mag (Freedman et al. 2012, Monson et al. 2012), as determined from the Cepheid P-L relation in the infrared with the Spitzer Space Telescope (Scowcroft et al. 2011), then the non-metallicity corrected distance modulus to M101 is
| (15) |
We calculate this distance modulus for each Cepheid in our sample, and plot the results as a function of metallicity in Figure 15. An iterative linear least-squares fit to the data, with a 2-sigma rejection level, is shown in the figure. There is a small, but significant dependence of the derived distance modulus with metallicity, corresponding to larger moduli at lower metallicities, or greater radial distances from the galaxy center. We therefore define our distance modulus to M101 as that derived from the fit to the data at the metallicity of the LMC. As in the Key Project (Freedman et al. 2001), we adopt a metallicity of log(O/H) + 12 = for the LMC. At this metallicity, the distance modulus for M101 is . This is within the range of values from the Supernova Ia distance of 28.86 to 29.17 mag (Matheson et al. 2012), and agrees with the mean distance modulus of calculated by the NASA/IPAC Extragalactic Database (NED) from 46 independent distance measurements. It is, however, outside the mutual errors of the TRGB distance of (random) (systematic) obtained by Lee & Jang (2012).
4 Discussion of Results
We find no significant dependence of the slope of the Wesenheit P-L relation on metallicity, which is consistent with Bono, et al.’s (2010) findings from the combination of 87 independent Cepheid data sets. Theoretical models predict a steepening of the P-L relation with increased metallicity (e.g. Caputo 2008), but the use of the Wesenheit parameter largely removes these effects (Madore & Freedman 2009, Bono et al. 2010). Shappee & Stanek (2011) do find a modest increase in slope in the Wesenheit P-L relation of M101 with increasing metallicity of mag log(day)-1, but mention that the result is tenuous enough that it could be due to a statistical fluctuation in the data. As such, we consider our results to be consistent.
We find a significant dependence of the intercept of the Wesenheit P-L relation on metallicity of mag dex-1, which is steeper than, but in agreement with, the value of mag dex-1 found through the HST Key Project (Kennicutt et al. 1998). This is a weaker dependence than that obtained by Shappee & Stanek’s (2011) from the same dataset ( (random) (systematic) or (random) (systematic)). However, when we relax our 2-sigma rejection criteria to an iteratively obtained 3-sigma deviation from the fit, we find a metallicity dependence of mag dex-1, which agrees well with Shappee & Stanek’s (2011) values. We investigate the effects of the rejection criteria in Figure 16, where we plot for various sigma rejection limits. Here we find that the slope of the P-L intercept vs. metallicity becomes systematically less steep with stricter rejection limits, and is minimized at 2-sigma. We attribute this to the fact that stricter rejection limits are more robust to outliers. Rejections stricter than 2-sigma, however, produce results that do not follow this trend, and are likely affected by random noise due to low number statistics. Our sample size thus limits the effectiveness of the sigma-clipping algorithm below 2-sigma, and as such, we use the 2-sigma rejection limit for the final quoted result for this paper. The steeper metallicity dependence we find with relaxed rejection constraints is an interesting result that may possibly be due to blending in the more crowded inner regions of the galaxy. Tighter constraints will help to remove blended stars from the fit, thus producing a more reliable result. We further investigate the possible effects of blending below.
Majaess et al. (2011) applied the Shappee & Stanek’s (2011) metallicity correction of -0.80 mag dex-1 to the Magellanic Clouds, and found that the distance to the galaxies obtained through this correction was in strong disagreement with those published through other methods, with no correction producing much more consistent results. They therefore argue that the VI Wesenheit P-L relation is insensitive to metallicity, and that Cepheid metallicities therefore offer a negligible source of uncertainty to derived extragalactic distances. They suggest that the steep dependences on metallicity found in other studies are due to blending effects in the more crowded inner region of the galaxies, which would mimic a brightening of the P-L relation due to increased metallicity. This is consistent with the results of other authors such as Udalski et al. (2001), who also find no metallicity dependence of the P-L relation when comparing its slope and intercept between three individual galaxies in the OGLE-II microlensing survey that are negligibly affected by blending. Mochejska et al. (2004) show that blending and crowding can have a significant effect by comparing the fluxes obtained for Cepheids in ground-based and HST images, and that the problem is worse for more distant galaxies where linear resolution is poorer.
If blending were an issue in our data, we would expect to see an overall decrease in the average amplitude of the light curves of Cepheids in the increasingly more crowded regions, as the blending damps the observed light variations. We test this possibility by plotting the V-band amplitude of the Cepheids’ light curves as a function of period in Figure 17, with the stars separated into their arcmin radial distance bins. As was also observed in the distance-separated P-L relations (Figures 9 through 12), there is a larger proportion of short-period Cepheids at larger distances from the center, which could at least in part be due to the galaxy’s radial metallicity gradient (Becker et al. 1977). The higher surface brightness in the inner-most regions may also contribute to this effect, as more of the fainter short-period Cepheids in the inner bins would have been rejected due to low signal-to-noise than in the outer bins. We do observe an increase in amplitude with increasing radial distance only between the inner 1-2’ and 2-3’ bins, but not in the outer-most bins, where the upper-envelope of amplitudes is instead decreasing with increasing radial distance. This may be due to metallicity effects: some studies have shown that the amplitudes of longer-period Cepheids are larger in higher metallicity environments (van Genderen 1978, Paczynski & Pindor 2000), which would explain the decreasing amplitude with increasing radial distance in the outer distance bins in Figure 17. This implies that blending may be a factor only in the central one to two radial bins. However, Szabados & Klagyivik (2012) note that Cepheid amplitudes are smaller at higher metallicity, especially for short-period Cepheids. Additionally, there are few high-amplitude short-period Cepheids in each of our distance bins, so the lack of these types of stars in the outer-most bin may be due to statistical fluctuations. As such, the trends seen in Figure 17 may be inconclusive.
We can investigate this further by observing the scatter in the P-L relations for each of the individual bins (Figures 9 through 12). If the amount of blending is increasing toward the central, more crowded, regions of the galaxy, then we would expect the scatter of the P-L relation to be progressively larger at smaller radial distances from the center. This is an effect that is readily apparent, for instance, in plots of the distance modulus derived from Cepheids at different galaxy radii for the M33 and M106 data in Majaess, et al. (2009). There the scatter is significantly larger for Cepheids in the inner region of the galaxy than those in the outer region. In our M101 images, the one-sigma scatter of the data from the fit for each of the distance bins (from the inner-most to the outer-most) is 0.100, 0.157, 0.107, and 0.093 mag. Although the outer-most distance bin has the lowest scatter, there is otherwise no apparent trend with radial distance. However, if we relax the rejection constraints from 2-sigma to 3-sigma, we see a one-sigma scatter of the data from the fit (from the inner-most to the outer-most distance bin) of 0.202, 0.203, 0.188, and 0.125 mag. As with the Majaess, et al. (2009) data, this demonstrates a progressively tighter P-L relationship outside 3 arcminutes radius. If the additional scatter in the inner regions is due to blending, it could create a systematic error in magnitude that is too bright with decreasing distance, and thus result in a metallicity dependence that is too steep. This is a possible explanation for the steeper metallicity dependence that we calculate from the more relaxed rejection levels. The relative lack of this trend in the 2-sigma rejected data further suggests that the stricter rejection criterion is more effective at removing blending effects, and is thus more robust. This suggests that blending has a negligible effect on our 2-sigma result, and we proceed with that result accordingly.
The difference in amplitude and scatter of our Cepheids with different rejection constraints suggests that blending is an issue, and some correction must be applied to Cepheid studies to account for this. We reject outliers through a sigma-clipping algorithm here to minimize the effects of blending, but other corrections can be applied to each star based on the assumed effects of crowding, such as that developed by Riess et al. (2009). Whatever method is used, it is clear that extra caution should be exercised in the inner crowded fields of extragalactic Cepheid studies.
The dependence of the P-L zero-point on metallicity derived in any study is also highly sensitive to the adopted radial metallicity gradient. There has been significant contention, for instance, on the value of the metallicity gradient in NGC 4258 (Bresolin 2011, Bono et al. 2008), which significantly impacts conclusions on the metallicity dependence of the P-L relation. This is therefore another possible source of error which could be minimized with the acquisition of more accurate metallicity measurements.
5 Improving Cepheid Distances by Observing in the Infrared
Freedman et al. (2011) show that the P-L relation from 3.6 Spitzer observations have minimal systematic effects due to both extinction and metallicity. They calculate that improvements in the extragalactic distance scale calibration by using infrared Cepheid relations can allow future work to improve the 10% uncertainty on the Hubble Constant found in the Key Project (Freedman, et al. 2001) to less than 2%. As with the optical, however, crowding can also be an issue in the infrared.
To address known systematics in an attempt to derive an increasingly precise and accurate value of the Hubble constant the Carnegie Hubble Program (Freedman et al. 2012) has been using Spitzer to observe known Cepheids in the mid-infrared. This has led to two new realizations, one concerning the dominant source of crowding in the mid-IR and the other concerning the sensitivity of select mid-IR bands to metallicity.
The (confirmed) expectation about crowding in the near and mid-infrared was that the OB-star populations, that are coeval and generally co-located with Cepheids, are less important sources of crowding as one moves to longer wavelengths where the intrinsically redder Cepheids become brighter than the bluer OB stars. However, a second population of contaminating sources come to the fore-front, especially at mid-IR wavelengths: the dust-enshrouded and intrinsically red (but still very luminous) asymptotic giant branch (AGB) stars. More uniformly spread over the field, the intermediate-aged AGB star population quickly becomes the dominant (new) source of contamination for Cepheids. At the largest distance at which Cepheids have been currently discovered the AGB population severely limits the use of Spitzer; only much higher resolution observations will overcome this confusion-limiting factor.
As shown in Monson et al. (2012) and Scowcroft et al. (2011) the use of mid-infrared bands (specifically the IRAC 3.6 and 4.5m of Spitzer) can be used to further reduce the effects of reddening in determining true distance moduli to Cepheids in nearby galaxies. One surprising result was that the 4.5m band is singularly sensitive to metallicity, for the longest-period (coolest) Cepheids. This is due to the presence of a CO band head lying across the 4.5m region of the spectrum. The 3.6m filter is unaffected by CO and appears to be measuring pure continuum radiation. Thus the anticipated advantages of moving as far into the mid-infrared as possible (to reduce the systematic effects of reddening) are met at 3.6m, but complicated by metallicity effects in the 4.5m band. However, it should be noted that the CO is effectively gone (the molecule is dissociated) from atmospheres of shorter-period (hotter) Cepheids, should future studies need to use this band and these hotter Cepheids for distance determinations.
References
- Becker (1977) Becker, S. A., Iben, I., & Tuggle, R. S. 1977, ApJ, 218, 633
- Benedict (2007) Benedict, G. F., McArthur, B. E., Feast, M. W., et al. 2007 AJ, 133, 1810
- Bono (2008) Bono, G., Caputo, F., Florentino, G., Marconi, M., & Musella, I. 2008, ApJ, 684, 102
- Bono (2010) Bono, G., Caputo, F., Marconi, M., & Musella, I. 2010, ApJ, 715, 277
- Bresolin (2011) Bresolin, F. 2011, ApJ, 729, 56
- Caputo (2008) Caputo, F. 2008, Memorie della Soc. Astron. Ital., 79, 453
- Cardelli (1989) Cardelli, J. A., Clayton, G. C., & Mathis, J. S. 1989, ApJ, 345, 245
- Freedman (1990) Freedman, W. L., & Madore, B. F. 1990, Apj, 365, 186
- Freedman (2001) Freedman, W. L., Madore, B. F., Gibson, B. K., et al. 2001, ApJ, 553, 47
- Freedman (2011) Freedman, W. L. & Madore, B. F. 2011, ApJ, 734, 46
- Freedman (2012) Freedman, W. L., Madore, B. F., Scowcroft, V., et al. 2012, ApJ, 758, 24
- Gerke (2011) Gerke, J. R., Kochanek, C. S., Prieto, J. L., Stanek, K. Z., & Macri, L. M. 2011, ApJ, 743, 176
- Kennicutt (1998) Kennicutt, R. C., Stetson, P. B., Saha, A., et al. 1998, ApJ, 498, 181
- Kennicutt (2003) Kennicutt, R. C., Bresolin, F., & Garnett, D. R. 2003, ApJ, 591, 801
- Lafler (1965) Lafler, J., & Kinman, T. D. 1965, ApJS, 11, 216
- Lee (2012) Lee, M. G., & Jang, I. S. 2012, Apj, 760, 14L
- Macri (2001) Macri, L. M., Calzetti, D., Freedman, W. L., et al. 2001, ApJ, 549, 721
- Madore (1982) Madore, B. F. 1982, ApJ, 253, 575
- Madore (2009) Madore, B. F., & Freedman, W. L. 2009, ApJ, 696, 1498
- Majaess (2009) Majaess, D., Turner, D., & Lane, D. 2009, AcA, 59, 403
- Majaess (2011) Majaess, D., Turner, D., & Gieren, W. 2011, ApJL, 741, 36
- Marconi (2005) Marconi, M., Musella, I., & Fiorentino, G. 2005, ApJ, 632, 590
- Matheson (2012) Matheson, T., Joyce, R. R., Allen, L. E., et al. 2012, astro-ph, arXiv:1205.3828v1
- Monson (2012) Monson, A. J., Freedman, W. L., Madore, B. F., et al. 2012, ApJ, 759, 146
- Mottini (2006) Mottini, M., Romaniello, M., Primas, F., et al. 2006, MmSAI, 77, 156
- Ngeow (2005) Ngeow, C., Kanbur, S. M. 2005, MNRAS, 360, 1033
- Paczynski (2000) Paczynski, B. & Pindor, B. 2000, ApJ, 533, L103
- Pellerin (2011a) Pellerin, A. & Macri, L. M. 2011, ApJS, 139, 26
- Pellerin (2011b) Pellerin, A. & Macri, L. M. 2011, BAAS, 217, 311.05
- Persson (2004) Persson, S. E., Madore, B. F., Krzeminski, W., Freedman, W. L., Roth, M., & Murphy, D. C. 2004, AJ, 128, 2239
- Riess (2009) Riess, A. G., Macri, L., Casertano, S., et al. 2009, ApJ, 699, 539
- Rizzi (2007) Rizzi, L., Tully, R. B., Makarov, D., et al. 2007, ApJ, 661, 815
- Romaniello (2008) Romaniello, M., Primas, F., M, Mottini, M., et al. 2008, A&A, 488, 731
- Sandage (2009) Sandage, A., Tammann, G. A., Reindl, B. 2009, A&A, 493, 471
- Scowcroft (2011) Scowcroft, V., Freedman, W. L., Madore, B. F., et al. 2011, ApJ, 743, 76
- Shappee (2011) Shappee, B. J., & Stanek, K. Z. 2010, ApJ, 733, 124
- Soszynski (2008) Soszynski, I., Poleski, R., Udalski, A., et al. 2008, AcA, 58, 163
- Soszynski (2010) Soszynski, I., Poleski, R., Udalski, A., et al. 2010, AcA, 60, 17
- Stetson (1996) Stetson, P. B. 1996, PASP, 108, 851
- Stetson (1998) Stetson, P. B., Saha, A., Ferrarese, L., et al. 1998, ApJ, 508, 491
- Szabados (2012) Szabados, L. & Klagyivik, P. 2012, A&A, 537, 81
- Tammann (2008) Tammann, G. A., Sandage, A., Reindl, B. 2008, ApJ, 679, 52
- Udalski (2001) Udalski, A., Wyrzykowski, L., Pietrzynski, G., et al. 2001, AcA, 51, 221
- van Genderen (1978) van Genderen, A. M. 1978, A & A, 65, 147
- Welch (1993) Welch, D. L., & Stetson, P. B. 1993, AJ, 105, 1813


| ID | RA | DEC | V | Verr | I | Ierr | Period | Vamp | Iamp | r | [O/H] |
|---|---|---|---|---|---|---|---|---|---|---|---|
| (deg) | (deg) | (mag) | (mag) | (mag) | (mag) | (days) | (mag) | (mag) | (′) | ||
| F1 ch1_1_s0001 | 210.92486 | 54.377676 | 24.341 | 0.037 | 23.522 | 0.022 | 18.75 | 1.192 | 0.676 | 4.605 | -3.519 |
| F1 ch1_1_s0002 | 210.91499 | 54.351110 | 24.250 | 0.039 | 23.389 | 0.022 | 21.83 | 1.216 | 0.671 | 3.935 | -3.478 |
| F1 ch1_1_s0003 | 210.92911 | 54.367757 | 24.141 | 0.030 | 23.462 | 0.018 | 17.54 | 0.876 | 0.495 | 4.564 | -3.517 |
| F1 ch1_1_s0004 | 210.90501 | 54.356026 | 24.407 | 0.035 | 23.465 | 0.023 | 23.93 | 1.097 | 0.672 | 3.608 | -3.459 |
| F1 ch1_1_s0006 | 210.91080 | 54.378757 | 24.954 | 0.025 | 23.993 | 0.016 | 17.30 | 0.736 | 0.457 | 4.180 | -3.493 |
| F1 ch1_1_s0007 | 210.89823 | 54.376252 | 25.033 | 0.028 | 24.229 | 0.019 | 12.91 | 0.817 | 0.613 | 3.719 | -3.465 |
| F1 ch1_1_s0008 | 210.91577 | 54.373818 | 24.554 | 0.024 | 23.490 | 0.012 | 13.55 | 0.691 | 0.341 | 4.226 | -3.496 |
| F1 ch1_1_s0009 | 210.90939 | 54.367997 | 24.571 | 0.025 | 23.749 | 0.018 | 14.83 | 0.763 | 0.529 | 3.903 | -3.477 |
| F1 ch1_1_s0012 | 210.90896 | 54.369264 | 24.987 | 0.031 | 24.164 | 0.017 | 11.40 | 0.970 | 0.500 | 3.911 | -3.477 |
| F1 ch1_1_s0013 | 210.89089 | 54.370105 | 24.981 | 0.027 | 23.841 | 0.018 | 18.75 | 0.891 | 0.557 | 3.335 | -3.442 |
Note. — Measured quantities for 10 Cepheid candidates. A table listing all 619 candidates is available in the online edition. Coordinates are in J2000.
| Sample | Slope | Slopeerr | [Fe/H] | [Fe/H]err |
|---|---|---|---|---|
| Galactic | -3.30 | 0.12 | 0.0 | 0.1 |
| LMC | -3.25 | 0.04 | -0.33 | 0.13 |
| SMC | -3.29 | 0.06 | -0.75 | 0.08 |
Note. — The slope (column 2) and errors (column 3) of the Wesenheit period-luminosity relation derived from V and I data in different galaxies (as labeled in column 1). Average iron metallicities are shown in column 4 with their errors in column 5. There is no readily apparent dependence of the slope on metallicity. Our M101 slope of falls within 1- of the Galactic and LMC values, and just outside of 1- for the SMC.