Self-organized pattern formation in laser-induced multiphoton ionization
Abstract
We use finite-difference time-domain modelling to investigate plasma generation induced by multi-photon absorption of intense laser light in dielectrics with tiny inhomogenities. Plasma generation is found to be strongly amplified around nanometer-sized inhomogeneities as present in glasses. Each inhomogeneity acts as the seed of a plasma structure growing against the direction of light propagation. Plasma structures originating from randomly distributed inhomogeneities are found to interact strongly and to organize in regularly spaced planes oriented perpendicularly to the laser polarization. We discuss similarities between our results and nanogratings in fused silica written by laser beams with spatially homogeneous as well as radial and azimuthal polarization.
pacs:
33.80.Rv, 81.16.Rf, 42.25.Ja, 61.80.BaMany dielectrics as e.g. silica glasses are known to be transparent within a wide frequency range. Only at high intensities absorption becomes possible, as electrons are promoted to the conduction band by nonlinear ionization processes.Mainfray and Manus (1991) The strong intensity dependence of multiphoton ionization allows for the selective excitation and laser-induced modification of a small focal region situated inside a material volume. Different kinds of material modification have been observed, including refractive index changes,Davis et al. (1996) void formationGlezer and Mazur (1997) and subwavelength volume grating formation.Shimotsuma et al. (2005); Bhardwaj et al. (2006); Hnatovsky et al. (2011)
Previous modelling efforts concerning laser energy deposition in dielectrics have concentrated on the temporal and spatial evolution of the laser pulse itself, while treating the material as homogeneous.Petrov and Davis (2008); Bourgeade et al. (2010); Bulgakova et al. (2013); Mezel et al. (2008) As far as nonlinear self-organization is concerned, a certain seed is required to start the process. Therefore, we follow a different approach and investigate the interaction of laser light with nanometer-sized inhomogeneities. This is of fundamental interest due to the inherent inhomogeneity of amorphous materials like silica glasses.Doremus (1966) Such inhomogeneities have also been suggested to play a major role in volume nanograting formation.Rajeev et al. (2007)
Our simulations are based on the standard parameters which can be found in the literature. A good overview of the parameters of laser light and free carriers present during nanograting formation has been given by Bulgakova et al.Bulgakova et al. (2013). There, the intensities achieved by focussing and nonlinear propagation inside the homogeneous material cause smooth, submetallic carrier density distributions. We use similiar parameters, but in our case material inhomogeneities increase the local intensity and cause the formation of plasma spots. We demonstrate, that the ionization process is independent of the exact shape and nature of the initial inhomogeneities. However we can identify two regimes depending on the local carrier densities that are reached during irradiaton. For low carrier densities, ionization enhancement remains confined to the initial region of field enhancement close to an inhomogeneity. For higher carrier densities, a single nanoplasma forming at an inhomogeneity site enhances further ionization in its vicinity and acts as a seed for the growth of an extended structure. This regime of strong interaction is similar to the ionization instability which has been predicted for tunneling ionization in gassesEfimenko and Kim (2011); Efimenko et al. (2009) and which has been suggested to play a similiar role in the ionization of transparent dielectrics.Bulgakova et al. (2013) In both cases, intricate structures with high carrier densities can be formed. However, the local field enhancement around an existing nanoplasma plays a much more important role in our case.
We further examine optical self-organization in material systems with randomly distributed nanometer-sized inhomogeneities. We observe the formation of planar structures aligned perpendicularly to the laser polarization with a self-organized period related to the laser wavelength. We discuss the similarities to experimentally observed nanograting damage patterns and the possible connection of our results to these phenomena.
I Numerical Model
For our model, we use a nonlinear finite-difference time-domain (FDTD) approach, which previously has been applied to the modelling of ionization and void formation in silica.Peñano et al. (2005); Mezel et al. (2008) Maxwells equations
| (1) |
with are solved using the standard FDTD algorithm.Yee (1966); Taflove and Hagness (2005) The response of the unexcited medium, which is dominated by valence band electrons, is included in the background permittivity , using a linear refractive index .
We also incorporate the Kerr effect using the third-order material polarization . This formulation assumes a scalar third order susceptibility ,Gamaly et al. (2006) which is a good approximation for linearly polarized light propagating in glass.
The remaining contributions to the material response are included via the current density , where the ionization current is used to model the energy loss of the electric field due to multiphoton ionization, which excites electrons to the conduction band. describes the optical response of these newly generated conduction band electrons based on a Drude model
| (2) |
In a complete model, the electron collision frequency would have to be assumed to depend on carrier density and temperature. As a simplification, we assume it to have a constant value lying in the range of reported values.Sudrie et al. (2002); Mao et al. (2003); Bulgakova et al. (2013) As long as the resonant field-enhancement close to a nanoplasma is not completely damped by collisions, final results have turned out to be mostly independent of .
The time dependent conduction band carrier density is described with a rate equation taking into account multiphoton ionization and recombination
| (3) |
In this model, the free carrier density reaches saturation at a value of .Peñano et al. (2005) The electron recombination time is .Audebert et al. (1994) For an excitation wavelength of and a fused silica target with a band gap of , photons are needed to promote an electron to the conduction band, resulting in an ionization rate
| (4) |
with a cross-section of .Gamaly et al. (2006) An expression for can be derived by equating the energy gain of electrons due to multiphoton ionization to the energy loss of the electric field , yielding
| (5) |
The nonlinear equations that describe the electric field, ionization loss and carrier density are solved using a fixed-point iteration method at each FDTD-timestep.
Additional attention has to be paid to the modelling of inhomogeneities. As glass is an amorphous solid, nanosize inhomogeneities are always present due to local variations in the chemical structureRichter et al. (2012) and to actual voids or gas inclusions.Doremus (1966); Hasegawa et al. (2000) It has also been reported, that material nonlinearities can be enhanced by a history of previous laser-irradiation.Richter et al. (2012); Rajeev et al. (2006); Lancry et al. (2011) Such effects could lead to an additional inhomogeneity in the nonlinear response. According to literature, voids in conventional silica take up a fraction of of the material volumeDoremus (1966) and have an average size of ,Hasegawa et al. (2000) resulting in a mean spacing below . Such voids should be an appropriate model for a typical inhomogeneity. As will be shown in section II, ionization around a void leads to the same final plasma structure as ionization around a region with an enhanced ionization cross-section. Additionally, final results do not depend on the actual shape of the inhomogeneity, as long as the initial size does not exceed a few nanometers. This is to be expected, since scattering from small objects is dominated by the dipole mode and does not depend on the specific shape.Bohren and Huffman (1983) This means that once initial results are established with a fine discretization () and realistic inhomogeneities, we can safely use comparatively large seed inhomogeneities and coarse discretizations. Nevertheless, to properly resolve the inhomogeneities and the induced plasma structures, the resolution should not exceed . As the simulation of multiple laser pulses and the subsequent material modifications are outside the reach of present computational resources, we limit our scope to continous illumination in order to understand the potential of purely optical self-organization processes. This approach can be viewed both as a limiting case of single-pulse excitation and as an extrapolation of the excitation with multiple pulses.
In all presented cases, the simulation volume is situated deep inside the bulk of the material. At the material boundaries far away from the focal region of the laser, intensities are considerably lower. We will start out with simple geometries where the exciting field is approximated as a plane wave and then proceed to more realistic simulations with focussed sources. The simulation volume is terminated by perfectly matched layersTaflove and Hagness (2005) in propagation direction. In transverse direction, we choose periodic boundary conditions. Initially, the material is taken to be unexcited and the conduction band carrier density is set to .
II Simulation Results
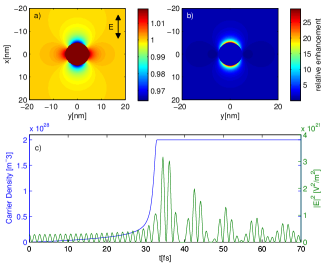
Our simulations focus on the interaction of intense laser-light with materials with randomly distributed nanometer-sized inhomogeneities. To get a feeling for the basic processes, we start with a very simplified, but quasi-analytical model. We consider a spherical subwavelength inhomogeneity, in which plasma generation can occur due to a non-vanishing ionization cross-section. Plasma generated inside the sphere according to Eq. 3 causes a decrease of the dielectric constant according to Eq. 2. In the case of a sphere much smaller than the exciting wavelength, the fields can be calculated in a quasi-static approximationBohren and Huffman (1983); Jackson (1999) (Figs. 1(a),(b)). Combined with envelope approximations of Eqs. 2 and 3, this model can also serve to estimate the temporal evolution of the carrier density and electric field strength inside the sphere (Fig. 1(c)). According to the electrostatic approximation, a dipole wave is excited at the inhomogeneity site and interferes with the incident plane wave. Intensity is enhanced both inside the sphere and at its equator perpendicular to the incident electric field vector (Fig. 1(a)). The free electron density inside the sphere increases due to the positive feedback between the local electric field and the plasma refractive index (Fig. 1(c)). Eventually, the plasma reaches a carrier density where the dipole-resonance of the sphere comes close to the excitation frequency ().
At this point, carrier densities increase almost exponentially. The scattered field is now strongly enhanced and solely determines the nearfield intensity pattern. Due to the strong field enhancement, ionization continues even up to the maximum carrier density , where saturation sets in. Pronounced intensity maxima now lie at the poles of the nanoplasma (Fig. 1(b)).
If ionization in the surrounding medium is taken into account, this field enhancement leads to the formation of an ionized region growing into the direction of the electric field. Since scattering is now mostly caused by the induced nanoplasma, the final structure is invariant concerning the microscopic details like shape, size and chemical nature of the seed inhomogeneity. Even if the initial inhomogeneity is a void instead of a region with an enhanced nonlinearity, field enhancement around the void leads to an amplified plasma generation, resulting in a similiar evolution if a certain threshold is exceeded. To verify these guesses, we turn our attention to the complete FDTD-based model as described in section I.
We initially restrict simulations to a two-dimensional geometry, since this has shown to illustrate the growth process more clearly than the full three-dimensional case. For our later simulations we will return to three-dimensional geometries and show that the plasma structures growing in random media tend to reproduce the features seen in a 2D simulation.
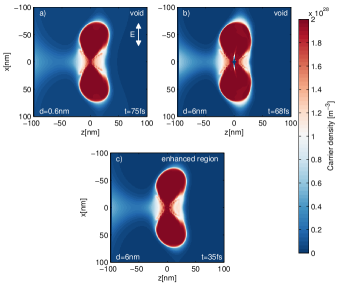
We consider regions with an enhanced ionization cross-section (Figs. 2(c), 4), being conceptually close to the analytical model, as well as nanovoids with a diameter as present in silica and with a diameter increased by a factor of 10 (Figs. 2, 3). The results in Fig. 2 have been produced with a spatial resolution of . For the larger simulation volumes in Figs. 3 and 4, a much coarser resolution of has been used.
We find, that all three inhomogeneity models reproduce the initial predictions of the analytical model and lead to an almost exponential growth of identical plasma structures into polarization direction (Fig. 2(a)). Additionally we observe, that the results do not differ significantly if a coarser discretization is used. We conclude, that the final plasma structure is indeed invariant concerning the seed. However, the irradiation time or intensity needed to initiate the quasi-exponential growth depends on the nature and strength of the inhomogeneity. Based on Fig. 1(c) we can say, that growth is initiated if a carrier density of approximately half the resonant density is reached locally. For and this corresponds to a value of .
Growth in polarization direction only slows down as the resulting structure leaves the sub-wavelength domain. Now the plasma acts as a nanoantenna whose maximum reflectivity would be reached at a size of . However, there is strong back-reflection already at smaller sizes. Due to constructive interference with the incident wave, further ionization is stimulated along the negative propagation direction (Fig. 3(b)) and a new structure is formed in front of the old one. At this point, the lateral growth of the initial structure is inhibited, leading to a finite size in polarization direction.
During few optical cycles, a new structure is formed at the intensity maximum caused by reflection from the previous one. In this way, a periodic plasma chain with wavelength dimensions is initiated by a tiny seed inhomogeneity of almost arbitrary nature (compare Figs. 3(c) and 4) and grows backwards against the propagation direction.
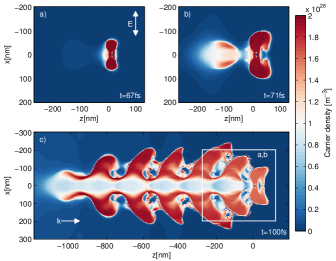
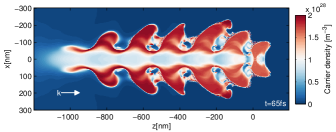
We now turn to the study of randomly distributed inhomogeneities in a three-dimensional volume. In all the simulations presented here, we place pixel-sized inhomogeneities with a density and leave the background medium unperturbed. As expected we again observe structure growth starting from the individual seed inhomogeneities. For nanovoids or regions with a weakly enhanced ionization cross-section as described above, the structures are sparsely distributed throughout the material volume and do not interact. However for higher densities, a large number of plasma stuctures competes in the growth process, resulting in an onset of self-organization. To explore such effects, we now allow for stronger ionization-enhancement inside the inhomogeneities (Figs. 5-8).
In such systems, we observe the dense growth of the structures we already described for the two-dimensional case. During their backwards directed growth, the structures also expand into the third direction not covered by our previous two-dimensional simulations. They do so until they merge with their neighbours to form extended plasma planes oriented perpendicularly to the polarization direction. Due to destructive interference of scattered and incident light, ionization is suppressed directly adjacent to each plasma plane and enhanced at a distance of approximately . We note, that the field supression and enhancement pattern in polarization direction around a single complex plasma structure is still simliar to the one for a small plasma sphere despite the differences in shape and size.
This effect leads to an interaction between separate structures. As a result, order emerges during growth and a periodic pattern can be formed. Since many structures form simultaneously and interaction only becomes relevant during the growth process, the resulting period is not completely determined by the position of the intensity maximum, but also depends on growth conditions like the density and ionization cross section of seed inhomogeneities or the intensity of the excitation.
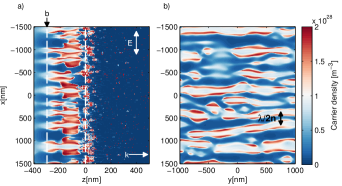
The smallest period can be observed under plane wave illumination. In this case, structures closest to the source plane tend to grow first and scatter light backwards, thus preventing any growth inside the simulation volume behind them. To observe the free growth and competition between different structures, we only fill a subspace with inhomogeneities, leaving the space close to the source unperturbed. Plasma structures form mainly at the border of the inhomogeneous region and grow backwards into the unperturbed region, where intensity is high (Fig. 5). Now only strong supression close to the individual structures inhibits the growth of their neighbours, resulting in a period as small as . Note that although growth starts at an interface, the resulting structure formation remains a volume effect which can only to a certain extent be compared to surface grating formation, which has been explained in terms of interference of dipole radiation initiated at a rough material surface.Sipe et al. (1983); Skolski et al. (2012) In our case, the self-organized period is caused by the growth of densely arranged metallic plasma structures initiated at the inhomogeneities on the interface.
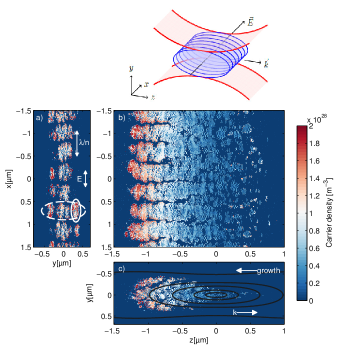
In more realistic simulations, we fill the entire simulation volume with inhomogeneities and use focussed sources to control the location of initial structure growth. First we use a source polarized in x-direction and focussed only in y-direction, with z being the propagation direction (see Fig. 6). In x-direction the source profile has an infinite size to allow for the formation of many grating planes. In y-direction the beam is assumed to have a gaussian shape. As expected, structures first emerge in the focal volume and grow backwards over micrometer distances into regions of decreasing intensity (Fig. 6). Self-organization in this case is dominated by mutual enhancement and we observe periods around . Since the planes form inside an initially disordered volume, self-organization only starts after a certain distance of backwards growth outside the original focus. As can be seen in Fig. 6(c), the transverse size of the ionized region increases at the distance where self-organization sets in (approximately behind the original focus), leading to a “carrot-shaped” growth. We observe, that the individual grating planes, as highlighted with a dashed ellipse in Fig. 6(a)), consist of several smaller structures, as highlighted with a second ellipse, having a finite size below in polarization direction. These correspond to the original wing-structure as it was observed in Fig. 3(a). Simliar to the case of Fig. 5, the individual structures tend to merge in the direction perpendicular to the polarization. However due to the random distribution of seed inhomogeneities, the emerging structures are not as regular as the ones observed previously.
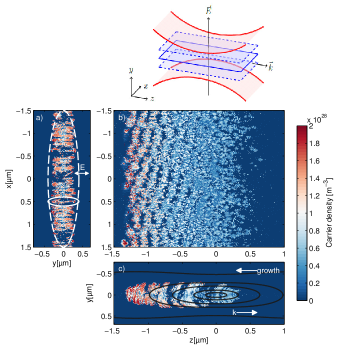
To further demonstrate the effect of polarization, we continue using the beam geometry of Fig. 6, but choose an excitation polarized in y-direction (Fig. 7). In this case, one would expect the grating planes to be extended along the x- and z- directions and arranged periodically along the y-direction. Since the exciting beam has a limited size in y-direction, we only observe a single structure, corresponding to a single grating plane (Fig. 7 (c)). As one would expect, no periodicity in x-direction can be found (Fig. 7(a)). However, similiar to Fig.6(a), the grating plane consists of smaller structures, which have grown from seed inhomogeneities and which have partly merged in x-direction. As suggested by the plasma structures in Figs. 3(c) and 4, we also observe some periodicity along the propagation direction (Fig. 7 (b)).
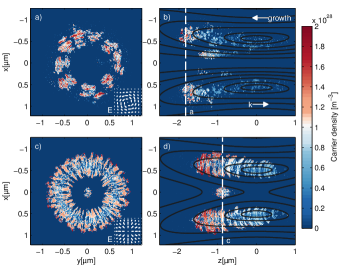
We further consider spatially localized radially and azimuthally polarized beams. Again we observe the formation of plasma planes perpendicular to the local polarization. For an azimuthally polarized beam, this leads to a star-shaped pattern containing several planes (Fig. 8(a),(b)). In the radially polarized case, we obtain a single ring structure caused by the transverse field components and a small structure in the beam center caused by the maximum of the longitudinal component (Fig. 8(c),(d)). Again, the individual planes in the star-shaped pattern in Figs.8(a),(b) and the single ring structure in Figs.8(c),(d) are made up of smaller structures which tend to merge in the directions perpendicular to the exciting polarization. In general the plasma planes generated by radially polarized beams are more regular and cohesive. In that case, the polarization-enforced ring-structure almost coincides with the region of maximum electric field strength. In contrast, plasma planes generated by an azimuthallly polarized beam point in radial direction, extending perpendicularly to the region of maximum field strength.
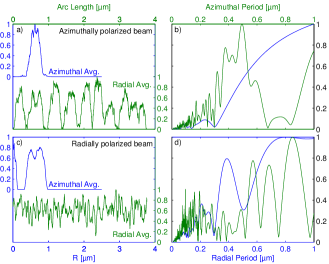
To perform a more quantitative analysis of the ionization patterns in Fig. 8, we transformed the data of Fig. 8(a) and (c) into a radial coordinate system and took directional averages in both radial and azimuthal directions (Fig. 9(a) ,(c)). For the azimuthally polarized beam, the radial averages exhibit a strong periodic modulation in azimuthal direction. In the case of the radially polarized beam, the modulation is weak and high carrier densities above half the maximum are present across the whole ring structure. The azimuthal averages show the finite size of the plasma structure, which is determined by the finite beam size for both polarization conditions. Figs. 9(b) and (d) show respective fourier transforms. Only in the case of the azimuthally polarized beam (Fig. 9(b)) a distinct periodicity of about in azimuthal direction can be identified in the radial average (green line).
III Relation to Experimental Results
In the simulations of our model systems with randomly distributed inhomogenities, we note strong similarities to experimentally observed volume nanogratings both for beams with spatially homogeneous polarizationRichter et al. (2011) and beams with a local polarization structure.Hnatovsky et al. (2011)
Our physical model describes localized ionization and the subsequent growth of nanoplasma, while neglecting the hydrodynamic behaviour of the generated plasma. It thus corresponds to the “nanoplasmonic” model of grating formation suggested in publications by Hnatovski et al.Rajeev et al. (2007). Contrary to the hypothesis presented there, we do not observe any growth of extended plasma structures for dielectric plasma densities. However close to and above the resonant plasma density where we do observe the stimulated growth of ionized regions. Although the structures initially grow into the polarization direction, they later organize into thick planes with an orientation orthogonal to the incident electric field.
Despite these similarities with experimental observations our results can only be regarded as a first attempt to understand the laser induced formation of volume gratings in bulk glasses. Due to numerical complexity of the subject we had to simplify the model considerably. Up to now we did not model the evolution of the material in the excited region after the pulse. In fact, real nanogratings form only over the course of many laser pulses. Between individual pulses, the conduction band carriers recombine completely, leaving only chemical and mechanical material modifications as a feedback mechanism for further pulses.Richter et al. (2012); Rajeev et al. (2006); Lancry et al. (2011) Self-organization emerges as a cumulative effect, and therefore quite likely requires much lower ionization rates.
In our model systems, inhomogeneities are strongly enhanced, allowing for faster ionization of the material. Thus, the purely optical aspects of self-organization can be studied in the course of a single irradiation cycle. Due to its dependence on polarization and wavelength, nanograting formation must be expected to be dominated by optical processes. Consequently, our model should be able to capture some of the essential physics involved. Indeed, self-organization of planes with the correct orientation and a wavelength-related period is reproduced. In the case of an inhomogeneous half-space under planewave irradiation, the commonly observed nanograting period of is matched by the simulated plasma structures. While most publications focussing on high pulse numbers and fully formed gratings report on thin planes with a period of , also larger periods around Mishchik et al. (2010) as well as much thicker grating planesTaylor et al. (2008) have been observed in experiments with low pulse numbers. Since our model does not include the material modification between pulses, it is not surprising that we observe similiar features in the majority of our simulations.
Our results further reproduce the large size as well as the increase in self-organization along the negative z-axis of nanogratings .Taylor et al. (2008) Both observations can be explained by the backward growth of plasma structures, which is driven by nearfield enhancement and continues well out of the focal region. Experiments have shown, that a similiar growth takes place over the course of multiple laser pulses during the generation of nanogratings.Mishchik et al. (2010)
IV Conclusion
We have modelled the interaction of light with nanoscale inhomogeneities in dielectrics undergoing multiphoton ionization. We observed, that nanoscale inhomogeneities as e.g. voids influence the plasma formation considerably. They induce the formation of large-scale plasma structures with a final shape independent of the initial void. In case of randomly distributed inhomogeneities we observe a strong interaction and subsequent self-organization of evolving plasma structures reproducing some of the key features of nanograting damage patterns in glass.
Further research will include additional ionization mechanisms and a more detailed description of the free carrier dynamics including carrier heating, density and temperature dependent changes of the collision frequency and hydrodynamic phenomena. To fully understand the phenomenon of nanograting-formation, detailed simulations of the material modifications taking place between pulses are required.
Acknowledgements.
The authors gratefully acknowledge financial support by Deutsche Forschungsgemeinschaft (priority program 1327: PE523/-2 and NO462/5-2) and the International Max Planck Research School Physics of Light.References
- Mainfray and Manus (1991) G. Mainfray and G. Manus, Rep. Prog. Phys. 54, 1333 (1991), URL http://stacks.iop.org/0034-4885/54/i=10/a=002.
- Davis et al. (1996) K. M. Davis, K. Miura, N. Sugimoto, and K. Hirao, Opt. Lett. 21, 1729 (1996), URL http://ol.osa.org/abstract.cfm?URI=ol-21-21-1729.
- Glezer and Mazur (1997) E. N. Glezer and E. Mazur, Appl. Phys. Lett. 71, 882 (1997), URL http://link.aip.org/link/?APL/71/882/1.
- Shimotsuma et al. (2005) Y. Shimotsuma, K. Hirao, J. Qiu, and P. G. Kazansky, Mod. Phys. Lett. B 19, 225 (2005), URL http://eprints.soton.ac.uk/20999/.
- Bhardwaj et al. (2006) V. R. Bhardwaj, E. Simova, P. P. Rajeev, C. Hnatovsky, R. S. Taylor, D. M. Rayner, and P. B. Corkum, Phys. Rev. Lett. 96, 057404 (2006), URL http://link.aps.org/doi/10.1103/PhysRevLett.96.057404.
- Hnatovsky et al. (2011) C. Hnatovsky, V. Shvedov, W. Krolikowski, and A. Rode, Phys. Rev. Lett. 106, 123901 (2011), URL http://link.aps.org/doi/10.1103/PhysRevLett.106.123901.
- Petrov and Davis (2008) G. M. Petrov and J. Davis, J. Phys. B: At., Mol. Opt. Phys. 41, 025601 (2008), URL http://stacks.iop.org/0953-4075/41/i=2/a=025601.
- Bourgeade et al. (2010) A. Bourgeade, C. Mï¿œzel, and O. Saut, J. Sci. Comput. 44, 170 (2010), ISSN 0885-7474, URL http://dx.doi.org/10.1007/s10915-010-9375-0.
- Bulgakova et al. (2013) N. M. Bulgakova, V. P. Zhukov, and Y. P. Meshcheryakov, Appl. Phys. B pp. 1–13 (2013), ISSN 0946-2171, URL http://dx.doi.org/10.1007/s00340-013-5488-0.
- Mezel et al. (2008) C. Mezel, L. Hallo, A. Bourgeade, D. Hebert, V. T. Tikhonchuk, B. Chimier, B. Nkonga, G. Schurtz, and G. Travaille, Phys. Plasmas 15, 093504 (pages 10) (2008), URL http://link.aip.org/link/?PHP/15/093504/1.
- Doremus (1966) R. H. Doremus, J. Am. Ceram. Soc. 49, 461 (1966), ISSN 1551-2916, URL http://dx.doi.org/10.1111/j.1151-2916.1966.tb13299.x.
- Rajeev et al. (2007) P. P. Rajeev, M. Gertsvolf, C. Hnatovsky, E. Simova, R. S. Taylor, P. B. Corkum, D. M. Rayner, and V. R. Bhardwaj, J. Phys. B: At., Mol. Opt. Phys. 40, S273 (2007), URL http://stacks.iop.org/0953-4075/40/i=11/a=S03.
- Efimenko and Kim (2011) E. S. Efimenko and A. V. Kim, Phys. Rev. E 84, 036408 (2011), URL http://link.aps.org/doi/10.1103/PhysRevE.84.036408.
- Efimenko et al. (2009) E. S. Efimenko, A. V. Kim, and M. Quiroga-Teixeiro, Phys. Rev. Lett. 102, 015002 (2009), URL http://link.aps.org/doi/10.1103/PhysRevLett.102.015002.
- Peñano et al. (2005) J. R. Peñano, P. Sprangle, B. Hafizi, W. Manheimer, and A. Zigler, Phys. Rev. E 72, 036412 (2005), URL http://link.aps.org/doi/10.1103/PhysRevE.72.036412.
- Yee (1966) K. S. Yee, IEEE Trans. Antennas and Propagation pp. 302–307 (1966).
- Taflove and Hagness (2005) A. Taflove and S. C. Hagness, Computational Electrodynamics: The Finite-Difference Time-Domain Method, Third Edition (Artech House, 2005), 3rd ed., ISBN 1580538320, URL http://www.worldcat.org/isbn/1580538320.
- Gamaly et al. (2006) E. G. Gamaly, S. Juodkazis, K. Nishimura, H. Misawa, B. Luther-Davies, L. Hallo, P. Nicolai, and V. T. Tikhonchuk, Phys. Rev. B 73, 214101 (2006), URL http://link.aps.org/doi/10.1103/PhysRevB.73.214101.
- Sudrie et al. (2002) L. Sudrie, A. Couairon, M. Franco, B. Lamouroux, B. Prade, S. Tzortzakis, and A. Mysyrowicz, Phys. Rev. Lett. 89, 186601 (2002), URL http://link.aps.org/doi/10.1103/PhysRevLett.89.186601.
- Mao et al. (2003) X. Mao, S. S. Mao, and R. E. Russo, Appl. Phys. Lett. 82, 697 (2003), URL http://link.aip.org/link/?APL/82/697/1.
- Audebert et al. (1994) P. Audebert, P. Daguzan, A. Dos Santos, J. C. Gauthier, J. P. Geindre, S. Guizard, G. Hamoniaux, K. Krastev, P. Martin, G. Petite, et al., Phys. Rev. Lett. 73, 1990 (1994), URL http://link.aps.org/doi/10.1103/PhysRevLett.73.1990.
- Richter et al. (2012) S. Richter, F. Jia, M. Heinrich, S. Döring, U. Peschel, A. Tünnermann, and S. Nolte, Opt. Lett. 37, 482 (2012), URL http://ol.osa.org/abstract.cfm?URI=ol-37-4-482.
- Hasegawa et al. (2000) M. Hasegawa, M. Saneyasu, M. Tabata, Z. Tang, Y. Nagai, T. Chiba, and Y. Ito, Nuclear Instruments and Methods in Physics Research Section B: Beam Interactions with Materials and Atoms 166-167, 431 (2000), ISSN 0168583X, URL http://linkinghub.elsevier.com/retrieve/pii/S0168583X99010265.
- Rajeev et al. (2006) P. P. Rajeev, M. Gertsvolf, E. Simova, C. Hnatovsky, R. S. Taylor, V. R. Bhardwaj, D. M. Rayner, and P. B. Corkum, Phys. Rev. Lett. 97, 253001 (2006), URL http://link.aps.org/doi/10.1103/PhysRevLett.97.253001.
- Lancry et al. (2011) M. Lancry, B. Poumellec, K. Cook, and J. Canning, in Proceedings of the International Quantum Electronics Conference and Conference on Lasers and Electro-Optics Pacific Rim 2011 (Optical Society of America, 2011), p. C229, URL http://www.opticsinfobase.org/abstract.cfm?URI=CLEOPR-2011-C229.
- Bohren and Huffman (1983) C. F. Bohren and D. R. Huffman, Absorption and scattering of light by small particles, vol. 1 (Wiley, 1983), URL http://adsabs.harvard.edu/abs/1983uaz..rept.....B.
- Jackson (1999) J. D. Jackson, Classical electrodynamics (Wiley, New York, NY, 1999), 3rd ed., ISBN 9780471309321, URL http://cdsweb.cern.ch/record/490457.
- Sipe et al. (1983) J. E. Sipe, J. F. Young, J. S. Preston, and H. M. van Driel, Phys. Rev. B 27, 1141 (1983), URL http://link.aps.org/doi/10.1103/PhysRevB.27.1141.
- Skolski et al. (2012) J. Z. P. Skolski, G. R. B. E. Römer, J. V. Obona, V. Ocelik, A. J. Huis in ’t Veld, and J. T. M. De Hosson, Phys. Rev. B 85, 075320 (2012), URL http://link.aps.org/doi/10.1103/PhysRevB.85.075320.
- Richter et al. (2011) S. Richter, M. Heinrich, S. Dï¿œring, A. Tï¿œnnermann, and S. Nolte, Appl. Phys. A: Mater. Sci. Process. 104, 503 (2011), ISSN 0947-8396, 10.1007/s00339-011-6489-7, URL http://dx.doi.org/10.1007/s00339-011-6489-7.
- Mishchik et al. (2010) K. Mishchik, G. Cheng, G. Huo, I. M. Burakov, C. Mauclair, a. Mermillod-Blondin, a. Rosenfeld, Y. Ouerdane, a. Boukenter, O. Parriaux, et al., Optics express 18, 24809 (2010), ISSN 1094-4087, URL http://www.ncbi.nlm.nih.gov/pubmed/21164827.
- Taylor et al. (2008) R. Taylor, C. Hnatovsky, and E. Simova, Laser & Photonics Review 2, 26 (2008), ISSN 18638880, URL http://doi.wiley.com/10.1002/lpor.200710031.