OTS 44: Disk and accretion at the planetary border††thanks: Based on observations at the Very Large Telescope of the European Southern Observatory at Paranal, Chile in program 80.C-0590(A)
We discover that the very low-mass brown dwarf OTS 44 (M9.5, 12 MJup) has significant accretion and a substantial disk, which demonstrates that the processes that accompany canonical star formation occur down to a central mass of a few Jupiter masses. We discover in VLT/SINFONI spectra that OTS 44 has strong, broad, and variable Pa emission that is evidence for active accretion at the planetary border. We also detect strong H emission of OTS 44 in a literature spectrum and determine an H EW (-141 Å) that is indicative of active accretion. Both the Pa and H emission lines have broad profiles with wings extending to velocities of about 200 km s-1. We determine the mass accretion rate of OTS 44 based on H to 7.6 , which shows that OTS 44 has a relatively high mass-accretion rate considering its small central mass. This mass rate is nevertheless consistent with the general decreasing trend found for stars of several solar masses down to brown dwarfs. Furthermore, we determine the properties of the disk surrounding OTS 44 through radiative transfer modeling of flux measurement from the optical to the far-IR (Herschel) by applying a Bayesian analysis. We find that OTS 44 has a highly flared disk (1.2) with a mass of 9.1 (0.1 or ). We show that the ratio of disk-to-central-mass of about 10-2 found for objects between 0.03 and 14 is also valid for OTS 44 at a mass of 0.01 . Our observations are in line with an isolated star-like mode of the formation of brown dwarfs down to 0.01 .
Key Words.:
brown dwarfs - Stars: pre-main sequence - circumstellar matter - Accretion - Stars: formation - stars: individual (OTS 44)1 Introduction
One of the main open questions in the theory of star formation is: How do brown dwarfs form. A high-density phase is necessary for the gravitational fragmentation to create very small Jeans-unstable cores. Proposed scenarios to prevent a substellar core in a dense environment from accreting to stellar mass are (i) ejection of the core through dynamical interactions, (ii) photo-evaporation of the gas envelope through radiation of a nearby hot star, and (iii) disk instabilities in circumstellar disks. Alternatively, brown dwarfs could form in an isolated mode by direct collapse. For example, filament collapse (e.g., Inutsuka & Miyama 1992) might form low-mass cores that experience high self-erosion in outflows and become brown dwarfs (Machida et al. 2009). A key to understanding star and brown dwarf formation is to observationally define the minimum mass that the star formation process can produce by detecting and exploring the main features characteristic of star formation, such as disks, accretion, and outflows, for very low-mass objects.
Young brown dwarfs were shown to have substantial circumstellar disks at far-infrared (far-IR) and mm wavelengths (e.g., Harvey et al. 2012; Ricci et al. 2013). Many of these brown dwarfs were found to actively accrete material through the disk onto the central object (e.g., Rigliaco et al. 2012), and a handful of them also to drive outflows (e.g., Whelan et al. 2005; Phan-Bao et al. 2008; Bacciotti et al. 2011; Joergens et al. 2012a, 2012b; Monin et al. 2013). Among the lowest-mass isolated objects found to harbor a disk are Cha 110913-773444 (8 , Luhman et al. 2005a), LOri 156 (23 , Bayo et al. 2012), and OTS 44 (12 MJup, Luhman et al. 2005b).
OTS 44, which is the subject of the present work, was first identified as a brown dwarf candidate in a deep near-IR imaging survey in the Chamaeleon I star-forming region (Oasa et al. 1999). It was confirmed to be a very low-mass brown dwarf of spectral-type M9.5 with an estimated mass of 15 MJup based on low-resolution near-IR and optical spectra (Luhman et al. 2004; Luhman 2007). Bonnefoy et al. (2013) recently confirmed in a near-IR study a mass in the planetary regime (6-17 MJup). Mid- and far-IR excess emission detected with Spitzer (Luhman et al. 2005b) and Herschel (Harvey et al. 2012) indicated that OTS 44 has a disk. We present SINFONI / VLT spectroscopy of OTS 44 that reveals strong Paschen emission, an analysis of H emission in a spectrum from Luhman (2007), and a detailed modeling of the spectral energy distribution (SED) of the disk of OTS 44 based on Herschel data.
2 Observations
The spectral energy distribution. To model the disk and photosphere of OTS 44, we compiled optical to far-IR flux measurements from the literature. In the optical, we use I-band data from Luhman et al. (2005b) and an R-band magnitude of 23.50.1 (K. Luhman, pers. comm.). The near-IR (JHK) regime is covered by observations of 2MASS and WISE. We note that the WISE W4 photometry of OTS 44 was not used because of contamination by a bright spike. Mid-IR photometry of OTS44 was obtained by Spitzer using IRAC (3.6, 4.5, 5.8, ) and MIPS (, Luhman et al. 2008). Recently, OTS44 was observed in the far-IR (70, ) by PACS/Herschel (Harvey et al. 2012).
Near-infrared SINFONI integral field spectroscopy. We observed OTS 44 with the Spectrograph for INtegral Field Observations in the Near Infrared (SINFONI) at the VLT on December 14 and 21, 2007. The observations were conducted as part of a program designed to provide a library of near-IR spectra of young late-type objects (Bonnefoy et al. 2013). The instrument was operated with pre-optics and gratings enabling medium-resolution (R=/2000) J-band spectroscopy (1.1-1.4 m) with a spatial sampling of 125250 mas/pixel. We reduced the data with the SINFONI data reduction pipeline version 1.9.8 and custom routines (cf. Bonnefoy et al. 2013 for details). The pipeline reconstructs datacubes with a field of view of 1.125 1.150” from bi-dimentional raw frames. Telluric absorptions features were calibrated and removed based on the observations of B5V stars. The wavelength calibration based on arc lamp spectra has an accuracy of about 30 km s-1. A value of =15.2 km s-1 was adopted as rest velocity of OTS 44 throughout the paper, which is the average radial velocity of T Tauri stars and brown dwarfs in Cha I (Joergens 2006).
Optical spectroscopy. An optical spectrum covering the range 0.5-1 m with a resolution R=900 was taken by Luhman (2007) with IMACS at the Magellan I telescope on January 6, 2005. This spectrum is used to analyze the H emission of OTS 44 and to provide an additional constraint to the photosphere model fit. We calculate the heliocentric radial velocities relative to .
3 Photospheric properties of OTS 44
We find that it is not possible to fit the SED of OTS 44 when using the properties reported for this brown dwarf in the literature (=2300 K, =0.00077 L⊙, =0, Luhman 2007). Therefore, we performed a thorough modeling of the photosphere of OTS 44 by applying the BT-Settl models (Allard et al. 2012). These models incorporate a sophisticated treatment of photospheric dust, which is likely to affect the cool atmosphere of OTS 44. We use broad-band photometry, a narrow grid of flux points calculated from the optical spectrum (Luhman 2007), and a surface gravity of 3.5, as determined from gravity-sensitive lines (Bonnefoy et al. 2013). We derive an effective temperature of =1700 K, a luminosity of =0.0024 , and an extinction of =2.6 mag (Table 1). Bonnefoy et al. (2013) previously found indications for a lower of OTS 44. The probability distributions of the parameter values in our modeling approach are relatively broad, which hints at a remaining descrepancy with the models. We conclude that the photospheric properties of OTS 44 may still need to be refined in the future.
| Reference | |||||
|---|---|---|---|---|---|
| [K] | [] | [mag] | |||
| Set 1 | 2300 | 0.00077 | 0.0 | Luhman 2007 | |
| Set 2 | 1700 | 0.0024 | 2.6 | 3.5 | this work |
4 SED modeling of the disk of OTS 44
We model the SED of OTS 44 using the radiative transfer code MC3D (Wolf 2003) to characterize its circumstellar environment. Because the disk parameters are strongly degenerate in the fitting procedure, we employ a passive-disk model consisting of a central substellar source surrounded by a parametrized disk.
Dust distribution in the disk. We introduce a parametrized flared disk in which dust and gas are well mixed and homogeneous throughout the system. This model has been successfully used to explain the observed SEDs of a large sample of young stars and brown dwarfs (e.g., Wolf et al. 2003; Harvey et al. 2012). For the dust in the disk we assume a density structure with a Gaussian vertical profile , and a power-law distribution for the surface density , where is the radial distance from the central star measured in the disk midplane, and is the scale height of the disk. The outer disk radius is set to 100 AU. To allow flaring, the scale height follows the power law =, with the flaring exponent describing the extent of flaring and the scale height at .
Dust properties. We consider the dust grains to be homogeneous spheres, which is a valid approximation to describe the scattering behavior as compared to a more complex description with fractal grain structures. The dust grain ensemble incorporates both astronomical silicate (62.5%) and graphite (37.5%) material. The grain size distribution is given by the standard power law with minimum and maximum grain sizes of 0.005 and 0.25 , respectively.
Heating sources. We consider a passive disk with only stellar irradiation, but no viscous heating (e.g., Chiang & Goldreich 1997). Radiation heating of the dust from the accretion luminosity can be neglected because (Sect. 5). For and of the central source, we use the values derived here (Table 1, set 2) and d=162.5 pc. As said, an SED model using the parameters from Luhman (2007; set 1 in Table 1) cannot reproduce the observations. The incident substellar spectrum is taken from the BT-Settl atmosphere database with =3.5 (Allard et al. 2012). The radiative transfer problem is solved self-consistently considering 100 wavelengths, logarithmically distributed in the range of [, ].
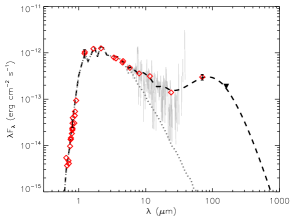
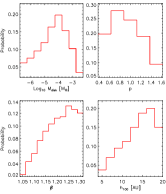
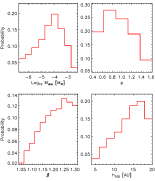
Fitting results. The SED fitting is performed with a hybrid strategy that combines the database method and the simulated annealing (SA) algorithm (Liu et al. 2013). We first run a large grid of disk models with a broad range of disk parameters. Then SA is used to improve upon the results returned by the model grid and to calculate local confidence intervals. The best-fit model is shown in Fig. 1 and the corresponding disk parameter values are listed in Table 2. The best-fit model is not a unique solution due to model degeneracies between different parameters, for example /. We therefore conduct a Bayesian analysis to estimate the validity range for each parameter (Pinte et al. 2008). We find that the best-fit and the most probable values (cf. Sect. A) agree well with each other, in particular the disk mass, which demonstrates that the modeling efforts place good constraints on the mass and structure of the disk of OTS 44. We note that strong grain growth would remain undetected in our data (160 ) and could affect . The values of most disk parameters derived here are largely consistent with the results of Harvey et al. (2012, =0.01 AU, = , =1.15, =15 AU, = 60∘), who used a coarser grid resolution and slighlty different dust properties and photospheric parameters. An SED model by Bonnefoy et al. (2013) aimed at understanding whether the disk could create a near-IR excess that would bias the temperature estimate showed that this is not the case.
5 Paschen and H emission
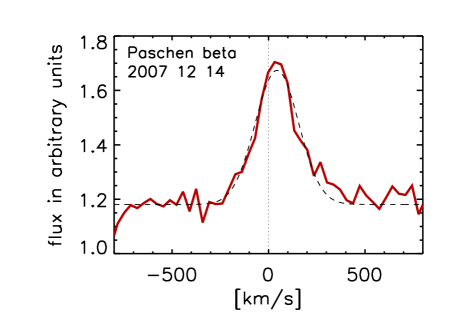
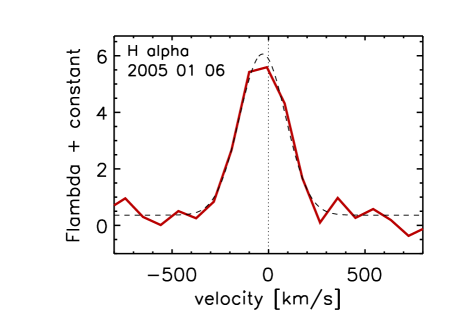
We discover a strong and broad Paschen (Pa ) emission line in our near-IR SINFONI spectra of OTS 44 (Fig. 2). Furthermore, a prominent H emission line is visible in the optical spectrum of Luhman (2007, see Fig. 2). Both of these Hydrogen emission lines exhibit a broad profile with velocities of 200 km s-1or more. We investigate the properties and origin of these lines through a line profile analysis. We determine the equivalent width (EW) by directly integrating the flux within the line region and the EW errors following Sembach & Savage (1992). Furthermore, we measure the line center and full-width-at-half-maximum (FWHM) based on a Gaussian fit to the profiles. Table 3 lists the results.
The H line has a symmetrically shaped profile with an EW of -141 Å, demonstrating that OTS 44 is actively accreting (e.g. Barrado & Martin 2003). The line appears to be blueshifted with its center located at -30 km s-1. Higher resolution spectroscopy is needed to determine whether this shift is real.
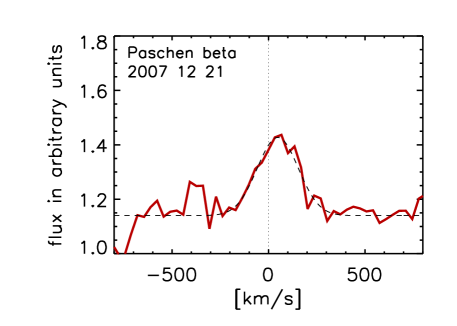
The shape of the Pa line appears to be slightly asymmetric, with the red wing being more pronounced. The profile is significantly variable between the two observing epochs separated by a few days. We measure an EW of -6.7 and -4.2 Å for the spectra from December 14 and 21, respectively. The line has a peak at redshifted velocities at about 40-50 km s-1. We see a redshift of similar order also in photospheric lines of OTS 44. While the Pa emission of T Tauri stars is mostly attributed to magnetospheric accretion and winds (e.g., Rigliaco et al. 2012), there is observational evidence that part of the Pa emission, in particular the broad line wings, can be formed by other processes, such as outflows (e.g., Whelan et al. 2004). We conducted a spectro-astrometric analysis of the Pa line in the SINFONI 3D cube data to locate the formation site of this emission. We find no spectro-astrometric signal in this line that exceeds 5 mas (0.8 AU).
Mass accretion rate. We determine the mass accretion rate of OTS 44 based on the H line by assuming that the H emission is entirely formed by accretion processes. For this purpose, we calculate the H line luminosity from the H EW using broad-band photometry and converte it into an accretion luminosity by applying the empirical relation of Fang et al. (2009, cf. also Joergens et al. 2012b). We use a dereddened -band magnitude, a distance of 162.5 pc, the set 2 parameters (Table 1) for the extinction and for calculating a radius via the Stefan-Boltzmann law, and a mass of 11.5 , which is an intermediate value of the estimated range of 6-17 (Luhman et al. 2005b; Bonnefoy et al. 2013). We derive an H line luminosity of 6.910, an accretion luminosity of 3.710 (0.15% of L∗), and a mass accretion rate of 7.6 . We take into account errors in EW, Rmag, and in the empirical relation. We furthermore attempt to estimate the mass accretion rate based on the Pa line by using the empirical relation of Rigliaco et al. (2012), a dereddened -band magnitude, and again set 2 of Table 1. This yields a mass rate that is two orders of magnitude higher than that derived from H, namely 1.7 for epoch 1 (December 14) and 8.5 for epoch 2 (December 21). This descrepancy lets us speculate that part of the Pa line might come from a different origin than accretion.
| line | date | FWHM | EW | |
|---|---|---|---|---|
| [km/s] | [km/s] | [Å] | ||
| H | 2005 01 06 | -30 | 283 | -141 14 |
| Pa | 2007 12 14 | +44 | 265 | -6.7 0.3 |
| Pa | 2007 12 21 | +48 | 251 | -4.2 0.3 |
6 Conclusions
We have discovered strong, broad, and variable Pa emission of the young very low-mass brown dwarf OTS 44 (M9.5) in VLT/SINFONI spectra, which is evidence for active accretion at the planetary border. We determined the properties of the disk that surrounds OTS 44 through MC3D radiative transfer modeling of flux measurements from the optical to the far-IR (Herschel). We found that OTS 44 has a highly flared disk (1.2) with a mass of 9.1 , that is about 0.1 or . We also investigated the H line of OTS 44 in a spectrum from Luhman (2007) and found strong H emission with an EW of -141 Å indicative of active accretion. Both the Pa and H emission lines of OTS 44 have broad profiles with the wings extending to velocities of about 200 km s-1. The Pa emission is significantly variable on timescales of a few days, indicating variability in accretion-related processes of OTS 44. We estimated the mass accretion rate of OTS 44 to 7.6 by using the H line. A mass accretion rate based on the Pa line gives a significantly higher value, and we speculate that part of the Pa emission might come from other processes related to accretion, such as outflows. Furthermore, in the course of studying OTS 44, we fitted a photospheric BT-Settl model to its optical and near-IR SED and derived a lower effective temperature and higher extinction than was previously found (Luhman 2007).
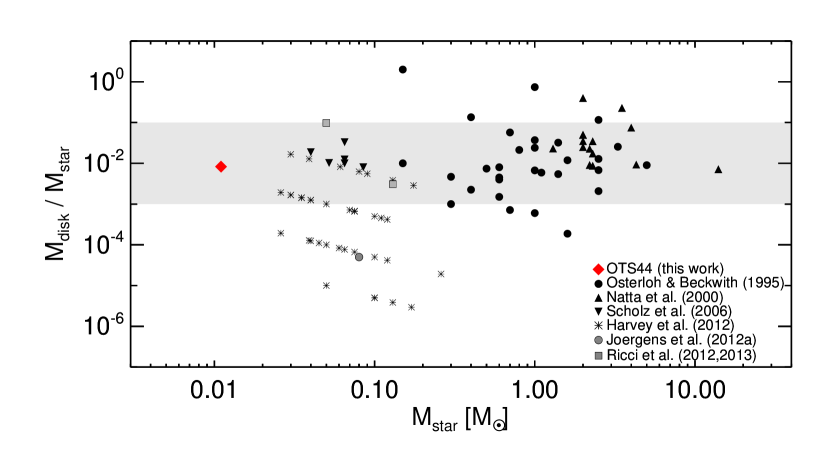
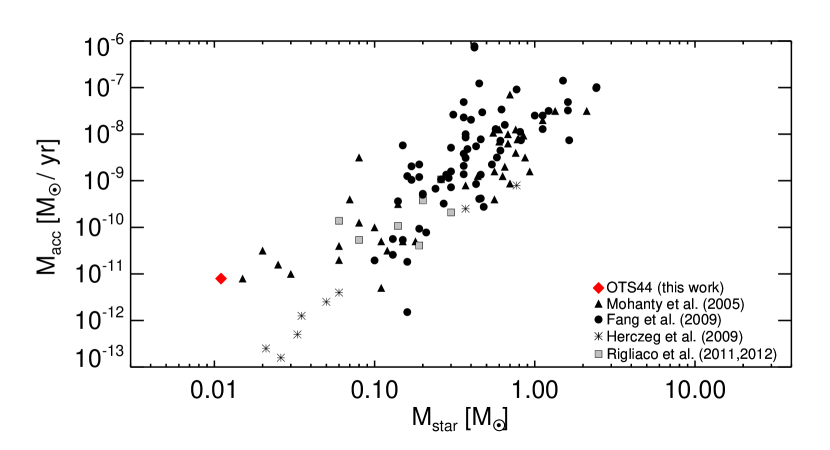
We have presented the first detection of Pa emission for an object at the deuterium-burning limit. Our analysis of Pa and H emission of OTS 44 demonstrates that objects of a few Jupiter masses can be active accretors. Furthermore, OTS 44 is the lowest-mass object to date for which the disk mass is determined based on far-IR data. Our detections therefore extend the exploration of disks and accretion during the T Tauri phase down to the planetary mass regime. Plotting the relative disk masses of stars and brown dwarfs including OTS 44 (Fig. 3) shows that the ratio of the disk-to-central-mass of about 10-2 found for objects between 0.03 and 14 is also valid for OTS 44 at a mass of about 0.01 . Furthermore, the mass accretion rate of OTS 44 is consistent with a decreasing trend from stars of several solar masses to brown dwarfs down to 0.01 (Fig. 4). It is also obvious from this figure that OTS 44 has a relatively high mass accretion rate considering its small mass. These observations show that the processes that accompany canonical star formation, disks and accretion, are present down to a central mass of a few Jupiter masses. OTS 44 plays a key role in the study of disk evolution and accretion at an extremely low mass and, therefore, in constraining the minimum mass that star formation can produce. It will be the target of our future observational efforts.
Acknowledgements.
We thank K. Luhman for providing the optical spectrum of OTS 44 and related information, C. Dumas and A.-M. Lagrange for help with the SINFONI data reduction, the ESO staff at Paranal for executing the SINFONI observations in service mode, and the anonymous referee for very helpful comments. This work made use of the NIST database (Kramida et al. 2012) and VOSA (Bayo et al. 2008). MB acknowledges funding from Agence Nationale pour la Recherche, France through grant ANR10-BLANC0504-01.References
- (1) Allard, F., Homeier, D., Freytag, B., & Sharp, C. M. 2012, in EAS Publications Series, Vol. 57, ed. C. Reyle, C. Charbonnel, & M. Schultheis, 3–43
- (2) Bacciotti, F., Whelan, E. T., Alcalá, J. M. et al. 2011, ApJ, 737, L26
- (3) Barrado y Navascués, D., & Martín, E. L. 2003, AJ, 126, 2997
- (4) Bayo, A., Barrado, D., Huelamo, N. et al. 2012, A&A, 547, A80
- (5) Bonnefoy, M., Chauvin, G., Lagrange, A.-M. et al. 2013, A&A, in press
- Chiang & Goldreich (1997) Chiang, E. I., & Goldreich, P. 1997, ApJ, 490, 368
- (7) Fang, M., van Boekel, R., Wang, W. et al. 2009, A&A, 504, 461
- (8) Harvey, P.M., Henning, Th., Liu Y. et al. 2012, 755, 67
- (9) Herczeg, G. J., Cruz, K. L., Hillenbrand, L. A. 2009, ApJ, 696, 1589
- (10) Inutsuka S. & Miyama S. M. 1992, ApJ, 388, 392
- (11) Joergens, V. 2006, A&A, 448, 655
- (12) Joergens, V., Pohl, A., Sicilar-Aguilar, A., & Henning, Th. 2012a, A&A, 543, A151
- (13) Joergens, V., Kopytova, T. & Pohl, A. 2012b, A&A, 548, A124
- (14) Liu, Y., Madlener, D., Wolf, S., & Wang, H.-C. 2013, Research in Astronomy and Astrophysics, 13, 420
- (15) Luhman, K. L., Peterson, D. E., & Megeath, S. T. 2004, ApJ, 617, 565
- (16) Luhman, K. L., Adame, L., D’Alessio, P. et al. 2005a, ApJ, 635, L93
- (17) Luhman, K. L., D’Alessio, P., Calvet, N. et al. 2005b, ApJ, 620, L51
- (18) Luhman, K. L. 2007, ApJS, 173, 104
- (19) Luhman, K. L., Allen, L. E., Allen, P. R. et al. 2008, ApJ, 675, 1375
- (20) Machida, M. N., Inutsuka, S., & Matsumoto, T. 2009, ApJ, 699, L157
- (21) Mohanty, S., Jayawardhana, R. & Basri G. 2005, ApJ, 626, 498
- (22) Monin, J.-L., Whelan, E. T., Lefloch, B., Dougados, C., & Alves de Oliveira, C. 2013, A&A, 551, L1
- (23) Natta, A., Grinin, V., & Mannings, V. 2000, Protostars and Planets IV, Tucson, University of Arizona Press, 559
- (24) Oasa, Y., Tamura, M., & Sugitani, K. 1999, ApJ, 526, 336
- (25) Osterloh, M., & Beckwith, S. V. W. 1995, ApJ, 439, 288
- (26) Phan-Bao, N., Riaz, B., Lee, C.-F. et al. 2008, ApJ, 689, L141
- (27) Pinte, C., Padgett, D. L., Ménard, F., et al. 2008, A&A, 489, 633
- (28) Ricci, L., Testi, L., Natta, A., Scholz, A., & de Gregorio-Monsalvo, I. 2012, ApJ, 761, L20
- (29) Ricci, L., Isella, A., Carpenter, J. M., & Testi, L. 2013, ApJ, 764, L27
- (30) Rigliaco, E., Natta, A., Randich S. et al. 2011, A&A, 526, L6
- (31) Rigliaco, E., Natta, A., Testi et al. 2012, A&A, 548, A56
- (32) Scholz, A., Jayawardhana, R., & Wood, K. 2006, ApJ, 645, 1498
- (33) Sembach, K. R., & Savage, B. D. 1992, ApJS, 83, 147
- (34) Whelan, E. T., Ray, T. P., & Davis, C. J. 2004, A&A, 417, 247
- (35) Whelan, E. T., Ray, T. P., Bacciotti, F. et al. 2005, Nature, 435, 652
- (36) Wolf, S. 2003, Computer Physics Communications, 150, 99
- (37) Wolf, S., Padgett, D. L., & Stapelfeldt, K. R. 2003, ApJ, 588, 373
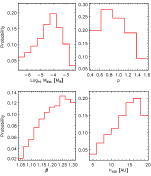
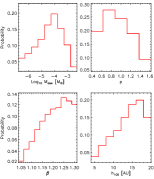
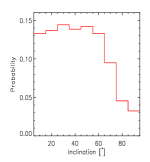
Appendix A Bayesian probability analysis
| Parameter | best model | valid range |
|---|---|---|
| [AU] | 0.023 | 0.01-0.04 |
| [AU] | 100 | fixed |
| 1.136 | 0.62-1.27 | |
| 1.317 | 1.16-1.32 | |
| [AU] | 17.42 | 9.0-18.5 |
| [10] | 9.06 | 0.32-56.2 |
| [∘] | 58 | 18-65 |