M. Nayak
Indian Institute of Technology Madras, Chennai 600036
J. Libby
Indian Institute of Technology Madras, Chennai 600036
K. Trabelsi
High Energy Accelerator Research Organization (KEK), Tsukuba 305-0801
I. Adachi
High Energy Accelerator Research Organization (KEK), Tsukuba 305-0801
H. Aihara
Department of Physics, University of Tokyo, Tokyo 113-0033
D. M. Asner
Pacific Northwest National Laboratory, Richland, Washington 99352
T. Aushev
Institute for Theoretical and Experimental Physics, Moscow 117218
A. M. Bakich
School of Physics, University of Sydney, NSW 2006
A. Bala
Panjab University, Chandigarh 160014
P. Behera
Indian Institute of Technology Madras, Chennai 600036
K. Belous
Institute for High Energy Physics, Protvino 142281
V. Bhardwaj
Nara Women’s University, Nara 630-8506
G. Bonvicini
Wayne State University, Detroit, Michigan 48202
A. Bozek
H. Niewodniczanski Institute of Nuclear Physics, Krakow 31-342
M. Bračko
University of Maribor, 2000 Maribor
J. Stefan Institute, 1000 Ljubljana
T. E. Browder
University of Hawaii, Honolulu, Hawaii 96822
D. Červenkov
Faculty of Mathematics and Physics, Charles University, 121 16 Prague
M.-C. Chang
Department of Physics, Fu Jen Catholic University, Taipei 24205
P. Chang
Department of Physics, National Taiwan University, Taipei 10617
V. Chekelian
Max-Planck-Institut für Physik, 80805 München
A. Chen
National Central University, Chung-li 32054
B. G. Cheon
Hanyang University, Seoul 133-791
R. Chistov
Institute for Theoretical and Experimental Physics, Moscow 117218
I.-S. Cho
Yonsei University, Seoul 120-749
K. Cho
Korea Institute of Science and Technology Information, Daejeon 305-806
V. Chobanova
Max-Planck-Institut für Physik, 80805 München
Y. Choi
Sungkyunkwan University, Suwon 440-746
D. Cinabro
Wayne State University, Detroit, Michigan 48202
J. Dalseno
Max-Planck-Institut für Physik, 80805 München
Excellence Cluster Universe, Technische Universität München, 85748 Garching
M. Danilov
Institute for Theoretical and Experimental Physics, Moscow 117218
Moscow Physical Engineering Institute, Moscow 115409
Z. Doležal
Faculty of Mathematics and Physics, Charles University, 121 16 Prague
Z. Drásal
Faculty of Mathematics and Physics, Charles University, 121 16 Prague
D. Dutta
Indian Institute of Technology Guwahati, Assam 781039
S. Eidelman
Budker Institute of Nuclear Physics SB RAS and Novosibirsk State University, Novosibirsk 630090
S. Esen
University of Cincinnati, Cincinnati, Ohio 45221
H. Farhat
Wayne State University, Detroit, Michigan 48202
J. E. Fast
Pacific Northwest National Laboratory, Richland, Washington 99352
T. Ferber
Deutsches Elektronen–Synchrotron, 22607 Hamburg
V. Gaur
Tata Institute of Fundamental Research, Mumbai 400005
N. Gabyshev
Budker Institute of Nuclear Physics SB RAS and Novosibirsk State University, Novosibirsk 630090
S. Ganguly
Wayne State University, Detroit, Michigan 48202
R. Gillard
Wayne State University, Detroit, Michigan 48202
Y. M. Goh
Hanyang University, Seoul 133-791
B. Golob
Faculty of Mathematics and Physics, University of Ljubljana, 1000 Ljubljana
J. Stefan Institute, 1000 Ljubljana
J. Haba
High Energy Accelerator Research Organization (KEK), Tsukuba 305-0801
H. Hayashii
Nara Women’s University, Nara 630-8506
Y. Horii
Kobayashi-Maskawa Institute, Nagoya University, Nagoya 464-8602
Y. Hoshi
Tohoku Gakuin University, Tagajo 985-8537
W.-S. Hou
Department of Physics, National Taiwan University, Taipei 10617
H. J. Hyun
Kyungpook National University, Daegu 702-701
T. Iijima
Kobayashi-Maskawa Institute, Nagoya University, Nagoya 464-8602
Graduate School of Science, Nagoya University, Nagoya 464-8602
A. Ishikawa
Tohoku University, Sendai 980-8578
T. Iwashita
Nara Women’s University, Nara 630-8506
I. Jaegle
University of Hawaii, Honolulu, Hawaii 96822
T. Julius
School of Physics, University of Melbourne, Victoria 3010
D. H. Kah
Kyungpook National University, Daegu 702-701
E. Kato
Tohoku University, Sendai 980-8578
D. Y. Kim
Soongsil University, Seoul 156-743
H. J. Kim
Kyungpook National University, Daegu 702-701
J. B. Kim
Korea University, Seoul 136-713
M. J. Kim
Kyungpook National University, Daegu 702-701
Y. J. Kim
Korea Institute of Science and Technology Information, Daejeon 305-806
K. Kinoshita
University of Cincinnati, Cincinnati, Ohio 45221
J. Klucar
J. Stefan Institute, 1000 Ljubljana
B. R. Ko
Korea University, Seoul 136-713
P. Kodyš
Faculty of Mathematics and Physics, Charles University, 121 16 Prague
S. Korpar
University of Maribor, 2000 Maribor
J. Stefan Institute, 1000 Ljubljana
P. Krishnan
Indian Institute of Technology Madras, Chennai 600036
P. Križan
Faculty of Mathematics and Physics, University of Ljubljana, 1000 Ljubljana
J. Stefan Institute, 1000 Ljubljana
P. Krokovny
Budker Institute of Nuclear Physics SB RAS and Novosibirsk State University, Novosibirsk 630090
T. Kuhr
Institut für Experimentelle Kernphysik, Karlsruher Institut für Technologie, 76131 Karlsruhe
T. Kumita
Tokyo Metropolitan University, Tokyo 192-0397
A. Kuzmin
Budker Institute of Nuclear Physics SB RAS and Novosibirsk State University, Novosibirsk 630090
Y.-J. Kwon
Yonsei University, Seoul 120-749
S.-H. Lee
Korea University, Seoul 136-713
J. Li
Seoul National University, Seoul 151-742
Y. Li
CNP, Virginia Polytechnic Institute and State University, Blacksburg, Virginia 24061
L. Li Gioi
Max-Planck-Institut für Physik, 80805 München
Y. Liu
University of Cincinnati, Cincinnati, Ohio 45221
D. Liventsev
High Energy Accelerator Research Organization (KEK), Tsukuba 305-0801
P. Lukin
Budker Institute of Nuclear Physics SB RAS and Novosibirsk State University, Novosibirsk 630090
H. Miyake
High Energy Accelerator Research Organization (KEK), Tsukuba 305-0801
R. Mizuk
Institute for Theoretical and Experimental Physics, Moscow 117218
Moscow Physical Engineering Institute, Moscow 115409
G. B. Mohanty
Tata Institute of Fundamental Research, Mumbai 400005
A. Moll
Max-Planck-Institut für Physik, 80805 München
Excellence Cluster Universe, Technische Universität München, 85748 Garching
T. Mori
Graduate School of Science, Nagoya University, Nagoya 464-8602
N. Muramatsu
Research Center for Electron Photon Science, Tohoku University, Sendai 980-8578
R. Mussa
INFN - Sezione di Torino, 10125 Torino
Y. Nagasaka
Hiroshima Institute of Technology, Hiroshima 731-5193
M. Nakao
High Energy Accelerator Research Organization (KEK), Tsukuba 305-0801
E. Nedelkovska
Max-Planck-Institut für Physik, 80805 München
K. Negishi
Tohoku University, Sendai 980-8578
C. Ng
Department of Physics, University of Tokyo, Tokyo 113-0033
N. K. Nisar
Tata Institute of Fundamental Research, Mumbai 400005
O. Nitoh
Tokyo University of Agriculture and Technology, Tokyo 184-8588
S. Ogawa
Toho University, Funabashi 274-8510
S. Okuno
Kanagawa University, Yokohama 221-8686
Y. Onuki
Department of Physics, University of Tokyo, Tokyo 113-0033
P. Pakhlov
Institute for Theoretical and Experimental Physics, Moscow 117218
Moscow Physical Engineering Institute, Moscow 115409
G. Pakhlova
Institute for Theoretical and Experimental Physics, Moscow 117218
C. W. Park
Sungkyunkwan University, Suwon 440-746
H. Park
Kyungpook National University, Daegu 702-701
T. K. Pedlar
Luther College, Decorah, Iowa 52101
M. Petrič
J. Stefan Institute, 1000 Ljubljana
L. E. Piilonen
CNP, Virginia Polytechnic Institute and State University, Blacksburg, Virginia 24061
M. Ritter
Max-Planck-Institut für Physik, 80805 München
M. Röhrken
Institut für Experimentelle Kernphysik, Karlsruher Institut für Technologie, 76131 Karlsruhe
A. Rostomyan
Deutsches Elektronen–Synchrotron, 22607 Hamburg
H. Sahoo
University of Hawaii, Honolulu, Hawaii 96822
T. Saito
Tohoku University, Sendai 980-8578
Y. Sakai
High Energy Accelerator Research Organization (KEK), Tsukuba 305-0801
S. Sandilya
Tata Institute of Fundamental Research, Mumbai 400005
L. Santelj
J. Stefan Institute, 1000 Ljubljana
T. Sanuki
Tohoku University, Sendai 980-8578
V. Savinov
University of Pittsburgh, Pittsburgh, Pennsylvania 15260
O. Schneider
École Polytechnique Fédérale de Lausanne (EPFL), Lausanne 1015
G. Schnell
University of the Basque Country UPV/EHU, 48080 Bilbao
Ikerbasque, 48011 Bilbao
C. Schwanda
Institute of High Energy Physics, Vienna 1050
A. J. Schwartz
University of Cincinnati, Cincinnati, Ohio 45221
K. Senyo
Yamagata University, Yamagata 990-8560
O. Seon
Graduate School of Science, Nagoya University, Nagoya 464-8602
M. E. Sevior
School of Physics, University of Melbourne, Victoria 3010
M. Shapkin
Institute for High Energy Physics, Protvino 142281
C. P. Shen
Beihang University, Beijing 100191
T.-A. Shibata
Tokyo Institute of Technology, Tokyo 152-8550
J.-G. Shiu
Department of Physics, National Taiwan University, Taipei 10617
B. Shwartz
Budker Institute of Nuclear Physics SB RAS and Novosibirsk State University, Novosibirsk 630090
A. Sibidanov
School of Physics, University of Sydney, NSW 2006
F. Simon
Max-Planck-Institut für Physik, 80805 München
Excellence Cluster Universe, Technische Universität München, 85748 Garching
Y.-S. Sohn
Yonsei University, Seoul 120-749
A. Sokolov
Institute for High Energy Physics, Protvino 142281
E. Solovieva
Institute for Theoretical and Experimental Physics, Moscow 117218
M. Starič
J. Stefan Institute, 1000 Ljubljana
M. Steder
Deutsches Elektronen–Synchrotron, 22607 Hamburg
Z. Suzuki
Tohoku University, Sendai 980-8578
U. Tamponi
INFN - Sezione di Torino, 10125 Torino
University of Torino, 10124 Torino
G. Tatishvili
Pacific Northwest National Laboratory, Richland, Washington 99352
Y. Teramoto
Osaka City University, Osaka 558-8585
M. Uchida
Tokyo Institute of Technology, Tokyo 152-8550
T. Uglov
Institute for Theoretical and Experimental Physics, Moscow 117218
Moscow Institute of Physics and Technology, Moscow Region 141700
Y. Unno
Hanyang University, Seoul 133-791
S. Uno
High Energy Accelerator Research Organization (KEK), Tsukuba 305-0801
P. Urquijo
University of Bonn, 53115 Bonn
S. E. Vahsen
University of Hawaii, Honolulu, Hawaii 96822
C. Van Hulse
University of the Basque Country UPV/EHU, 48080 Bilbao
P. Vanhoefer
Max-Planck-Institut für Physik, 80805 München
G. Varner
University of Hawaii, Honolulu, Hawaii 96822
K. E. Varvell
School of Physics, University of Sydney, NSW 2006
M. N. Wagner
Justus-Liebig-Universität Gießen, 35392 Gießen
C. H. Wang
National United University, Miao Li 36003
M.-Z. Wang
Department of Physics, National Taiwan University, Taipei 10617
Y. Watanabe
Kanagawa University, Yokohama 221-8686
K. M. Williams
CNP, Virginia Polytechnic Institute and State University, Blacksburg, Virginia 24061
E. Won
Korea University, Seoul 136-713
Y. Yamashita
Nippon Dental University, Niigata 951-8580
S. Yashchenko
Deutsches Elektronen–Synchrotron, 22607 Hamburg
Y. Yusa
Niigata University, Niigata 950-2181
V. Zhilich
Budker Institute of Nuclear Physics SB RAS and Novosibirsk State University, Novosibirsk 630090
V. Zhulanov
Budker Institute of Nuclear Physics SB RAS and Novosibirsk State University, Novosibirsk 630090
A. Zupanc
Institut für Experimentelle Kernphysik, Karlsruher Institut für Technologie, 76131 Karlsruhe
Abstract
We report a study of the suppressed decay , , where denotes either a or a
meson. The decay is sensitive to the -violating
parameter . Using a data sample of
pairs collected at the resonance with the
Belle detector, we measure the ratio of branching fractions of the
above suppressed decay to the favored decay , . Our result is =
,
which indicates the first evidence of the signal for this suppressed
decay with a significance of standard deviations. We measure
the direct asymmetry between the suppressed and
decays to be . We also report measurements for the analogous
quantities and for the decay .
pacs:
13.25.Hw, 11.30.Er, 12.15.Hh, 14.40.Nd
Several hadronic weak decays related by the combined
charge-conjugation and parity () transformations exhibit
different behavior. Such violation of symmetry is described by
the Standard Model of particle physics via an irreducible complex
phase in the Cabibbo-Kobayashi-Maskawa (CKM) quark mixing
matrix ckm , which has elements , with
and . The unitarity triangle (UT) is
used to represent the amount of violation parameterized by the
CKM matrix. The UT angle is less precisely
measured compared to the other two angles
and . The particular importance of improving
the determination of lies in the fact that it is the only
-violating parameter that describes the UT that can be measured
solely in tree-level processes. As a result, such measurements
provide a benchmark to search for new physics contributions in
loop-dominated processes that would otherwise constrain the UT.
Various methods to determine in the tree decay , where is a or decaying to a common
final state icc , have been proposed glw ; soni ; giri . In
this paper, we focus on the Atwood-Dunietz-Soni (ADS) method
soni using the decay followed by . Several ADS measurements have been made using
BABARADS ; BelleADS ; CDFADS ; LHCbADS ; Negishi . However, given a significantly larger branching fraction
for than
pdg , the former
mode is potentially more sensitive to despite a reduced
acceptance owing to the presence of a meson in the final
state. Herein, we search for events for the first time in Belle,
where the favored decay followed by the
doubly Cabibbo-suppressed (DCS)
decay interferes with the suppressed
decay followed by the Cabibbo-favored (CF) decay. The interference between the two
amplitudes can lead to a large direct asymmetry between the
suppressed decays. We use as a control
channel because of the kinematic similarity to and its much larger branching fraction.
One observable measured is the ratio of the suppressed to favored
branching fractions
the second is the direct asymmetry,
where and are the absolute ratio and strong-phase
difference between the suppressed decay and
the favored decay amplitudes. Furthermore,
the ratio of DCS and CF decays is defined via
(3)
and the coherence factor and average strong-phase
difference AS via
(4)
Here, and are the magnitudes of the
CF and DCS amplitudes, respectively,
is the relative strong phase,
and indicates a point in the Dalitz plane.
The definition of is such that its value is
bounded between zero and one. Sensitivity to through
measurements of and is maximal when
is unity. The measured value of
is cleo , which means that these observables are
suitable to obtain information about . The previous
measurement of this channel babar1 has constrained
to be less than at the 90% confidence level; no
limit on is presented.
The observables for the mode are and
. They can be defined using Eqs. (1) and (2) with the
following substitutions: for the daughter, , and . Here,
and are the absolute ratio and strong-phase
difference between the suppressed and favored
decay amplitudes. The sensitivity to is reduced in this
mode because is approximately an order of magnitude
smaller than . There have been no previous measurements of
and . In Ref. rama it has been shown that the corrections due to -mixing on and
are potentially large; therefore, such corrections would need to be taken into account
if these measurements are used in the determination of .
Our measurement uses a data sample of
pairs, collected with the Belle detector detector located at
the KEKB asymmetric-energy (3.5 on 8 GeV) collider
collider operating near the resonance. The
principal detector elements used in this analysis are a silicon
vertex detector, a 50-layer central drift chamber (CDC), an array of
aerogel threshold Cherenkov counters (ACC), a barrel-like arrangement of time-of-flight scintillation counters
(TOF), and an electromagnetic calorimeter comprised of CsI(Tl)
crystals located inside a super-conducting solenoid coil that
provides a 1.5 T magnetic field.
We reconstruct candidates
from photon pairs that have a momentum greater than 400 MeV/ in
the center-of-mass (CM) frame and an invariant mass between
120 and 145 MeV/, which corresponds to approximately
in resolution around the nominal mass
pdg . Each photon candidate is required to have an energy
greater than 50 MeV. We apply a mass-constrained fit to the
candidate to improve its momentum resolution.
Neutral meson candidates are reconstructed from a pair of
oppositely charged tracks and a candidate. Each track must
have a distance of closest approach to the interaction point of less
than 0.2 cm in the plane transverse to the positron beam direction
and less than 1.5 cm along the positron beam axis. We also define
(), the likelihood of a track being a kaon (pion),
based on particle identification (PID) information pid from
the ACC and the TOF, combined with specific ionization measured in
the CDC. We apply likelihood-ratio requirements of for a kaon candidate and
for a pion candidate. The efficiency to identify a
kaon (pion) is approximately 83% (88%) averaged over momentum and
the probability of misidentifying a pion (kaon) as a kaon (pion) is
approximately 8% (7%). The invariant mass of
candidates is required to satisfy , which corresponds to
approximately in resolution around the nominal
mass pdg . To improve the four momentum resolution of the
daughters, we apply a -mass constrained fit.
A meson candidate is reconstructed by combining the
candidate with a charged hadron. The same set of
requirements is applied for the prompt track as that used for
meson reconstruction. The signal is identified with the
beam-energy-constrained mass and the energy difference , where is
the beam energy and is the momentum (energy)
of the meson candidates in the CM frame. For decays,
peaks at the nominal mass of the meson pdg
and peaks at zero. We select candidates in the ranges and
.
To suppress background coming from the decays in , we use the
mass difference between the and candidates
. We reconstruct candidates from
the meson used for reconstruction and a
candidate not used in the reconstruction. No PID requirement is
applied to the because of its low momentum when coming
from the decay. After requiring , we remove of
backgrounds and of all backgrounds. The relative
loss of signal efficiency is .
A possible source of peaking background is the favored
( or ) decay, which can
contribute to the signal region of the respective suppressed decay,
due to misidentification of both the and mesons in
the decay. To reject this background, we veto events satisfying
when the mass assignments of the and are
exchanged. This criterion reduces the background to a negligible
level with a relative loss of signal efficiency of around .
About 6% of events have multiple candidates; the candidate with
and most consistent with the
corresponding nominal values is retained for further analysis.
The dominant remaining background for both the favored and the
suppressed decays comes from
( = , , , or ) continuum events. The daughters from
events tend to emerge isotropically in the CM frame whereas
the particles from continuum events are collimated into back-to-back
jets. We exploit this difference in event topology by using a neural
network BelleADS ; NN to combine shape variables that describe
the particle distribution with other properties of the event that
differentiate between and events.
The neural network utilizes the following nine input variables: 1)
the likelihood ratio of the Fisher discriminant formed from 17
modified Fox-Wolfram moments sfw ; 2) the absolute value of
the cosine of the angle in the CM frame between the thrust axis of
the decay and that of the remaining particles in the event; 3)
the vertex separation between the candidate and the remaining
charged tracks along the beam direction; 4) the cosine of the angle
between the direction of the candidate from the decay and
the direction opposite the flight of the candidate measured in
the rest frame; 5) the absolute value of the flavor tagging
dilution factor ftag ; 6) the cosine of the angle between the
flight direction and the beam axis in the CM frame; 7) the
cosine of the angle between the and directions in
the rest frame of the ; 8) the product of the charge of the
candidate and the sum of the charges of all kaons not used for the
reconstruction of the candidate; and 9) the difference between
the sum of the charges of particles in the hemisphere and the
sum of charges in the opposite hemisphere, excluding the particles
used in the meson reconstruction.
The neural network output is in the range
to 1, where events at = 1 are
signal (continuum) like. The training and optimization of the neural
network are carried out with signal and Monte Carlo (MC)
samples after event-selection requirements are imposed. We require
, which rejects of the
continuum background and only of the signal. The
selection efficiency after all criteria have been applied is
() for () decays.
The distribution peaks strongly at
1 and is therefore difficult to
model with a simple analytic function. Therefore, to improve this
modeling, we transform to a new variable
:
(5)
Here, = and = 1
are the minimum and maximum values of for
the events used for the signal extraction. The distribution of
can be modeled by Gaussian or asymmetric
Gaussian functions.
We extract the signal yield using an unbinned extended maximum
likelihood fit to and
distributions. We perform separate fits to the suppressed and
favored () modes. The total PDF for each
component is formed by multiplying the individual PDFs for and , as they have negligible
correlation. The and PDF for
each fit component are described as follows.
For signal, the distribution is parameterized by a sum of
two Gaussian functions of common mean. The
distribution is parameterized by the sum of a symmetric Gaussian and
an asymmetric Gaussian having different means. The PDF shape
parameters used in the fit to the suppressed mode are fixed to the
values obtained from the fit to the favored mode.
For decays, there is a background from decays
where the daughter of the is misidentified as a . This
background peaks in at around 45 MeV and is modeled by
the sum of a symmetric Gaussian and an asymmetric Gaussian. The
distribution of is the same as for the
signal, so the same PDF is used. For the fit to the suppressed
data, the background yield is fixed to that measured in the
suppressed signal fit multiplied by the misidentification
rate; this procedure reduces the statistical uncertainty on the
signal yield. For this background component, all other PDF shape
parameters in the suppressed mode are fixed to those measured in the
fit to the favored mode.
The background in the favored modes has two
components. The first is from and
events and peaks at , so an upper tail is observed within the fit
range. The second component is combinatorial. The peaking and
combinatorial components are modeled by an exponential and
first-order polynomial, respectively. The suppressed has a much
smaller peaking background contribution than the favored
mode, so an exponential function is used to model the whole peaking
and combinatorial background. The
distribution for the background is parameterized by a
Gaussian function, which is determined separately for suppressed and
favored modes from the MC sample.
The and distributions for the
continuum background are parametrized by a first-order
polynomial and a sum of two Gaussian functions of common mean,
respectively. The parameters for are
determined using the sideband, given by , for all
modes. For the suppressed mode, the mean of one of the Gaussians is
left free in the fit to data; this minimizes the cross feed between
the and combinatorial backgrounds.
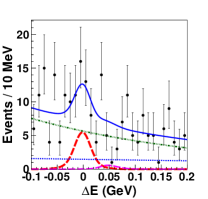
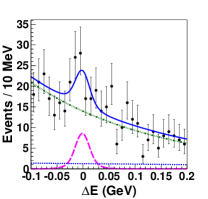
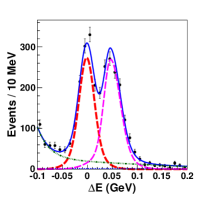
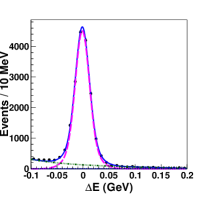
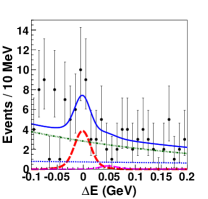
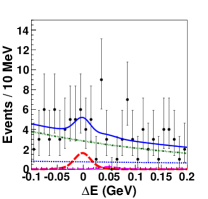
The projections of the fits for the suppressed and favored
modes are shown in Figs. 1 and 2,
respectively. Suppressed and signal peaks are visible.
The values of are determined using the signal yields and
efficiencies given in Table 1:
Figure 1: [color online]. (
) and ()
distributions for (left),
(right). In these plots, points with
error bars represent data while the total best-fit projection is
shown with the solid blue curve, for which the components are shown
with thicker dashed red ( signal), thinner dashed magenta
(), dashed dot green ( background) and dotted blue
( background). To enhance the signal and suppress the
dominant continuum background in the projection, a strict
criterion on is applied.
Figure 2: [color online]. (
) and ()
distributions for (left),
(right). The color legend and fit
components are the same as those in Fig. 1.
(6)
(7)
The systematic uncertainties associated with and
are are listed in Table 2 and estimated as follows. The
uncertainties due to fixed PDF shape parameters that are obtained
from data are estimated by varying each fixed parameter by
. The uncertainty due to the
PDF is estimated by varying the mean and
width of the Gaussian by the maximum differences observed between
data and MC for the PDF from favored
signal. Possible bias related to the fit is checked with 10000
simulated experiments. No bias is observed, and the systematic
uncertainty due to possible bias is taken to be the error on the
mean residual. A small bias is observed in the yields of
and backgrounds in the suppressed mode
simulations. This is due to an imperfect modeling of the continuum
distribution in the signal region by the
fits to the sideband. The impact of this bias on the
signal yield is estimated using simulated experiments to be at most
.
Charmless decay could result in
an irreducible peaking background to the signal. The size of this
background is bounded by fits to the sidebands of the reconstructed
mass: and
. We apply the
same fitting method used in the signal extraction to the sideband
sample to obtain an expected yield of and events
for suppressed and , respectively. Since the yields are
consistent with zero, we include the uncertainty on the obtained
yield as a systematic uncertainty. This is the dominant source of
systematic uncertainty on the measurement of .
There are also uncertainties on the efficiency coming from the
limited statistics of the MC sample and the calibration of the PID
efficiency for potential data-MC differences. The uncertainty due to
fixing the yield in the fit to the suppressed
sample is found to be negligible.
The signal significance is calculated as
, where
is the maximum likelihood and is
the likelihood when the signal yield is constrained to be zero. In
order to include systematic uncertainty in the significance, we
convolve the fit likelihood with a Gaussian whose width is equal to
the systematic uncertainty for and with an asymmetric
Gaussian whose widths are the negative and positive systematic
uncertainties for . The significance of
is .
Table 1: Signal yields, reconstruction efficiencies for signals
after PID calibration for any data-MC discrepancy and significances
() including systematic uncertainties. The
uncertainties listed for the signal yield are statistical only, and
those on efficiency are from MC statistics and the PID
correction.
Mode
Yield
Efficiency (%)
7724
10.90.1
3.2
3844125
10.80.1
9427
11.20.1
3.3
49668338
11.20.1
We measure in a separate fit to the suppressed candidates,
including the charge of the kaon or pion from the decay as an
additional observable and as a new free parameter. Since
asymmetries associated with and parameters are
expected to be negligible, they are fixed to zero in the
fit. The measured values are:
(8)
(9)
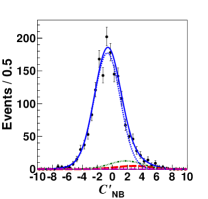
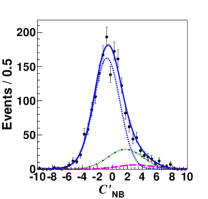
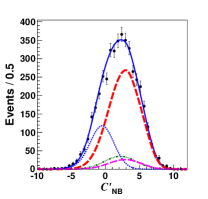
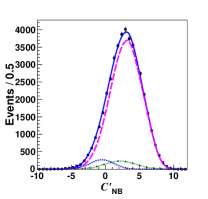
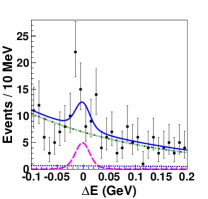
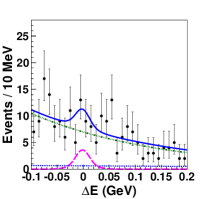
The projections for signal and are shown in
Fig. 3. The systematic uncertainties (see Table
2) arise from the following sources. Uncertainties
related to the fit parameters are obtained in the same way as those
estimated for . The uncertainty due to the yield of the
peaking background is () for
(), which is estimated under the assumption of zero
asymmetry in the peaking background. A possible bias in due
to any detector asymmetry is estimated by determining the asymmetry
between and in the favored mode, which is expected
to be close to zero. No detector asymmetry is observed in the
favored mode, so the uncertainty on the measurement is taken as
a systematic uncertainty for the suppressed mode. An asymmetry
is seen in the favored mode, which is taken as a systematic
uncertainty for the suppressed mode. The remaining sources
are found to give negligible contributions.
Figure 3: [color online]. distributions
( ) for
(left upper), (right upper),
(left lower),
(right lower). The color legend and fit components are the same as
those in Fig. 1.
Table 2: Summary of the systematic uncertainties for and
. Negligible contributions are denoted by –.
Source
E and PDFs
Fit bias
–
–
Due to and bias
–
–
–
Peaking background
Efficiency
–
–
Detector asymmetry
–
–
Total
In summary, for the mode ,
(), we report the measurements and , using
pairs collected
by the Belle detector. We obtain the first evidence for the suppressed signal
with a significance of . In addition, we report the first
measurements of , and . The
and results obtained can be used to constrain the UT angle
using the ADS method soni .
We thank the KEKB group for the excellent operation of the
accelerator; the KEK cryogenics group for the efficient operation of
the solenoid; and the KEK computer group, the National Institute of
Informatics, and the PNNL/EMSL computing group for valuable
computing and SINET4 network support. We acknowledge support from
the Ministry of Education, Culture, Sports, Science, and Technology
(MEXT) of Japan, the Japan Society for the Promotion of Science
(JSPS), and the Tau-Lepton Physics Research Center of Nagoya
University; the Australian Research Council and the Australian
Department of Industry, Innovation, Science and Research; Austrian
Science Fund under Grant No. P 22742-N16; the National Natural
Science Foundation of China under contract No. 10575109, 10775142,
10825524, 10875115, 10935008 and 11175187; the Ministry of
Education, Youth and Sports of the Czech Republic under contract
No. MSM0021620859; the Carl Zeiss Foundation, the Deutsche
Forschungsgemeinschaft and the VolkswagenStiftung; the Department of
Science and Technology of India; the Istituto Nazionale di Fisica
Nucleare of Italy; The WCU program of the Ministry Education Science
and Technology, National Research Foundation of Korea Grant No.
2011-0029457, 2012-0008143, 2012R1A1A2008330, 2013R1A1A3007772, BRL
program under NRF Grant No. KRF-2011-0020333, BK21 Plus program, and
GSDC of the Korea Institute of Science and Technology Information;
the Polish Ministry of Science and Higher Education and the National
Science Center; the Ministry of Education and Science of the Russian
Federation and the Russian Federal Agency for Atomic Energy; the
Slovenian Research Agency; the Basque Foundation for Science
(IKERBASQUE) and the UPV/EHU under program UFI 11/55; the Swiss
National Science Foundation; the National Science Council and the
Ministry of Education of Taiwan; and the U.S. Department of Energy
and the National Science Foundation. This work is supported by a
Grant-in-Aid from MEXT for Science Research in a Priority Area
(“New Development of Flavor Physics”), and from JSPS for Creative
Scientific Research (“Evolution of Tau-lepton Physics”).
References
(1) N. Cabibbo, Phys. Rev. Lett. 10, 531 (1963); M. Kobayashi and T. Maskawa, Prog. Theor. Phys. 49, 652
(1973).
(2) Thoughout this paper, the addition of the charge conjugate decay mode is implicit unless stated otherwise.
(3) M. Gronau and D. London, Phys. Lett. B 253, 483
(1991); M. Gronau and D. Wyler, Phys. Lett. B 265, 172
(1991).
(4) D. Atwood, I. Dunietz and A. Soni, Phys. Rev. D 63, 036005 (2001).
(5) A. Giri, Yu. Grossman, A. Soffer, and J. Zupan, Phys.
Rev. D 68, 054018 (2003).
(6) P. del Amo Sanchez et al. (BaBar Collaboration), Phys. Rev. D 82, 072006 (2010).
(7) Y. Horii et al. (Belle Collaboration),
Phys. Rev. Lett. 106, 231803 (2011).
(8) T. Aaltonen et al. (CDF Collaboration), Phys. Rev. D 84, 091504(R)
(2011).
(9) R. Aaij et al. (LHCb Collaboration), Phys. Lett. B 712, 203 (2012).
(10) K. Negishi et al. (Belle Collaboration), Phys. Rev. D 86, 011101 (R) (2012).
(11) J. Beringer et al. (Particle Data Group), Phys. Rev. D 86, 010001 (2012).
(12) D. Atwood and A. Soni, Phys. Rev. D 68, 033003 (2003).
(13) N. Lowrey et al. (CLEO Collaboration), Phys. Rev. D 80, 031105(R) (2009).
(14) J. P. Lees et al. (BaBar Collaboration), Phys. Rev. D 84, 012002 (2011).
(15) Matteo Rama, arXiv:1307.4384 [hep-ex].
(16)A. Abashian et al. (Belle Collaboration), Nucl. Instrum. Methods Phys. Res., Sect. A 479,
117 (2002); also, see the detector section in J. Brodzicka et
al., Prog. Theor. Exp. Phys., 04D001 (2012).
(17)S. Kurokawa and E. Kikutani, Nucl. Instrum. Methods Phys. Res., Sect. A 499, 1
(2003), and other papers included in this volume; T. Abe et
al., Prog. Theor. Exp. Phys., 03A001 (2013) and following articles
up to 03A011.
(19) M. Feindt and U. Kerzel, Nucl. Instrum. Methods Phys. Res., Sect. A 559, 190 (2006).
(20) The Fox-Wolfram moments were introduced in G. C. Fox and S. Wolfram,
Phys. Rev. Lett. 41, 1581 (1978); the modified moments used in
this paper are described in S. H. Lee et al. (Belle
Collaboration), Phys. Rev. Lett. 91, 261801 (2003).
(21) H. Kakuno et al. (Belle Collaboration), Nucl. Instrum. Methods
Phys. Res., Sect. A 533, 516 (2004).