Quantum Monte Carlo Simulations for Stacked Spin Ladder Systems Containing Low Concentrations of Non-Magnetic Impurities; Application to the Low Temperature Broadening of NMR-Spectra in SrCu2O3.
Abstract
We present a quantum Monte Carlo study for Heisenberg spin- two-leg ladder systems doped with non magnetic impurities. The simulations are applied to the doped spin-ladder compound Sr(Cu1-xZnx)2O3 where a large broadening of the 65Cu NMR lines has been observed in experiment at low temperatures far larger than the Néel temperature. We find that interladder couplings with a sizable coupling in the stacking direction are required to describe the line broadening, which can not be explained by considering a single ladder only. Around a single impurity, spin correlations cause an exponentially decaying antiferromagnetic local magnetization in a magnetic field. We develop an effective model for the local magnetization of systems with many randomly distributed impurities, with few parameters which can be extracted out of quantum Monte Carlo calculations with a single impurity. The broadening arises from a drag effect, where the magnetization around an impurity works as an effective field for spins on the neighboring ladders, causing a non-exponentially decaying magnetization cloud around the impurity. Our results show that even for impurity concentrations as small as and , the broadening effect is large, in good quantitative agreement with experiment. We also develop a simple model for the effective interaction of two impurity spins.
I Introduction
SrCu2O3 is a spin- Heisenberg spin-ladder compound that has been studied intensely both experimentally and theoretically. The crystallographically determined structureAzuma et al. (2004); Sparta et al. (2006) consists of planar Cu-O trellis lattices with intercalated Sr ions. These trellis lattices contain the spin ladders which are almost perfectly decoupled due to frustration. The unpaired electron of the Cu2+ ion carries a spin- and the spin dynamics arises from the Cu-O-Cu interaction via superexchange over the oxygen ions. The hyperfine interaction couples the magnetic moments of the spins to the nuclear magnetic moments of the Cu ions and in turn influences the local magnetic resonance field. Upon doping with very small amounts of non-magnetic impurities, e.g. 0.25% of Zn, which occupy Cu sites, a surprisingly large broadening of the Cu NMR-spectrum with decreasing temperature has been observed.Fujiwara et al. (1998); Ohsugi et al. (1999) A satisfactory theoretical explanation is still missing. It is known that an impurity in a single spin ladder causes an exponentially decaying staggered effective local magnetic moment profile around this impurity.Iino and Imada (1996); Motome et al. (1996); Fukuyama et al. (1996); Mikeska et al. (1997); Sandvik et al. (1997); Laukamp et al. (1998); Greven and Birgeneau (1998); Bobroff et al. (2009); Alloul et al. (2009) However, fitting the NMR spectra on the basis of this exponential behavior requires much larger correlation lengths than found in theoretical studies of single spin ladders.Greven et al. (1996); Greven and Birgeneau (1998) For a reasonable fit with an impurity concentration of , Ref. Fujiwara et al., 1998 suggested a correlation length of about 100, and for a concentration of , Ref. Ohsugi et al., 1999 estimated 20 - 50. Theoretical studies suggest, however, that the correlation length of undoped ladders is much smaller, and they show that it barely changes upon introduction of a few impurities.Sandvik et al. (1997); Mikeska et al. (1997); Greven and Birgeneau (1998); Bobroff et al. (2009) For , a differently structured material with large inter-ladder coupling inside one layer, an exponentially decaying cloud modelBobroff et al. (2009); Alexander et al. (2010) (exp(-(//)) and a stacked ladder version (exp(-(///)) are reported to show qualitative agreement with experiment for impurity concentrations around , but fail to explain the broadening at very small dilutions ().
In the present paper we perform quantum Monte Carlo (QMC) simulations for single and stacked spin-ladders within the parameter range suggested in the report by Johnston et al.Johnston et al. . We develop an effective model for the magnetization on systems of stacked ladders with random impurities which needs only a few parameters measured by QMC and permits an efficient calculation of the NMR spectrum. We find that the coupling of adjacent stacked spin ladders strongly influences the NMR spectrum, and a value at the upper end of the range suggested in Ref. Johnston et al., is required to describe the experimentally found low-temperature NMR line broadening down to very small impurity concentrations, consistent with a study on the chain material Sr2CuO3.Sirker and Laflorencie (2009)
In Sec. II, we briefly summarize the results of NMR experiments on with nonmagnetic impurities. In Sec. III, we specify the Heisenberg model which we use to describe this material. Section IV contains results on single ladders, including an effective model for the interaction of two impurities, and Sec. V contains our results on stacked ladders. Sec. VI discusses the effects on NMR spectra, and Sec. VII contains our conclusions.
II NMR experiment
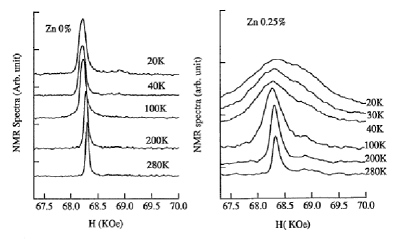
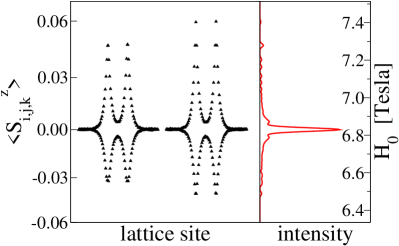
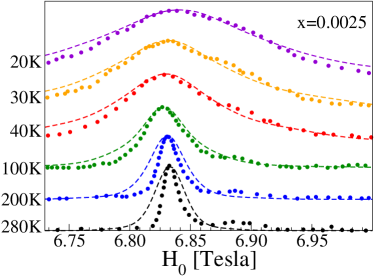
In their experimental investigation, Fujiwara et al. Fujiwara et al. (1998) reported NMR studies on undoped and doped SrCu2O3. The results are shown in Fig. 1. For a doping of a massive broadening of the Cu NMR spectrum is observed upon lowering the temperature, while in the undoped specimen this effect is almost absent. Similar experimental results have been obtained for SrCu2O3 by Ohsugi et al., Ohsugi et al. (1999) and also for other spin-ladder systems YBa2(Cu1-xZnx)3O6+y,Alloul et al. (1991); Ishida et al. (1993) YBa2(Cu1-xZnx)4O8, Williams et al. (2000) and Bi(Cu1-xZnx)2PO6 .Casola et al. (2010)
NMR measures the distribution of magnetizations in a system exposed to an external magnetic field. We note that quantitatively, the broadening of the NMR signal corresponds to relatively small magnetizations on the order of (see Sec. VI.1). At first sight an increasing linewidth for decreasing temperature is counterintuitive. It suggests that the observed broadening is due to the temperature dependence of correlations along and between the spin ladders, and Refs Fujiwara et al., 1998; Ohsugi et al., 1999 phenomenologically described the broadening with very large spin correlation lengths. However, the broadening takes place at temperatures far above the 3d ordering temperature of about 1 K in SrCu2O3 at the same impurity concentration,Azuma et al. (1997); Larkin et al. (2000) where long-range correlations would be expected.
In the following we will therefore investigate the distribution of magnetizations in a model for SrCu2O3 with impurities. We find that the spin correlation length is indeed barely affected by impurities in the temperature range of the NMR experiments, but the magnetization profiles around impurities is strongly influenced by the coupling of stacked ladders.
III Modeling SrCu2O3
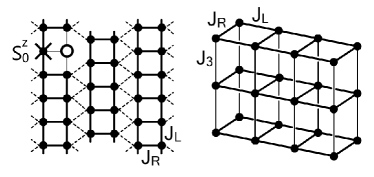
The unsaturated spins of the Cu2+ ions in the Cu-O planes in SrCu2O3 form spin ladders which are visualized in Fig. 2, where the spins along the ladder couple anti-ferromagnetically. Within the Cu-O planes the ladders form a trellis lattice,Gopalan et al. (1994) while normal to the Cu-O planes the ladders are stacked. The trellis lattice is responsible for an effective decoupling of the ladders due to frustration. We model SrCu2O3 like in Refs. Johnston (1996); Johnston et al. as a system of stacked ladders with spin- Heisenberg interactions,
| (1) |
with nearest-neighbor couplings and an external magnetic field , 111In specifying in the paper we leave out the unit Tesla/Kelvin, i.e. should be read as . , , and .
Inside the ladder the interaction is described by the coupling along the ladder leg and along the rungs. The difference in the electronic structure of the oxygen ions on the rungs and on the ladder legs causes an anisotropy of the spin coupling constants JL and JRMizuno et al. (1998). In the stacking direction the interaction is described by a coupling J3. We denote the direction to be along the ladder and the direction along the stacking direction. Doping by a Zn atom introduces a non-magnetic impurity, i.e., a missing site in the model.
We simulate the model using a highly parallelized web Quantum Monte Carlo code with a directed loop algorithm Swendsen and Wang (1987); Evertz (2003); Evertz et al. (1993); Syljuåsen and Sandvik (2002) in stochastic series expansion (SSE) representation of the associated path integral. We employ the spin ladder structure as outlined in Fig. 2, periodic boundary conditions in the chain (=x) direction, and for stacked ladders also in the stacking (=z) direction.
We follow the results of Johnston at al.Johnston et al. for the size of interactions. 222Potential additional cyclic couplings Calzado et al. (2003) are not accessible by QMC calculations because of a severe sign problem. For a single ladder we use / 0.4 - 0.6 with 1905 K. For stacked ladders, we employ / 0.5 and / 0.001 - 0.03 with 1920 K. The magnetic field used in the NMR experiments is O(10) T; i.e., .
IV Single ladder
IV.1 Magnetization profile of a single impurity
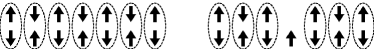
To describe the impact of an impurity in a spin ladder one may first consider the case of (or vanishing JL) which leads to the so called rung picture,Dagotto and Rice (1996) in which the rungs are seen as independent from each other (Fig. 3). The spins of a rung form a singlet separated by a spin-gap of energy from the triplet state that prevents the system from responding to a small external magnetic field. By introducing an impurity, one singlet is broken up and leaves a spin- free to respond to an external magnetic field (free spin). The picture remains useful even at large , where the presence of an impurity still breaks a singlet and leaves a free spin.Alloul et al. (2009)
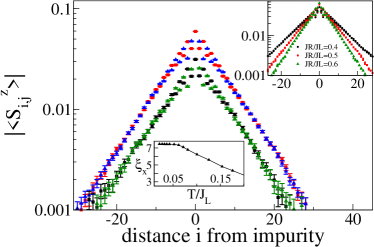
In a magnetic field, the antiferromagnetic correlations on the ladder cause a staggered local magnetic moment profile to develop around the impurity. In Fig. 4 the absolute values of the local spin expectation values are plotted for two temperatures within the experimental range (see Fig. 1). The profiles have their maximum at the spin S0 residing on the same rung as the impurity and drop exponentially with the correlation length of the undoped system.Sandvik et al. (1997); Mikeska et al. (1997); Greven and Birgeneau (1998); Bobroff et al. (2009) as
| (2) |
Here, is the spin on the same rung as the impurity and is the distance in the leg direction and in the rung direction from S0. Plotting on a logarithmic scale (Fig. 4) shows the nearly perfect exponential dependence. Some deviations occur close to the impurity, at large magnetizations not directly relevant for the observed broadening (see Sec. VI.1). The absolute value of the spins on the same ladder leg as the impurity () is somewhat smaller than on the other leg at small distance , but it appears to approach the values of the leg at large distances .
The lower inset of Fig. 4 shows the temperature dependence of the correlation length. It remains almost constant Greven et al. (1996); Greven and Birgeneau (1998); Bobroff et al. (2009) below . The upper inset in Fig. 4 compares the profiles for varying . Upon decreasing , the correlation length increases, however even at the resulting correlation length is much smaller than the values fitted to the NMR spectra in earlier studies.Fujiwara et al. (1998); Ohsugi et al. (1999) Correspondingly, the exponentially decaying clouds around impurities on independent ladders shown in Fig. 4 produce only a very small broadening of the NMR signal (see Sec. VI.1).
IV.2 Temperature and magnetic field dependence
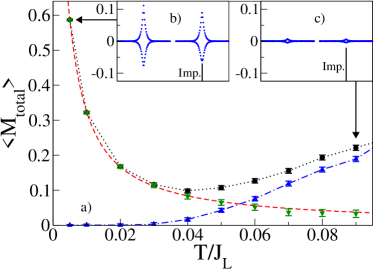
We analyze the temperature dependence of spin magnetizations Sandvik et al. (1997) in systems with a single impurity and without impurities. We observe two mechanisms which have a direct impact on the NMR spectrum. In Fig. 5, both effects are demonstrated for the total magnetization of the doped and undoped systems. The undoped system (blue up-triangles) exhibits a collective excitation of all the spins as a response to the external field at temperatures above about (blue line in Fig. 5). This collective excitation causes a temperature dependent shift of the NMR peak without changing its width, in quantitative agreement with the NMR results in Fig. 1. The second effect is the creation of a local cloud of magnetic moments around the impurity [Figs. 4 and 5(insets)] which causes the total magnetization to grow again at sufficiently low temperatures, corresponding to a shift back of the NMR signal in Fig. 1 at temperatures of 40 K () and below. By plotting the difference of the total magnetization between the undoped and the doped systems we find that the total magnetization caused by the impurity corresponds to one spin moment Iino and Imada (1996); Miyazaki et al. (1997); Sandvik et al. (1997) at low temperature, in agreement with experiment,Azuma et al. (1997) and that it closely follows the analytic solution of a free spin in a magnetic field (dashed red line in Fig. 5) , with
| (3) |
independent of the size of couplings, in the range studied.
Indeed, we find that the individual local magnetic moments also show a tanh behavior, modulated by the exponential decay of Eq. 2,
| (4) |
with a proportionality factor which depends on the correlation length.
In the temperature range where most of the broadening takes place in experiment, is independent of temperature (Fig. 4, lower inset). In this range, can be obtained from a single QMC simulation by measuring at a reference temperature and a magnetic field Href:
| (5) |
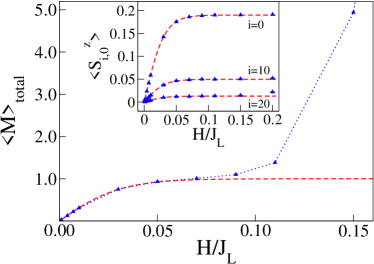
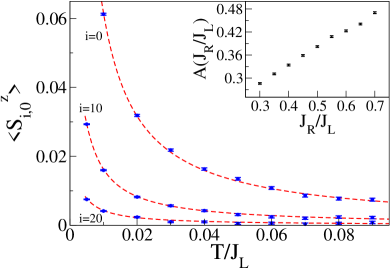
Fig. 6 shows a comparison between the analytical model Eq. 4 and QMC results for three different lattice sites on the ladder leg opposite to the impurity (j=0). was extracted from a single QMC simulation at K. In the broadening temperature regime ( const.) and even beyond, the analytical model (dashed lines) matches the QMC data very well.
On the ladder leg containing the impurity (j=1), the magnitude of local spin expectation values is somewhat smaller than specified in Eq. 4 (see Fig. 4), consistent with the total homogeneous magnetization of the ladder to be that of a single free spin without a factor . [Eq. 3 and Fig. 5].
In Fig. 7 we compare Eqs. 3 and 4 to QMC results as a function of magnetic field at fixed temperature. The match to local spin expectation values (inset) is very good. QMC results for the total magnetization (blue triangles) match the free spin solution perfectly for fields H/J. Above H/J (corresponding to an applied magnetic field of about 200 T) the magnetization starts to rise significantly, which indicates that the applied magnetic field is large enough to break up the singlets. In simulations of the NMR response (discussed below), the magnetic fields never exceeds H/JL = 0.01, so that Eq. 4 remains valid.
IV.3 Two impurities: Effective interaction
The present work is primarily concerned with small impurity concentrations . We therefore focus our investigation of impurity interaction on pairs of impurities, since for combinatoric reasons already three close impurities occur with very small probability.
We find the magnetic moment profile of two impurities to be close to a simple superposition of single-impurity profiles, but with a modified overall amplitude instead of . At small temperatures where Eq. 5 is valid, we find that the T and H dependence is again just a tanh, and with Eq. 4 the single-impurity profiles to be superposed are
| (6) |
where is the distance between the impurities in the x direction,
| (7) |
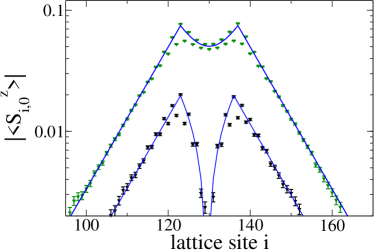
and is measured by QMC calculation for 2 impurities. The normalization is such that the superposition will reproduce . Figure 8 illustrates the quality of this description by plotting Eq. 6 together with QMC results for two different impurity distances such that the impurities reside on (i) the same and (ii) different sublattices of the underlying anti-ferromagnetic structure. Changing the impurity distance by one lattice site and thus changing the sublattice leads to very different magnetization profiles. This is a consequence of the anti-ferromagnetic order around the impurities, which can be described by two ferromagnetic sublattices that are shifted by one lattice site with respect to each other. If the impurities are an even number of lattice sites apart (same sublattice) their magnetization profiles enhance each other (Fig. 8, upper curve). If the impurity distance is an odd number (different sublattice), the profiles interfere destructively leading to the lower curve in Fig. 8. This latter case also resembles the formation of a domain wall.
The unpaired spins interact with each other via the staggered interaction, which decays exponentially with the spin correlation length. One may try to describe their interaction with an effective two-site Heisenberg model Sigrist and Furusaki (1996); Imada and Iino (1997); Mikeska et al. (1997); Anfuso and Eggert (2006) for the two spins located on the same rungs as the impurities, with coupling and a magnetic field . We use the ansatz
| (8) |
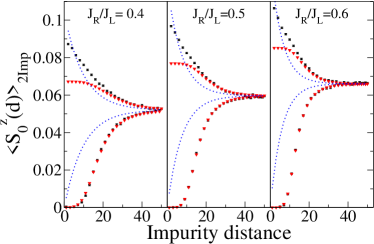
Figure 9 compares the spin expectation values resulting from this model to QMC results for as a function of distance d at different . We find excellent agreement down to very small distances for the case of odd distances, where the two spins form effective singlets. The fitted constants are 0.19, 0.245, and 0.29 for = 0.4, 0.5, 0.6, respectively. For the FM case the agreement is good at large distances, while for small , the two-spin model saturates whereas the magnetization on the full ladder continues to increase. Overall, the simple model Eqs. 6 and 8 describes the magnetization data in Figs. 8 and 9 very well.
V Stacked Ladders
V.1 Effective model, single impurity case
QMC calculations of up to 8 stacked ladders have been performed using the parameters from Johnston et al. Johnston et al. In these systems there is an interaction of spins on neighboring ladders via the exchange constant . Spins are now denoted as , where is the distance in stacking direction from the ladder containing the impurity.
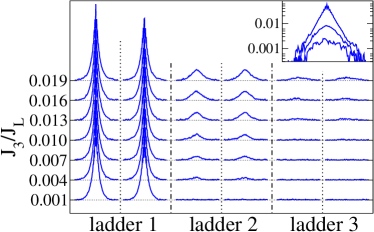
Figure 10 shows the spin expectation values on a six-ladder stack with increasing interaction strength J3 and a fixed ratio /. We use periodic boundary conditions in stacking direction; it is thus sufficient to plot only three ladders. For / 0.001 the stacked ladders behave almost like independent single ladders; the observed tiny magnetization variations in the neighboring ladder are within the numerical noise. With growing /, an increasing influence on the neighboring ladders is seen. Ladder 1 which contains the impurity keeps a simple exponential behavior, with a slowly increasing correlation length, from at to at . However, the effective local magnetic moment distributions on the neighboring ladders do not follow a simple exponential decay law. Instead, the cusp which appears at on the central ladder becomes progressively smeared out on neighboring ladders.
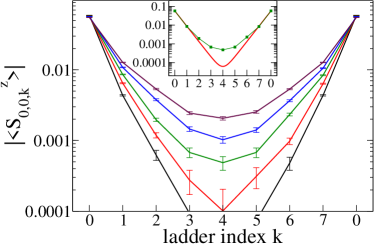
In Fig. 11 the spin expectation values are plotted for different J3/JL in stacking direction, from QMC calculations with 8 stacked ladders. With increasing J3 the deviation from a simple exponential decay increases. This deviation is illustrated in the inset of Fig. 11 where is compared with a for J. We find that for distant ladders the deviation from the hyperbolic cosine behavior increases. It thus becomes obvious that a simple exponential cloud model cannot be used to describe the complete profile caused by an impurity in a stacked ladder system.
Instead we developed a simple effective model, related to the one used in Refs. Sirker, 2009; Sirker and Laflorencie, 2009, for the actual distribution of magnetizations on stacked ladders. The ladder containing the impurity (k=0) shows essentially the same profile as a single ladder and can therefore be described by Eq. 4 (with different normalization).
For the other ladders, let us first look at legs with j=0 (opposite the impurity) We find that the spin expectations value on the next-neighboring ladder (k=1) can be calculated by treating the spin on each site of the k=0 ladder as a separate source of magnetization, with an exponentially decaying cloud in leg direction around it on the k=1 ladder. Subsequently, the magnetizations on the ladder are determined in the same way from those at , and so on for larger k. Thus, our ansatz is
| (9) |
where Lx is the length of the ladders and can be computed like in Eq. 2. This approach treats the magnetization on ladder like a constant field for the spins on neighboring ladders, without back-action because of the small value of . It describes the three-dimensional clouds of magnetizations around impurities very well, as we show below.
The strength of the coupling between the ladders is taken to be a ladder-independent factor with an effective correlation length . Eq. 9 is to be applied iteratively in k, up to the middle ladder in stacking direction, with the remaining ones determined by symmetry
| (10) |
For the other ladder legs (j=1), we approximate the spin expectation values as
| (11) |
for .
To determine we apply Eqs. 4 and 9 to get
| (12) |
with , and taken from a QMC simulation with one impurity on stacked ladders. For the interladder couplings between 0.01 and 0.03 studied in Sec. VI.2, we find to be small, ranging from 0.22 to 0.28. The magnetization profile, Eq. 9, is thus computed from only these three measured quantities.
V.2 Multiple impurities
Similar to single ladders, multiple impurities on stacked ladders can be described by superimposing single-impurity profiles, Eq. 9. When the impurities are located on the same ladder, we account for their interaction by using , Eq. 6, measured on the stacked ladder system, in place of . Since is very small, two impurities located on different ladders do not influence each other much, and we use the single-ladder results in this case. Larger numbers of close-by impurities are extremely rare at small concentrations , so that we can omit the effect of their coupling on the NMR spectrum.
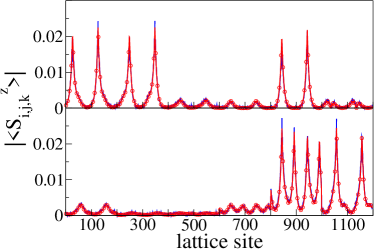
In Fig. 12, we compare our model to QMC results for two distinctly different impurity distributions, namely 3 impurities distributed over 3 ladders (upper panel), and 2 impurities on the same ladder and one on an adjacent ladder (lower panel). We find excellent agreement. Let us emphasize that even such complex spin profiles require only very few parameters for the model function, calculated at a reference temperature and reference external magnetic field, namely , , , and . Only the last of these depends on impurity positions.
VI NMR
VI.1 Magnetic moment profile and calculation of the NMR spectrum
To obtain the Cu2+ NMR spectrum influenced by a magnetic moment profile one has to consider the spin-ion hyperfine coupling in the resonance conditionTedoldi et al. (1999)
| (13) |
is the value of the external field matching the resonance condition at site . Here, is the frequency of the RF field, is the nuclear gyro-magnetic ratio, is the hyperfine coupling (-12T/ for SrCu2O3 Fujiwara et al. (1998)), and is the expectation value for the component of a spin at site induced by an external field .
The dependence on temperature and magnetic field of the spin expectation value is the tanh discussed before, so that QMC calculations need only be done at some reference temperature and reference field :
| (14) |
The NMR spectrum is then obtained by collecting the values of from all lattice sites into a histogram. To account for the natural linewidth we convolute the histograms with a Gaussian of 0.02T half linewidth.
Figure 13 illustrates the resulting NMR spectrum arising from two impurities on a single ladder, with magnetic field strengths as used in the experiment by Fujiwara et al. (Fig. 1). Note that the broadening seen in experiment corresponds to very small values of , up to about 0.01. Larger spin expectation values, which occur on only few sites close to impurities, contribute only little to the histogram, in its outliers. For the understanding of the NMR signal such large spin expectation values may therefore be treated more approximately, as we do in our model descriptions.
Figure 14 illustrates two effects which influence the calculated distribution. The left panel shows that stochastic noise of small spin expectation values in the QMC calculation produces an effective broadening. Therefore QMC calculations of high precision are necessary in order to get reliable NMR histograms. In the right panel of Fig. 14 we show the influence of different impurity positions on the linewidth and line shape, which demonstrates the necessity to average over a large number of impurity configurations.
If each impurity configuration needed to be simulated in a separate QMC simulation, the computational effort would be too large. Instead, we employ the effective analytical description given in Sec. V.1, which allows us to calculate the NMR spectra for many impurity configurations on the basis of only a few parameters measured in QMC simulations. For each set of couplings and we calculated , , and on a system of coupled ladders with one impurity ( for . We calculated and for distances of two impurities on the same leg of a ladder at on coupled ladders. Since this calculation was very time consuming, we used the ratio between and also at other values of . All QMC calculations for the NMR spectra were done at the reference values and T.
VI.2 Results
We used our effective model to generate NMR spectra for given impurity concentrations and for different couplings, based on the QMC simulations described above. 104 random vacancy configurations were generated on systems of up to sites for each set of couplings and . The NMR spectrum was calculated for each vacancy configuration using our model, and the results were superimposed to obtain spectra comparable to realistic NMR signals.
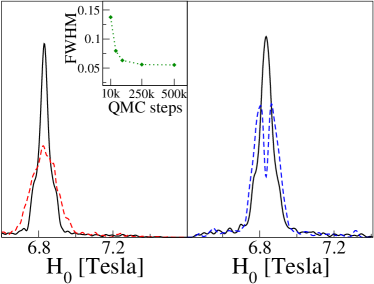
In Fig. 15 we show results at impurity doping for two different stacked ladder couplings J3/JL=0.01 and J3/JL=0.03. At high temperature (340 K), all spectra are similar to the pure Gaussian line shape, i.e. no broadening is visible, even at the larger ladder coupling . This is due to the suppression of magnetic moments by the factor . At low temperature, T=40 K, the NMR spectrum remains narrow for isolated ladders (not shown) since an exponential decay with the small correlation length of the undoped system (Fig. 4) does not contain enough sites with the relevant range of magnetizations. The spectrum remains narrow also for small interladder coupling .
The behavior changes drastically for the larger interladder coupling . Then several stacked ladders obtain magnetizations within the relevant range (cf. Fig. 11), resulting in a broadened NMR spectrum in excellent agreement with the experimental spectrum.
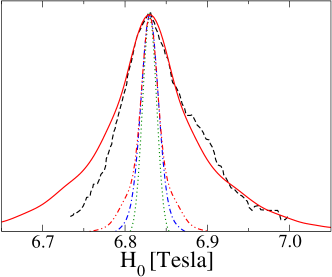
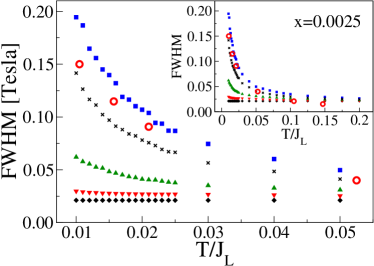
In Fig. 16 we study the broadening at in more detail. We show the FWHM (Full Width at Half Maximum) versus temperature for different interladder couplings . The couplings are JR/JL=0.5 and J3/JL=0.0 (resulting in =7.45), 0.01 (=7.6, =0.218), 0.02 (=8.6, =0.253), 0.03 (=9.75, =0.278), as well as JR/JL=0.4 with J3/JL=0.02 (=11.3554, =0.254). We find that simulated spectra with a stacked ladder coupling slightly below , at the upper end of the couplings specified in Ref. Johnston et al. , match the experimental results well over the whole temperature range. The correlation lengths and were extracted at and assumed to be temperature-independent. This assumption is valid for the low-dilution, low-temperature regime, while for higher temperature there is little broadening so that the influence of the correlation length becomes unimportant.
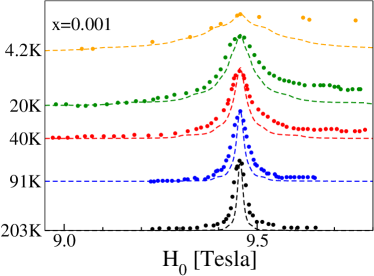
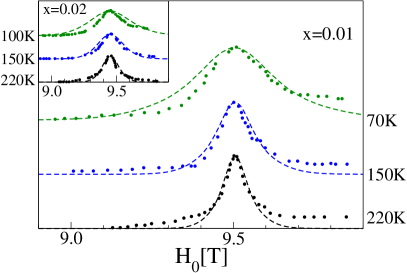
In Figs. 17,18, and 19, we show a detailed comparison of our simulated NMR spectra with experimental results at impurity concentrations of , (which appears to have a larger natural linewidth), and , using JR/JL=0.5 and J3/JL=0.03. We find that our model is in very good agreement with experiment in almost all cases.
VII Conclusions
We studied impurity-containing systems of stacked spin ladders by means of QMC simulations. Temperature and field dependence of magnetizations are paramagnetic. We developed an effective spin model for the interaction of unpaired spins next to two impurities. In contrast to assumptions made in earlier investigations we observed that the staggered magnetization caused by an impurity does not follow a simple three-dimensional exponential behavior. The spin distributions on the ladders in stacking direction deviate progressively from such an exponential dependence. We provided an analytical description for the spin profiles in systems with multiple impurities and used it to simulate the NMR spectra of lightly doped SrCu2O3 with only a small number of parameters determined by QMC. The resulting NMR spectra allowed us to explain the drastic broadening of the 65Cu NMR line in SrCu2O3 found in experimentsFujiwara et al. (1998); Ohsugi et al. (1999) at intermediate temperatures to be a consequence of a sizable coupling between ladders in stacking direction. which causes a non-exponential cloud of small effective magnetic moments to occur around impurities.
Acknowledgements.
The authors acknowledge support from the Austrian Science Fund FWF within SFB ViCoM F4109-N13 P04 and P09 (H.G.E. and P.M.) and from the Science College W401-N13 (R.A.).References
- Azuma et al. (2004) M. Azuma, H. Yoshida, T. Saito, T. Yamada, and M. Takano, J. Am. Chem. Soc. 126, 8244 (2004).
- Sparta et al. (2006) K. Sparta, A. Löffert, C. Gross, W. Aßmus, and G. Roth, Zeitschrift für Kristallographie 221, 782 (2006).
- Fujiwara et al. (1998) N. Fujiwara, H. Yasuoka, Y. Fujishiro, M. Azuma, and M. Takano, Phys. Rev. Lett. 80, 604 (1998).
- Ohsugi et al. (1999) S. Ohsugi, Y. Tokunaga, K. Ishida, Y. Kitaoka, M. Azuma, Y. Fujishiro, and M. Takano, Phys. Rev. B 60, 4181 (1999).
- Iino and Imada (1996) Y. Iino and M. Imada, J. Phys. Soc. Jpn. 65, 3728 (1996).
- Motome et al. (1996) Y. Motome, N. Katoh, N. Furukawa, and M. Imada, J. Phys. Soc. Jpn. 65, 1949 (1996).
- Fukuyama et al. (1996) H. Fukuyama, N. Nagaosa, M. Saito, and T. Tanimoto, Journal of the Physical Society of Japan 65, 2377 (1996).
- Mikeska et al. (1997) H.-J. Mikeska, U. Neugebauer, and U. Schollwöck, Phys. Rev. B 55, 2955 (1997).
- Sandvik et al. (1997) A. W. Sandvik, E. Dagotto, and D. J. Scalapino, Phys. Rev. B 56, 11701 (1997).
- Laukamp et al. (1998) M. Laukamp, G. B. Martins, C. Gazza, A. L. Malvezzi, E. Dagotto, P. M. Hansen, A. C. López, and J. Riera, Phys. Rev. B 57, 10755 (1998).
- Greven and Birgeneau (1998) M. Greven and R. J. Birgeneau, Phys. Rev. Lett. 81, 1945 (1998).
- Bobroff et al. (2009) J. Bobroff, N. Laflorencie, L. K. Alexander, A. V. Mahajan, B. Koteswararao, and P. Mendels, Phys. Rev. Lett. 103, 047201 (2009).
- Alloul et al. (2009) H. Alloul, J. Bobroff, M. Gabay, and P. J. Hirschfeld, Rev. Mod. Phys. 81, 45 (2009).
- Greven et al. (1996) M. Greven, R. J. Birgeneau, and U. J. Wiese, Phys. Rev. Lett. 77, 1865 (1996).
- Alexander et al. (2010) L. K. Alexander, J. Bobroff, A. V. Mahajan, B. Koteswararao, N. Laflorencie, and F. Alet, Phys. Rev. B 81, 054438 (2010).
- (16) D. C. Johnston, M. Troyer, S. Miyahara, D. Lidsky, K. Ueda, M. Azuma, Z. Hiroi, M. Takano, M. Isobe, Y. Ueda, M. A. Korotin, V. I. Anisimov, A. V. Mahajan, and L. L. Miller, “Magnetic susceptibilities of spin-1/2 antiferromagnetic heisenberg ladders and applications to ladder oxide compounds,” arXiv:cond-mat/0001147 (2000) .
- Sirker and Laflorencie (2009) J. Sirker and N. Laflorencie, EPL 86, 57004 (2009).
- Alloul et al. (1991) H. Alloul, P. Mendels, H. Casalta, J. F. Marucco, and J. Arabski, Phys. Rev. Lett. 67, 3140 (1991).
- Ishida et al. (1993) K. Ishida, Y. Kitaoka, N. Ogata, T. Kamino, K. Asayama, J. R. Cooper, and N. Athanassopoulou, J. Phys. Soc. Jpn. 62, 2803 (1993).
- Williams et al. (2000) G. V. M. Williams, J. L. Tallon, and R. Dupree, Phys. Rev. B 61, 4319 (2000).
- Casola et al. (2010) F. Casola, T. Shiroka, S. Wang, K. Conder, E. Pomjakushina, J. Mesot, and H.-R. Ott, Phys. Rev. Lett. 105, 067203 (2010).
- Azuma et al. (1997) M. Azuma, Y. Fujishiro, M. Takano, M. Nohara, and H. Takagi, Physical Review B 55, R8658 (1997).
- Larkin et al. (2000) M. I. Larkin, Y. Fudamoto, I. M. Gat, A. Kinkhabwala, K. M. Kojima, G. M. Luke, J. Merrin, B. Nachumi, Y. J. Uemura, M. Azuma, T. Saito, and M. Takano, Physical Review Letters 85, 1982 (2000).
- Gopalan et al. (1994) S. Gopalan, T. M. Rice, and M. Sigrist, Phys. Rev. B 49, 8901 (1994).
- Johnston (1996) D. C. Johnston, Phys. Rev. B 54, 13009 (1996).
- Note (1) In specifying in the paper we leave out the unit Tesla/Kelvin, i.e. should be read as .
- Mizuno et al. (1998) Y. Mizuno, T. Tohyama, and S. Maekawa, Phys. Rev. B 58, R14713 (1998).
- (28) “OpenMPI,” Http://www.open-mpi.org.
- Swendsen and Wang (1987) R. H. Swendsen and J.-S. Wang, Phys. Rev. Lett. 58, 86 (1987).
- Evertz (2003) H. Evertz, Adv. Phys. 52, 1 (2003).
- Evertz et al. (1993) H. G. Evertz, G. Lana, and M. Marcu, Phys. Rev. Lett. 70, 875 (1993).
- Syljuåsen and Sandvik (2002) O. F. Syljuåsen and A. W. Sandvik, Phys. Rev. E 66, 046701 (2002).
- Note (2) Potential additional cyclic couplings Calzado et al. (2003) are not accessible by QMC calculations because of a severe sign problem.
- Dagotto and Rice (1996) E. Dagotto and T. M. Rice, Science 271, 618 (1996).
- Miyazaki et al. (1997) T. Miyazaki, M. Troyer, M. Ogata, K. Ueda, and D. Yoshioka, J. Phys. Soc. Jpn. 66, 2580 (1997).
- Sigrist and Furusaki (1996) M. Sigrist and A. Furusaki, J. Phys. Soc. Jpn. 65, 2385 (1996).
- Imada and Iino (1997) M. Imada and Y. Iino, J. Phys. Soc. Jpn. 66, 568 (1997).
- Anfuso and Eggert (2006) F. Anfuso and S. Eggert, (Europhys. Lett.) 73, 271 (2006).
- Sirker (2009) J. Sirker, Cond. Matt. Phys. 12, 449 (2009).
- Tedoldi et al. (1999) F. Tedoldi, R. Santachiara, and M. Horvatić, Phys. Rev. Lett. 83, 412 (1999).
- Calzado et al. (2003) C. J. Calzado, C. de Graaf, E. Bordas, R. Caballol, and J.-P. Malrieu, Physical Review B 67, 132409 (2003).