Variability in Spectropolarimetric properties of Sy 1.5 galaxy Mrk 6
Abstract
Here we present an analysis of spectro-polarimetric observations of type 1.5 AGN Mrk 6, performed with 6m telescope SAO RAN in 12 epochs (2010 – 2013). Additionally, the inter-stellar mater (ISM) polarization has been observed and its contribution to the AGN spectral polarization is taken into account.
We measured Stokes parameters and determined the polarization parameters in 12 spectra with and without correction for the ISM polarization. We estimated the time lag between the unpolarized and polarized continuum flux variation of about days, that indicates a compact scattering region which contributes to the polarized continuum variability. The polarization in H is complex, showing three prominent components in the BLR, one redshifted around +3000 kms-1 that corresponds to the red shoulder in H, and two blue-shifted around -2000 kms-1 and -6000 kms-1.
We found that the ISM polarization has a very significant influence on the measured AGN polarization parameters. After correcting the observations for the ISM polarization we were able to detect the Keplerian motion in the BLR.
We give a new method for the black hole mass estimation using spectro-polarimetric observation in the line profile, finding the black hole mass in Mrk 6 of , that is in a good agreement with reverberation estimates.
keywords:
galaxies: active – galaxies: quasar: individual: Mrk61 Introduction
Spectropolarimetry is a powerful tool for probing the innermost part of Active Galactic Nuclei (AGNs), since polarized light provides information about the radiation that is coming from the center of an AGN and from the scattering region assumed to be between the central source and observer. Therefore, Spectropolarimetric observations have been very important in studying the AGN inner structure, especially after the discovery of the hidden polarized broad-line emission in a Seyfert 2 galaxy NGC 1068 (Antonucci & Miller, 1985).
This discovery has proved that AGNs type 1 and 2 are intrinsically the same type of objects, but viewed from different orientations, i.e. in type 2 galaxies, the direct view of the active nucleus is blocked by the optically and geometrically thick torus of molecular gas and dust (Antonucci, 1993). Subsequently, many other type 2 AGNs have been observed to have polarized broad lines (see e.g. Miller & Goodrich, 1990; Tran et al., 1992; Young et al., 1996; Heisler et al., 1997; Tran, 2001; Kishimoto et al., 2002a, b; Lumsden et al., 2004, etc.)
On the other hand, for broad-line AGNs such as Seyfert 1 galaxies, an analysis of the polarization structure across the broad line profiles can potentially give information on the geometry of the broad-line region (BLR). Moreover, there is a possibility to investigate the polarization mechanisms across its velocity field (Martel, 1998).
It is shown by Goodrich & Miller (1994) that the polarization of broad lines is roughly similar to the continuum polarization, supporting the idea that the polarization has been due to scattering. The investigations of the properties of the polarized light in the AGN with broad lines (Smith et al., 2002, 2004, 2005; Goosmann & Gaskell, 2007) have shown that the broad line emission originates in a rotating disc and it is scattered by material in either the equatorial plane of the disc or orthogonal to it, the so-called equatorial and polar scattering models (see Smith et al., 2002, 2004, 2005; Goosmann & Gaskell, 2007, and references therein)111 Note here, that in some case of type 1 AGNs, the polarization of the broad lines almost completely vanishes (see e.g. Kishimoto et al., 2008). Additionally, the synchrotron radiation also may contribute to the optical polarization in radio-loud type 1 AGNs similar as in the case of blazars (see e.g. Giannuzzo & Salvati, 1993).
The variability in the polarized light is of a particular interest, since a time-dependent variation of the polarized broad line flux and profile as well as correlation between the polarized and unpolarized continuum and broad lines can give more information about the innermost structure of type 1 AGNs. Actually, variability studies such as reverberation mapping might not be completely convincing, since they only consider the total line and continuum flux, but not potentially valuable information from polarized light. Note here that a convincing and self-consistent BLR model has to account for the broad-line profile variability and the variability in both flux and polarization, and continuum-line responses in both polarized and unpolarized light (see e.g Gaskell, 2009). In this context Martel (1998) analyzed high S/N ratio polarized spectra of NGC 4151 observed in two epochs, and found correlations between the scattering axes of the different parts of the broad H line profile and the morphological axes of the host galaxy. The author noted that a full three-dimensional model of the BLR of NGC 4151 will require higher S/N ratio spectropolarimetry with more frequent time sampling. Also, recently Gaskell et al. (2012) investigated long-term variability in the polarized continuum of NGC 4151 and found that the polarized flux of NGC 4151 appears to lag the unpolarized flux by 8 days which is comparable to the light-crossing time of the BLR and that the dust in the torus is ruled out as the source of polarization in the continuum.
We present the spectropolarimetric observations (monitoring) of Mrk 6 in more than two year period, from 2010 to 2013 (12 spectra) in the optical spectral range (covering the H and H wavelength region). Mrk 6 (IC 450) is a Seyfert 1.5 galaxy (z=0.0185, m(B)=14.29, M(B)=-20.41) that has been observed in the frame of the Spectropolarimetric monitoring campaign of AGN with the 6-m BTA Telescope (Afanasiev et al., 2011) Mrk 6 is a good candidate for studying continuum and line polarization structure variation, since it is a bright object with the significant variability in broad emission lines and with the BLR that most-likely has a complex geometry, structure and kinematics (Rosenblatt et al., 1994; Eracleous & Halpern, 1993; Smith et al., 2002; Doroshenko & Sergeev, 2003). Previous optical monitoring has shown that the continuum and broad Balmer lines are strongly variable (Eracleous & Halpern, 1993; Sergeev et al., 1999; Doroshenko & Sergeev, 2003; Doroshenko et al., 2012), and the strong blue asymmetry is seen in Balmer-emission lines (Eracleous & Halpern, 1993; Khachikian et al., 2011; Doroshenko et al., 2012). The analysis of the line profiles variability and time-lags gives that the BLR kinematics in Mrk 6 is a combination of Keplerian (disc-like) and infall gas motion (Doroshenko et al., 2012). Also, some signature of the outflowing dense hydrogen gas-cloud has been seen in Balmer-emission lines (Khachikian et al., 2011). This could be supported by the radio measurements as radio-jets have been observed in this object (Capetti et al., 1995). Recent VLA observations show spectacular radio structures (Kharb et al., 2006) on kpc-scales, that cannot be explained by super-winds ejected by a nuclear starburst, but most preferably by an episodically powered precessing jet that changes its orientation (Kharb et al., 2006). On the other hand, the X-ray observations favor the warm absorption model, where the absorbers are probably originating from the accretion disc wind (Schurch et al., 2006; Mingo et al., 2011). The Spectropolarimetric analysis of Mrk 6 shows that the broad line emission originates in a rotating disc, while the polarized emission can be described with the scattering in the equatorial plane (Smith et al., 2002, 2004).
The polarization in the continuum and broad lines can be caused by different mechanisms, first of all there is the intrinsic polarization caused by the geometry of the emitting region222 as e.g. disc like geometry of the BLR will have a small percent of polarization in difference with the case of a spherical BLR where we expect unpolarized light, after that light can be scattered in the polar and equatorial plane (Smith et al., 2005). These scatterings can be caused by a jet or outflowing gas, as well as by some gas in equatorial plane between the BLR and torus, and finally torus can be a source of scattering.
In this paper we analyze the spectrophotometric observations of Mrk 6 obtained in 12 epochs in order to constrain the continuum and BLR structure and nature of the scattering region. Additionally we discuss the observed variability in polarization in the frame of the unified model and complex AGN structure. The paper is organized as following: in §2 we describe observations and data reduction, in §3 the results of our analysis are given, in §4 we discuss results, and in §5 we outline our conclusions.

2 Observations and data reduction
2.1 Observations
The instruments and method of observation have been described in more details in Afanasiev & Amirkhanyan (2012), and here will not be repeated, only we give some basic and specific details of observations and data reductions.
Spectropolarimetric observations of Mrk 6 have been performed with 6m telescope of SAO RAN using the modified spectrograph SCORPIO (see in more details in Afanasiev & Moiseev, 2005, 2011) in the mode of spectro-polarimetry and polarimetry. The Wollaston prism has been used as an analyzer, which provides that, at the same time, the light beam from the source has been registered in two long-slit spectra (with a slit of 1-2′′ width and 120′′ height) which are perpendicular to each other in the polarization direction. Behind the slit, in the focal plane, the rotation super-achromatic plate with – phase has been installed (more detailed description of the instrument can be found in Afanasiev & Amirkhanyan, 2012).
We observed the spectra of Mrk 6 AGN and standard stars with the position of the analyzer in four different angles: 0, 45, 22.5 and 67.5 degrees. The polarization of standard stars (taken from Hsu & Breger (1982) and Schmidth et al. (1992)) was observed each night for two purposes: i) to control the instrumental polarization, and ii) to calibrate the polarized AGN spectra. Additionally, we observed non-polarized stars as spectro-photometric standards. We tested the instrumental polarization, and found that it is less than 0.05% .
The differences between our measurements of polarization standards and these in the catalogue were 0.1-0.2% for polarization and 2-4 degrees for the polarization angle.
In Table 1 the log of observations is given. The date of observations, Julian date, total exposure time, number of cycles, seeing, slit, mode and spectral resolution are listed in Table 1. We observed in three different modes, using gratings VPHG940 and VPHG1200 which covered the H and H wavelength ranges. Additionally we have observations of the ISM polarization with the filter V with (max) 5500Å. The number of cycles denotes a number of observations for each position angle in the phase plate or Polaroid, i.e. one cycle corresponds to the observations in all four above mentioned angles. The spectral resolutions given in Table 1 were estimated using the FWHM of the lines from the night-sky in the integral (AGN+night sky) spectra.
| Date obs. | JD | Total exp. | Num. | Seeing | Slit | Mode | Spectral |
|---|---|---|---|---|---|---|---|
| 240000+ | sec. | of cycles | arcsec | arcsec | resolution (Å) | ||
| 2010.11.05 | 55505 | 2400 | 5 | 2.5 | 2 | 1 | 7.5 |
| 2011.08.27 | 55800 | 3360 | 6 | 2 | 1 | 1 | 5.4 |
| 2011.11.21 | 55886 | 2400 | 5 | 1.2 | 1 | 1 | 5.2 |
| 2012.02.14 | 55971 | 3600 | 5 | 4 | 2 | 1 | 7.8 |
| 2012.04.21 | 56038 | 2880 | 6 | 1.5 | 2 | 1 | 7.9 |
| 2012.05.18 | 56065 | 2400 | 5 | 1.5 | 2 | 1 | 8.0 |
| 2012.08.25 | 56164 | 3360 | 7 | 1.1 | 1.5 | 1 | 6.5 |
| 2012.09.11 | 56182 | 2400 | 10 | 1.5 | 2 | 2 | 6.6 |
| 2012.09.14 | 56184 | 2400 | 10 | 1.5 | 2 | 1 | 7.5 |
| 2012.10.08 | 56208 | 3600 | 10 | 2.5 | 1 | 2 | 6.6 |
| 2012.11.12 | 56243 | 3360 | 7 | 1.1 | 2 | 1 | 7.8 |
| 2013.02.06 | 56328 | 900 | 10 | 1.5 | Image | 3 | - |
| 2013.02.08 | 56330 | 2400 | 10 | 1.5 | 2 | 1 | 8.1 |
Mode of observations:
1 – Wollastonphase plate /2grating VPHG1200, spectral coverage 3700-7300 Å
2 – Wollastonphase plate /2grating VPHG940, spectral coverage 3700-8400 Å
3 – Polaroidfilter V, (max) 5500Å, FWHM 850 Å
2.1.1 Polarization of the inter-stellar matter (ISM)
The observed linear polarization of an object is a vector composition of the ISM polarization and polarization of the object (in this case the Mrk 6 AGN), i.e. . The ISM polarization, as it is well known, is depending on the Galactic latitude and it has a strong changes in the rate of polarization and in the polarization angle on one degree scale on celestial sphere. That is connected with non homogeneous distribution of the ISM. In a number of papers, the ISM polarization has been taken into account as a function of the Galactic extinction E(B-V) for different latitudes as it is described in Serkowski et al. (1975). However, the problem with this method is that it does not take into account the direction of the ISM polarization vector, i.e. vector has direction and intensity and both quantities should be taken into account (see e.g. Kishimoto et al., 2004). Therefore, here we take into account the ISM polarization vector by measuring polarization of a number of stars around the AGN, that in principle represents the ISM polarization. For these observations we used the wide-field photometry (dichroic polaroid in the field with diameter of 6′), since within the range of 0.45-0.8 mkm a typical change in the ISM polarization is smaller than 10% from the maximum, i.e. for Galactic longitudes the estimate of wide-field is satisfactory for this purposes.
For the ISM polarization estimate we used dichroic polaroid with three fixed angles -60, 0 and 60 degrees, and with the 6′ field. We considered only bright surrounding stars within 3′ around Mrk 6 in the V filter. We found 14 brightest stars in the field and for each of them calculated parameters Q and U.333for detail procedure of polarization parameters calculation see Afanasiev & Amirkhanyan (2012).
In Fig. 1 we give histograms of our measurements. The estimates of the averaged polarization parameters of the ISM are: .
Note here that in the catalogue of Heiles (2000) the rate of ISM polarization is changing around 0.4-1.7% and angle of ISM polarization around 70-180∘ in the radius of 10∘, that is not in contradiction with our estimates.
2.1.2 Data reduction
The data reduction includes standard procedure for long-slit spectroscopy, bias, flat field, geometrical correction along the slit, correction of the spectral line curvature, the night-sky subtraction, spectral sensitivity of the instrument and spectral wavelength calibration. For the absolute flux calibration we used the fluxes of the [OIII]5007 and [SII]6717/31 spectral lines, taking the fluxes from Doroshenko et al. (2012) (for [OIII]5007 6.90.11, and for [SII]6717/31 1.610.09). From the long-slit spectra of the galaxy we extracted the spectra of the AGN. One can expect the contribution of the stellar radiation from the AGN Mrk 6 host galaxy, but our estimate of this contribution shows that the host galaxy is depolarizing the AGN continuum radiation (around %).

We integrated spectra along the slit, since the procedure of decomposition (of the observed light as a function of wavelength along the slit) of the host galaxy and AGN increases the statistical errors. For the estimates of the Stokes parameters ( and ), and consequently the linear polarization percentage () and polarization angle (), we calculated for each spectral channel
where is the ordinary, and the extraordinary intensity measured in different angles of -phase plate (0, 45, 22.5 and 67.5 degrees). After that we found the Stokes parameters as:
and
Then we calculated and as:
The method of the calculation of polarization parameters is, in more details, given in Afanasiev & Amirkhanyan (2012). Note here that in the reduction we did not take into account cosmic rays and different types of smoothing or using the optimal aperture photometry, since all of these algorithms (procedures) can influence on the appearance of an artificial instrumental polarization. In further analysis, the polarization parameters ( and ) have been robustly estimated as average in a spectral window of Å for all cycles of measurements, the number of the windows for different observation data are between 5 and 10. This type of measurements gives a good estimate of statistical errors of the measured parameters. An example of the Mrk 6 polarized spectrum is present in Fig. 2, where the measurements of Stokes parameters, the percentage of the linear polarization and the angle of the polarization are shown. In Fig. 2 thin lines denote observed spectra without the correction of the ISM polarization, and thick lines the data after the correction of the ISM polarization. In Table 2 we give polarization parameters with and without the correction of the ISM polarization and further in the text we will use corrected polarization parameters.
As one can see from Table 2, the ISM polarization can significantly affect the polarization parameters, especially in the case where the polarization rate is not high (as it is usual for type 1 AGNs). The difference between the rate of polarization in the spectrum with and without correction on the ISM polarization can be almost 100% and difference in the polarization angle around 40-50 degrees. We should mention here that other methods can be used for the ISM polarization correction, as e.g. a correction of the ISM polarization using (see e.g. Kishimoto et al., 2002a) where the contribution ISM polarization have to be compared in the QU diagram for expected values of the ISM polarization (defined by ). However, we performed a direct measurement of the ISM polarization from the stars around Mkn 6, that allows us a simple vector subtraction for the ISM polarization correction.

| JD | Flux(5100) | Flux H | ||||||
|---|---|---|---|---|---|---|---|---|
| 240000+ | 180 | |||||||
| 55505 | 9.590.44 | 2.320.28 | 0.380.13 | -0.510.11 | 0.670.17 | 153.34.8 | 0.510.17 | 8.04.8 |
| 55800 | 9.570.18 | 2.610.29 | 0.450.20 | -0.660.15 | 0.950.15 | 150.54.3 | 0.560.25 | -0.57.1 |
| 55886 | 10.010.15 | 2.820.31 | 0.480.30 | -0.640.31 | 0.980.41 | 149.78.6 | 0.590.23 | 0.58.6 |
| 55971 | 9.180.43 | 2.460.06 | 0.520.10 | -0.920.11 | 1.070.12 | 150.14.4 | 0.680.16 | -10.54.4 |
| 56038 | 8.260.31 | 2.400.25 | 0.200.13 | -0.470.13 | 0.530.18 | 147.85.2 | 0.360.18 | 15.15.2 |
| 56065 | 7.960.32 | 2.330.19 | 0.040.09 | -0.630.13 | 0.650.16 | 136.94.5 | 0.150.16 | 3.84.5 |
| 56164 | 8.130.26 | 2.520.29 | 0.050.21 | -0.700.24 | 0.760.32 | 137.39.0 | 0.170.32 | -8.79.0 |
| 56182 | 9.180.28 | 2.430.19 | 0.730.15 | 0.220.12 | 0.780.19 | 188.55.4 | 1.210.19 | 23.05.4 |
| 56184 | 9.780.37 | 2.530.04 | 0.700.12 | 0.270.11 | 0.760.16 | 190.5.6 | 1.230.16 | 24.34.6 |
| 56208 | 9.990.17 | 2.680.09 | 0.520.19 | 0.090.17 | 0.560.25 | 185.67.2 | 0.970.25 | 24.87.2 |
| 56243 | 8.010.54 | 2.690.08 | 0.630.15 | -0.990.07 | 1.200.23 | 151.46.4 | 0.810.17 | -12.34.7 |
| 56330 | 8.980.38 | 2.440.25 | 0.630.14 | -0.590.10 | 0.880.17 | 158.34.9 | 0.740.17 | 2.34.9 |
UNITS: Flux(5100) in , Flux H in ; and in percents; in degrees


3 Results
The observed spectra of Mrk 6 covered the broad H and H emission lines. The broad lines showing an asymmetric profiles and strong narrow emission lines (see Fig 2, first panel) are present in the spectra. As one can see from Fig. 2 the in the Stokes parameters is significantly higher in H than in H, therefore we measured polarization data for H. In Table 2 we give the measured flux (in the line and in the continuum at 5100 Å rest wavelength) and corresponding polarization parameters – the observed ( and ), and corrected for the ISM polarization ( and ). As we noted above, the ISM polarization has a significant influence on the measured AGN polarization parameters.
3.1 Polarization in the continuum
The continuum of Mrk 6 is polarized on the level of 0.5% (see Fig. 2 and Table 2), i.e. during the monitoring period the continuum polarization was changing between 0.15% and 1%, and angle between 170∘ to 200∘. The variability of the continuum, H line, the polarized continuum and the polarization parameters from JD2455505 (Nov. 2010) to JD2456330 (Feb. 2013) are present in Fig. 3. As it can be seen from Fig. 3 the variation in the polarized continuum nearly follows the variation in the unpolarized one. The continuum at 5100 Å (rest wavelength) changed for about 1.5 times, while the line flux was changing with a smaller amplitude than the continuum one. It seems that the polarized continuum flux has a higher amplitude of the variation that the unpolarized one. There is a high change in 2012 in both, the polarization (4th panel in Fig. 3) and in the polarization angle (5th panel in Fig. 3). The polarization angle of the continuum is nearly following the jet orientation, however in the active phase the angle is changing for around 20-30 degrees.
To estimate the dimension of the scattering region we cross correlated the unpolarized continuum with polarized one. For this purpose we used a very simple method, first we interpolated the light curves in the unpolarized and polarized continuum (as well as in the H line), after that we use the cross correlation function (CCF) and found a lag between the unpolarized and polarized continuum of 1.6 days. Also, we cross correlated the unpolarized continuum and H (see Fig. 4) and found a lag of 20.3 days that is in a good agreement with the estimate given by Doroshenko et al. (2012). They found the H lag of 27 days. Note here that the time lags we measured for the polarized continuum and the BLR are shorter than the overall time sampling of the light curves, that is a general problem in the reverberation method (see e.g. Shapovalova et al., 2013), but generally the CCF method gives more-less reasonable lag values and as we can see in Fig. 4 there is a sharp peak in the CCF between of the non-polarized and polarized continuum lag. Moreover, our estimate for the H lag is in a good agreement with the reverberation estimate given by Doroshenko et al. (2012), that is in favor of the used method.
Such a small lag between the unpolarized and polarized continuum rules out scattering in the torus of Mrk 6, it seems that the scattering region is not so far from the BLR, and that it is more compact than the BLR. Probably the scattering has some connection with the jet, or/and outflow that is nearly to the jet direction. This confirms Fig. 5, where in the UQ space the measured points are presented with also the projection of the jet (the jet angle is taken from (Capetti et al., 1995) which projection on the UQ space is presented with the arrow in Fig. 5)444 Note here that the jet direction in Fig. 5 corresponds to angle (i.e. 340∘), since we take that in the plane the angle of the jet projection is . The measured points are very close to the projected jet direction in the UQ space, but during outbursts, there is a drift that is nearly perpendicular to the jet direction in the UQ space. The size of circles corresponds to the intensity of the continuum (bigger circles – higher continuum flux), and it seems that the largest differences between polarization parameters and jet projection are in the active AGN phase (see Fig. 5),


3.2 Polarization of the BLR light
As it can be seen in Fig. 3, the total flux of H varied with a smaller amplitude than the continuum, and it seems that there is no big change in the line profile in more than the 2-years period.
In order to investigate the polarization of the BLR light, we investigated the polarization and polarization angle across only the broad H profile, since, as it was mentioned above, the S/N is higher in H than in H. An inspection of the polarized Mrk 6 spectra shows that from 12 H spectra, two of them are with a lower S/N, therefore in the further analysis of the broad line polarization we use ten H spectra with a good resolution.
The first step in our analysis was to subtract all narrow lines and obtain only the broad component of H. This was done using the standard techniques of the multi-Gaussian decomposition (for details see e.g. Popović et al., 2004). The decomposed H profile is shown in Fig. 6. As it can be seen in Fig. 6 the line profile is very complex and can be fitted with four broad Gaussian functions. The broad line profile has a big red asymmetry (see Fig.7 - bottom), but the intensive blue peak (located at 2000 is prominent in the line profile (see Figs. 6 and 7).
The observed shape of the polarization and polarization angle as a function of wavelengths in the H line profile depend on the geometry and kinematics in the BLR. One can expect that the polarization across the line profile is caused by the equatorial scattering in the inner part of a dusty torus (see e.g. Smith et al., 2005). As it was mentioned above, the polarization of the continuum emission is probably caused by scatter in the inner part of the BLR (in the accretion disk and/or jet). Therefore, to consider the polarization only in the broad line one should subtract the observed continuum polarization. Therefore, to find polarization in the broad line we performed following procedure: First we take into account the ISM polarization in Stokes parameters and , after that we multiplied and by total line flux; Finally, from these parameters ( and ) we subtracted the polarization parameters of the continuum.
The polarization and polarization angle across the line profile are shown in Fig. 7. The measurements of the broad line polarized flux, especially in the line wings (where 0.7, see Simmons & Stewart, 1985), is subject to bias. In order to avoid the bias problem in the degree of the broad line polarization for small values of polarized flux in the line, we assumed that for the far wings ( and ) the line flux is on the zero-scale, therefore the degree of the polarization and polarization angle for this, extreme, velocities are on the zero-scale. For rest of the measurements (in the velocity interval from -9000 to +9000 ) we calculated as and and plot in Fig. 7. As it can be seen in Fig. 7 the is enough large in the considered velocity interval that cannot be significantly affected by bias.
It is interesting that polarization has three peaks, one around -6000 (bump B), second around -2000 (bump A) and third around +3000 (bump C in Fig.7). The dashed line in Fig. 7 corresponds to the zero scale of polarization angle () and the disc component, that shows smaller rate of polarization. Such a complex polarization shape in the line profile indicates a complex picture of polarization of the BLR light. The redshifted (+3000 kms-1) corresponds to the red shoulder in the H wing, and the blue-shifted (-2000 kms-1) to the blue peak in the broad H line profile (see Fig. 7). These two components seems to be with the nearly same offset from the zero-scale of the polarization angle (dashed line in Fig. 7). The component with the peak at -6000 kms-1 cannot be seen in the line profile, and may indicate outflowing gas in the central part of the BLR. The most interesting is the shape of as a function of the velocity; the shape nearly follows one expected in the BLR with the predominant Keplerian motion and zero point is shifted to the red (+1000 ).

In Fig. 7 we presented also rms of p, and normalized line profile555The broad lines are normalized to the corresponding total line flux, and there is no big change in the profile of H line as well as in the shape of polarization parameters.
To explore variability in a longer period, we compared our observations (corrected on ISM polarization) with ones given in Smith et al. (2002) (seen Fig.8)666Note here that we digitized the Smith et al. (2002) data and applied the same procedure for ISM polarization corrections as in our data, see §2. As it can be seen in Fig. 8 there are significant changes in the H line profile, as well as in the polarization parameters. The broad line profile observed in 1999 also can be fitted with four broad components, but the blue peak in the line profile is more intensive in our than in observations of Smith et al. (2002). The polarization in the red part observed in 2012 is significantly smaller than in the 1999 observations as well as zero velocity depolarization. It is interesting that in previous observation the of the continuum is practically the same as in our one, and also the function vs. velocity stays nearly the same as our, also indicating a Keplerian motion in the BLR (see Smith et al., 2005).

3.2.1 The complex BLR or/and scattering region
As it can be seen in Fig. 7, three prominent peaks are located in the polarization of the H line. To clarify the nature of the BLR and scattering region, we transformed the parameter (vector) to the radio-jet direction, ( is perpendicular to the vector direction) and plotted Q and U parameters (upper panel in Fig. 9) and the projection of velocities along the H profile on the UQ space (bottom panel). In Fig. 9 we divided the points according the velocities, first of all from the bumps which can be seen in Fig. 7, and taking that velocities from -1000 km to +2000 km correspond to the velocities of the Keplerian motion in the disc (denoted as open and full circles). It is very interesting that on the transformed UQ surface, there is a clear separation between points (velocities) seen in different bumps. The Keplerian disc space is projected nearly on a circular surface, where one axis is nearly parallel to the radio-jet direction (arrow on the plot) and approximately separated the points with receding (full circles) and approaching (open circles) velocities. The space of the Keplerian disc is with smaller velocities (between -1000 km and +2000 km ), while the components A and C are with higher velocities and they are well separated. As we noted above these two components corresponds to the blue peak and red shoulder in the H line profile, which are expected in a line emitted from a relativistic disc, i.e. in orbits closer to the central black hole (effects of the Doppler boosting and gravitational redshift). It can be seen in Fig. 9 that the component C has points that are located in the UQ space with , similar as receding part of Keplerian disc (full circles), while A has points with as the points from approaching side of the Keplerian disc. These may indicate that the components A and C are coming from the non-Keplerian part of the disc (closer to the central black hole). On the other hand, the component B, that cannot be seen in the H broad line profile, has points that nearly follow axis that may indicate high-speed outflow (around -6000 km ), in the inner part of the BLR777 The negative velocities in this polarized component indicate an amount of approaching gas, that may be outflowing material that has the near radio-jet direction.
3.3 Central part of Mrk 6: BLR gas motion and black hole mass
3.3.1 Observational evidence of the Keplerian motion in the BLR
Assuming that the vs. velocity dependence is caused by only the velocity field in the BLR (Smith et al., 2005), we are able to explore the kinematics of the emission gas in the BLR. We should mention here, that in the estimation of an AGN black hole mass, an assumption of the Keplerian motion in the BLR is a-priori accepted (Peterson, 2013), but there is a few observational indication that this motion is dominant in the BLR.
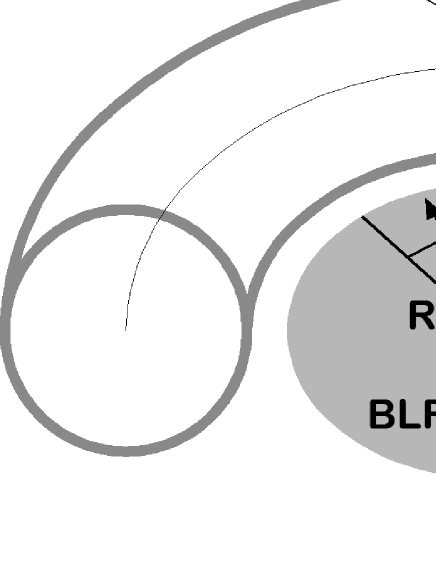
If we assume that a predominant Keplerian motion is in the BLR of Mrk 6, then observed velocities , in each part of the rotating disc, are depending only from the distance from the central black hole (with mass ). An illustration of the equatorial scattering on the torus of the emission from the Keplerian disc is given in Fig. 10. The projected velocity in the plane of the scattering region is:
where is the gravitational constant and is the angle between the disc and polarization plane (see Fig. 10). In the case of the equatorial polarization, can be connected with the corresponding polarization angle (see Fig.10) :
where is the distance from the center of the disc to the scattering region.
Taking into account the polarization angle of different parts of the disc (, see Fig. 10), Eq. 1 can be rewritten as:
where is the velocity of light, the constant is
In the case of the Keplerian motion .
The best fitting of vs. , shown in Fig. 11 with the solid line, gives (that is practically ). This is the evidence that the Keplerian motion is predominant one in the BLR of Mrk 6.

3.3.2 Estimation of the black hole mass
There are several methods for the super-massive black hole mass estimation (see in more details Peterson, 2013, and references therein), but spectro-polarometric observations have not be considered so far for this task. However, the shape of the polarization angle as a function of velocities (see Eq. 3) can also be used, at least, for rough mass estimation. From Eq. 4, the mass of black hole can be calculated as:
where is in light days.
From the best fit we found , that is used for estimation of the central black hole. As it can be seen the mass is depending on the distance of the scattering region () from the center of the disc. Assuming that the scattering region is located in the inner part of the torus, one can use the dimension of the Mrk 6 inner radius of the torus as 0.180.05 pc or 22060 light days (estimated using radiation at 2.2 microns, see Kishimoto et al., 2011). Taking (the scattering region is in the same plane as the disc), we obtained . In the general case, the angle since the scattering region is in the torus with a thickness, therefore, we estimated a low limit of the BH mass. The estimated mass is in a good agreement with ones given by Grier et al. (2012) and Doroshenko et al. (2012), who obtained 1.3 and 1.8,respectively.
4 Discussion
Mrk 6 is an AGN with broad lines, i.e. belongs to type 1 objects. In those objects, the line of sight of an observer has a direct view of the bright nuclear region that is inside of the torus. This allows that different nuclear polarization in the continuum components may dominate.
In type 1 objects the optical continuum is often polarized at P1% level, with that is parallel to the jet axis (see e.g. Berriman et al., 1990). The observed polarization in Mrk 6 very well fits this general picture, since the level of the continuum polarization is around %, and as it can be seen in Fig. 5, the polarization angle, in non-active state of the AGN. follows the radio jet direction. The variation observed in the polarization of the continuum (p and ) is caused by additional polarization effects. The change in the polarization parameters is connected with the variation in brightness of the continuum (see Figs. 3 and 5), and it may be connected with some changes in the jet, since there is a change, not only in the percentage of polarization, but also in the polarization angle (). In a such scenario, the polarization in the continuum has two components, the first one, that is dominant and expected component parallel to the jet, that does not show strong changes. The second component might be connected with the jet, or outflowing material that is very compact ( light days) and produce variability in the polarization parameters. However, looking at SED of Mrk 6 (using NED database) and comparing with SED of the generic blazar spectrum (see Sanders et al., 1989) it seems that extrapolated radio flux is too low to explain the optical polarization. On the other hand we cannot exclude the possibility that this (variable) fraction of the continuum is coming from some kind of outflowing material, or that scattering of the continuum light is partly occurring on material in jet-like structure. Note here that the existence of large and complex radio structures in Mrk 6 may be explained as a result of an episodically powered precessing jet that changes its orientation (Kharb et al., 2006), and such precession can produce the variation in the polarization parameters.
The broad lines in type 1 AGNs are often polarized, but at lower and at different polarization angle than the continuum (see; e.g. Smith et al., 2004). Also, the H line polarization is following this rule, but, as it can be seen in Fig. 7, there are three peaks indicating more complex broad line emitting region. It seems that the BLR kinematics is complex, but the Keplerian motion of the emission gas in a rotating disc is predominant.
Basically, the polarization in the Mrk 6 H line follows the trend seen in type 1 object (Smith et al., 2005), that implies that the scattering region is equatorial in shape. The parallel polarization observed in Mrk 6 (), quite possibly indicates that the scattering region is in a flattened/equatorial optically-thin geometry having its symmetry axis along the jet direction. The shift in the zero of the H polarization angle (with respect to the continuum polarization, see Fig. 7) of +1000 km may be caused by two effects: 1) the outflowing scattering region, and 2) the inflowing disc due to the accreating velocity to the center of the central black hole. Both of these effects are able to shift the zero line polarization angle to the red velocities.
The most interesting result is that the function of vs. velocity is following the shape expected in the case of the Keplerian motion in the disc, and it is a strong evidence of the Keplerian motion in the BLR of Mrk 6. Using this fact we estimated the low limit of the black hole mass, and this estimate is in a good agreement with ones obtained from the reverberation mapping.
5 Conclusion
Here we presented spectro-polarization observations of Mrk 6, obtained in more than 2-years period. Also, we observed and estimated contribution of the ISM polarization to the observed Mrk 6 polarization. We measured polarization parameters for the continuum at 5100 Å (rest wavelength) and H line and explore the lag between the unpolarized and polarized flux. On the basis of our investigation we can outline following conclusions:
i) The ISM polarization has a significant contribution to the observed Mrk 6 polarization. Therefore, it is important, not only in this AGN, but in general to observe and take into account the ISM polarization. It should be considered that the ISM can affect not only the degree of polarization, but also the polarization angle.
ii) We found that the variability in the polarized continuum follows the variability in unpolarized one, and that the lag is days, that is ten times smaller than the estimated BLR dimension of days. This implies that the scattering region of the continuum is complex, and it seems to have a part where the vector of polarization is with the angle of 180∘, and another scattering region that contributes to the variation which my be some kind of outflowing scattering material.
iii) During the monitoring period, the H line profile, as well as H polarization parameters have not changed significantly. The polarization shape (as a function of wavelengths) has three bumps, where one (the most intensive and blue-shifted) probably is coming from the outflow in the inner part of the BLR. On the other hand, rest two bumps (shifted to the blue and red), which correspond to the blue peak and red shoulder in the broad line profile, are probably coming from relativistic part of the accretion disc.
iv) Comparing our observations with those performed by Smith et al. (2002), we found that the line profile of the H and its polarization parameters are significantly changed in a long time period. The polarization angle as a function of velocity across the line profile save the same trend, and the zero scale of the polarization in angle shows a redshift of +1000 km , that may be caused by two effects: inflowing accreating gas in the disc, and outflowing scattering region.
v) We give an observational evidence for the Keplerian motion in the BLR of Mrk 6. Using spectro-polarimetric observations we roughly estimated the black hole mas as , that is a low limit of mass. However our estimate is in a good agreement with ones obtained by reverberation ().
Here we give the observational facts with a simple calculation to give very rough estimates, for a more sophisticated explanation of the observational data one should apply full theory of polarization that we postpone to the following paper (Afanasiev et al. 2012, in preparation).
Acknowledgments
The results of observations were obtained with the 6-m BTA telescope of the Special Astrophysical Observatory Academy of Sciences, operating with the financial support of the Ministry of Education and Science of Russian Federation (state contracts no. 16.552.11.7028, 16.518.11.7073).The authors also express appreciation to the Large Telescope Program Committee of the RAS for the possibility of implementing the program of Spectropolarimetric observations at the BTA. This work was supported of the Russian Foundation for Basic Research (project N12-02-00857) and the Ministry of Education and Science (Republic of Serbia) through the project Astrophysical Spectroscopy of Extragalactic Objects (176001). We would like to thank to Prof. Makoto Kishimoto for very useful comments and suggestions. L.Č. Popović thanks to the COST Action MP1104 ’Polarization as a tool to study the Solar System and beyond’ for support.
References
- Afanasiev & Amirkhanyan (2012) Afanasiev, V. L., Amirkhanyan, V. R. 2012, AstBu, 67, 438.
- Afanasiev et al. (2011) Afanasiev, V. L., Borisov, N. V., Gnedin, Yu. N., et al. 2011, AstL, 37, 302
- Afanasiev & Moiseev (2005) Afanasiev, V. L. & Moiseev, A. V. 2005, Astronomy Letters, 31, 194
- Afanasiev & Moiseev (2011) Afanasiev, V. L. & Moiseev, A. V. 2011 Baltic Astronomy, Vol. 20, p. 363
- Antonucci (1993) Antonucci, R. R. J. 1993, ARA&A, 31, 473
- Antonucci & Miller (1985) Antonucci, R. R. J., & Miller, J. S. 1985, ApJ, 297, 621
- Berriman et al. (1990) Berriman G, Schmidt G D, West S C and Stockman H S 1990 ApJS 74 869
- Capetti et al. (1995) Capetti, A., Axon, D. J., Kukula, M., et al. 1995, ApJL, 454, L85
- Doroshenko & Sergeev (2003) Doroshenko, V. T., & Sergeev, S. G. 2003, A&A, 405, 909
- Doroshenko et al. (2012) Doroshenko, V. T., Sergeev, S. G., Klimanov, S. A., Pronik, V. I., & Efimov, Y. S. 2012, MNRAS, 426, 416
- Eracleous & Halpern (1993) Eracleous, M., & Halpern, J. P. 1993, ApJ, 409, 584
- Gaskell (2009) Gaskell, C. M. 2009, NewAR, 53, 140
- Gaskell et al. (2012) Gaskell, C. M., Goosmann, R. W., Merkulova, N. I., Shakhovskoy, N. M., Shoji, M. 2012, ApJ, 749, 148
- Giannuzzo & Salvati (1993) Giannuzzo, E. & Salvati, M. 1993, A&A, 272, 411
- Goodrich & Miller (1994) Goodrich, R. W., & Miller, J. S. 1994, ApJ, 434, 82
- Goosmann & Gaskell (2007) Goosmann, R. W. & Gaskell, C. M. 2007, A&A, 465, 129
- Grier et al. (2012) Grier, C. J., Peterson, B. M., Pogge, R. W. et al. 2012, ApJ, 755, 60
- Heiles (2000) Heiles, C., 2000, AJ, 119, 923
- Heisler et al. (1997) Heisler, C. A., Lumsden, S. L., & Bailey, J. A. 1997, Nature, 385, 700
- Hsu & Breger (1982) Hsu, J. & Breger, M.. 1982, AJ, .262, 732
- Khachikian et al. (2011) Khachikian, E. Y., Asatrian, N. S., & Burenkov, A. N. 2011, Astrophysics, 54, 26
- Kharb et al. (2006) Kharb, P., O’Dea, C. P., Baum, S. A., Colbert, E. J. M., & Xu, C. 2006, ApJ, 652, 177
- Kishimoto et al. (2008) Kishimoto, M., Antonucci, R., Blaes, O., Lawrence, A., Boisson, C., Albrecht, M., Leipski, C. 2008, JPhCS, 131, a2039
- Kishimoto et al. (2004) Kishimoto, M., Antonucci, R., Boisson, C., Blaes, O. 2004 MNRAS, 354, 1065
- Kishimoto et al. (2002a) Kishimoto, M., Kay, L. E., Antonucci, R., Hurt, T, W., Cohen, R. D., Krolik, J. H. 2002a, ApJ, 565, 155
- Kishimoto et al. (2002b) Kishimoto, M., Kay, L. E., Antonucci, R., Hurt, T, W., Cohen, R. D., Krolik, J. H. 2002b, ApJ, 567, 790
- Kishimoto et al. (2011) Kishimoto, M., Honig S. F.,Antonucci R., Barvainis R., Kotani T., Tristram K. R. W., Weigelt G., and Levin K., 2011, A&A, 527, A121
- Lumsden et al. (2004) Lumsden, S. L., Alexander, D. M., Hough, J. H. 2004, MNRAS, 348,1451
- Martel (1998) Martel, A. R. 1998, ApJ, 508, 657
- Miller & Goodrich (1990) Miller, J. S., & Goodrich, R. W. 1990, ApJ, 355, 456
- Mingo et al. (2011) Mingo, B., Hardcastle, M. J., Croston, J. H., et al. 2011, ApJ, 731, 21
- Peterson (2013) Peterson, B. M. 2013, SSRv, accepted
- Popović et al. (2004) Popović, L. Č., Mediavilla, E., Bon, E., & Ilić, D. 2004, A&A, 423, 909
- Rosenblatt et al. (1994) Rosenblatt, E. I., Malkan, M. A., Sargent, W. L. W., & Readhead, A. C. S. 1994, ApJS, 93, 73
- Sanders et al. (1989) Sanders, D. B., Phinney, E. S., Neugebauer, G., Soifer, B. T., Matthews, K. 1989, ApJ, 347, 29S
- Schmidth et al. (1992) Schmidth, G.D. at al, 1992, ApJ, 104, 1563
- Schurch et al. (2006) Schurch, N. J., Griffiths, R. E., & Warwick, R. S. 2006, MNRAS, 371, 211
- Shapovalova et al. (2013) Shapovalova, A. I., Popović, L. Č., Burenkov, A. N. et al. 2013, A&A, 559, A10
- Sergeev et al. (1999) Sergeev, S. G., Pronik, V. I., Sergeeva, E. A., & Malkov, Y. F. 1999, ApJS, 121, 159
- Serkowski et al. (1975) Serkowski K., Mthewson D.S., Ford V.L., 1975, ApJ, 196, 261
- Simmons & Stewart (1985) Simmons, J. F. L., Stewart, B. G. 1985,A&A, 142, 100
- Smith et al. (2002) Smith, J. E., Young, S., Robinson, A., et al. 2002, MNRAS, 335, 773
- Smith et al. (2004) Smith, J. E., Robinson, A., Alexander, D. M., et al. 2004, MNRAS, 350, 140
- Smith et al. (2005) Smith, J. E., Robinson, A., Young, S., et al. 2005, MNRAS, 359, 846
- Tran (2001) Tran, H. D. 2001, ApJ, 554, L19
- Tran et al. (1992) Tran, H. D., Miller, J. S., & Kay, L. E. 1992, ApJ, 397, 452
- Young et al. (1996) Young, S.; Hough, J. H., Axon, D. J., Ward, M. J., Bailey, J. A. 1996, 1996, MNRAS, 280, 291