Theory of melting at high pressures: Amending Density Functional Theory with Quantum Monte Carlo
Abstract
We present an improved first-principles description of melting under pressure based on thermodynamic integration comparing Density Functional Theory (DFT) and quantum Monte Carlo (QMC) treatments of the system. The method is applied to address the longstanding discrepancy between density functional theory (DFT) calculations and diamond anvil cell (DAC) experiments on the melting curve of xenon, a noble gas solid where van der Waals binding is challenging for traditional DFT methods. The calculations show excellent agreement with data below 20 GPa and that the high-pressure melt curve is well described by a Lindemann behavior up to at least 80 GPa, a finding in stark contrast to DAC data.
pacs:
64.70.D-,62.50.-p,02.70.SsThe high pressure melt line of simple materials carries great significance in both purely theoretical and in practical applications. For instance, the rapid decrease followed by suspected increase in the melting temperature of lithium under pressure is a bellwether for the complex series of solid phases that exist at lower temperatures.Guillaume et al. (2011) Furthermore, the onset of melt triggers a dramatic loss of mechanical strength of a material, with significant changes in dynamic behavior following. In fact, the point where a material melts under shock compression is one of the key properties that can distinguish between possible scenarios for planetary accretion.Dahl and Stevenson (2010) Although diamond anvil cell (DAC) experiments remain the most versatile experimental technique for probing high pressure melting behavior, they have also been a source of controversy. Important examples exist in the literature of melt lines showing an anomalous change in slope under pressure that were contradicted by either shock experiments or later DAC experiments.Dewaele et al. (2010); Anzellini et al. (2013) An as yet unchallenged melt line of this type is exhibited by xenon and other noble gases - which are of particular importance due to their inert nature. The high pressure behavior of the noble gases is a fundamental test of the DAC methodology and as such deserves special scrutiny. In this letter, we specifically consider the behavior of xenon and find that the high-pressure melt curve is well described by a traditional melting curve.
As alluded to above, the experimentally obtained melting curve for xenon exhibits an interesting feature when probed in the diamond anvil cell, abruptly flattening out at pressures above 25 GPa.Ross et al. (2005). The observation prompted much theoretical attention, including applying quantum mechanical simulation techniques to the problem.Belonoshko et al. (2006) These techniques, lead by density functional theory (DFT), are uniquely suited to the study of extreme conditions as their fundamental approximations are not affected by the presence of temperature or pressure, if a calculation is accurate near ambient conditions, the method is also likely to be accurate at high pressure. DFT applied to xenon finds a Lindemann like melt curve in contrast to the experiments.Belonoshko et al. (2006)
The accuracy of DFT calculations of noble gases, however, is not to be taken for granted since fundamental uncertainties remain regarding calculations of systems where van der Waals interactions are significant. Standard semi-local functionals such as the local density approximation (LDA) tend to over-bind the noble gases due to a spurious self interaction of the electrons in regions of low density. Improved functionals such as AM05Armiento and Mattsson (2005) remove this self-interaction, but as a result do not bind noble gas solids at all. Despite much progress in the area of dispersion corrected density functional theory Andersson et al. (1996), cases involving the transition where dispersion dominated bonding gives way to covalent-or metallic bonding remains a challenge. Xenon presents a canonical example of this effect and as a result its behavior is greatly affected by pressure. Xenon turns metallic under moderate shock compressionNellis et al. (1982) and although xenon is a narrow-range cryogenic liquid at normal pressure with melting and boiling points of 161.4 K and 165.0 K, respectively, the melting point at 20 GPa is above 2500 K.
These significant theoretical challenges necessitate the application of a complementary technique whose approximations are not tied to the local behavior of the electrons. A promising candidate from this point of view is diffusion quantum Monte Carlo (DMC).Foulkes et al. (2001) Whereas the approximation made in DFT calculations requires the consideration of an effective Hamiltonian, DMC treats the Hamiltonian exactly. Therefore, DMC can accurately study van der Waals interactions and has been successfully applied to lighter noble gas solids Drummond and Needs (2006) and the interactions between filled shell molecules.Sorella et al. (2007); Beaudet et al. (2008)
In order to thoroughly investigate the performance of DMC for xenon, we focused on the three fundamental approximations that would be necessary in the calculations. These approximations are the pseudopotential approximation that is necessary for computational efficiency, the fixed node approximation which is necessary to mitigate the fermion sign problem, and the finite size approximation where calculations on modest sized supercells are used to determine properties xenon in the thermodynamic limit.
As a test of these approximations, the energy versus volume for the FCC crystal is used as a benchmark. Calculations of a 32 atom supercell, using the finite size correction methods employed in the rest of the paper with two different starting points are considered. Firstly pseudopotentials and nodal surfaces from the LDA are used as input to the DMC calculations. Then the processes is repeated with pseudopotentials and nodal surfaces from AM05, allowing a sensitivity test to the form of these approximations.
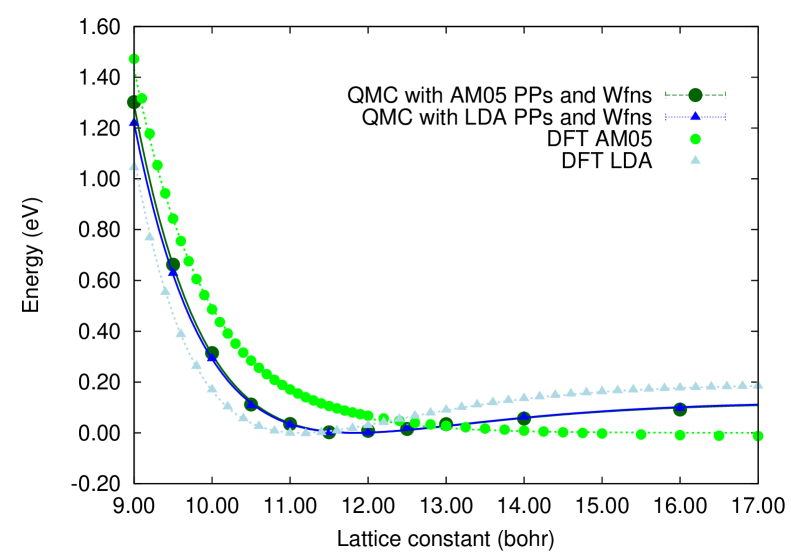
The results of this test are shown in Fig 1. We find that the DMC results are independent of the trial wavefunctions and pseudopotentials to the level required for this work. Fitting the DMC energy versus volume curve with a Vinet formVinet et al. (1986) gives a lattice constant varying by only when changing from LDA to AM05 trial wavefunctions and a bulk modulus varying by only . For this reason we conclude the errors arising from nodal and pseudopotential approximations are small for these DMC calculations of xenon.
Despite this evidence that DMC is ideally suited for the calculation of the properties of xenon under pressure, one important wrinkle remains. Direct calculations of melting are not currently feasible with DMC for anything beyond the lightest of elements. Fortunately, a solution to this problem has recently been proposed: thermodynamic integration can be used to connect the accuracy of the DMC calculations with the speed and efficiency of DFT based molecular dynamics.Sola and Alfè (2009) Using this technique, Sola and Alfé found that DMC calculations favored the solid phase in calculations of the melting of iron under pressure. This result was in disagreement with DAC experiments.Boehler (1993) A potential concern with this result is that QMC methods (both VMC and DMC) being variational tend to produce relatively lower total energies for more ordered states (in this case solids versus liquids). This effect is because the trial wavefunctions used tend to be rather simple compared to the true many body wavefunctions and typically do not increase in complexity for the less ordered phases. Thus simpler phases where the wavefunction is closer to the many body wavefunction tend to have a smaller positive fixed node error than that for a more complex phase.
In light of this and because the approach is new, we elected to null-test the method by calculating the melting temperature of aluminum at 120 GPa. This material and condition were chosen because shock experiments, diamond anvil cell experiments and DFT calculations all agree as to the melting temperatureBouchet et al. (2009). If the QMC free energies were biased towards the solid phase then the melting temperature would be overestimated using this method. Relative energies between the snapshots of the same phase for aluminum agreed very well between the DMC and DFT, giving confidence that the DFT dynamics were close to the DMC ones. Additionally, the shift in free energy between the solid and liquid was very small, meV/atom, leading to a temperature shift of only K. This result is well within the errors of the method and experimental accuracy for melting under pressure. Furthermore, this test shows that the thermodynamic integration method does not suffer from notable systematic errors when the DMC is performed with a relatively simple trial wavefunction.
In applying this approach to the melting of xenon we start by calculating the melting line at two points using DFT based molecular dynamics. Specifically following the work of Root et al.Root et al. (2010) we performed calculations using VASPKresse and Furthmuller (1996) within the AM05Armiento and Mattsson (2005) density functional. We used two-phase coexistence simulations to establish the relative free energies between the solid FCC and liquid phases of the xenon at high pressure. Two densities were selected for these simulations, 7.27 g/cc and 10.0 g/cc. These simulations were performed in both the NVE and NVT ensembles, using the consistency between the two to check that the technical parameters of the simulations were converged. Indeed, we found that for the higher density simulation, calculations with 214 xenon atoms found a melt temperature of 6000 K in the NVT ensemble, but the NVE yielded a lower value. This suggested that larger simulation cells were necessary and upon consideration of cells doubled in size in the direction perpendicular to the interface (428 atoms) the results agreed, yielding two points at which the Gibbs free energy of the two phases were equal: 24.4 GPa and 3000 K for 7.27 g/cc and 74.4 GPa and 5600 K for 10.0 g/cc.
From this foundation, we followed Sola and Alfé Sola and Alfè (2009) adding refinements to the methodology to further reduce the uncertainty. The change in free energy of a phase at a given temperature and pressure is calculated by taking snapshots from long DFT based molecular dynamics simulations and comparing the energy of those snapshots to energies from DMC calculations. Using this information, the change in the Helmholtz free energy of each phase is found using a perturbation series of cumulants in the energy difference as:
| (1) |
where the ’s are cumulants of the difference in internal energy between the DMC and DFT ensembles:
| (2) |
or directly in terms of the partition function
| (3) |
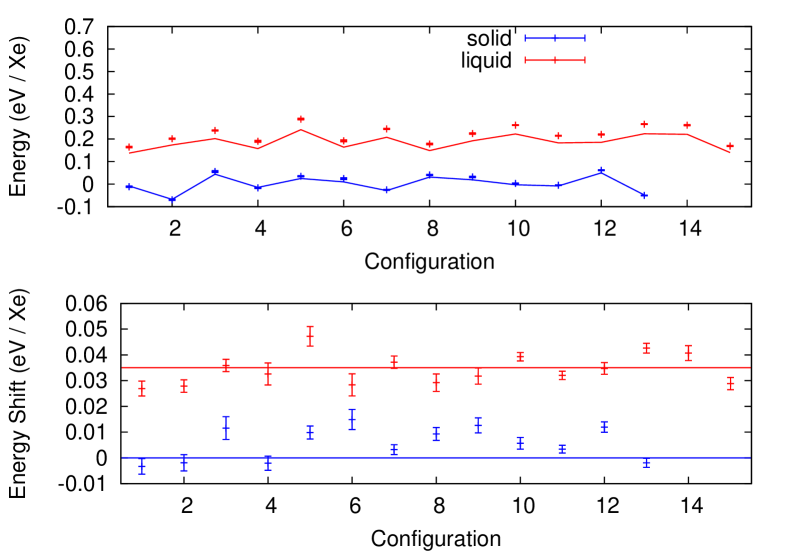
where with and the potential energies of the DMC and DFT systems respectively and represents the thermal average in the ensemble generated by the potential energy function . The approximation above is valid when and are sufficiently close so that the averages over all of state space can be approximated using a few configurations sampled from the ensemble of the reference system. A necessary condition for this to be valid is that the higher order terms in Eq. 1 are small and that the two approximations in Eq. 1 and Eq. 3 yield very similar answers. An example of this methodology is found in Fig. 2. From this figure, it is apparent that the total energies track each other well, again suggesting that DFT provides a faithful sampling of the energy landscape. Quantitatively, Eq. 1 bears this out, with the second term in the cumulant expansion being of the first one for the solid at 7.27 g/cc and for the liquid. The bottom panel in Fig. 2 shows the differences between the solid and the liquid snapshots after the average DMC-DFT energy difference for the solid is subtracted for all points. This shows visually that the DMC energy is on average meV/atom larger for the liquid snapshots than the corresponding DFT.
Once the change in the Helmholtz free energy is calculated, the change to the melting temperature produced by DFT can be found using the formula
| (4) |
where the superscript indicates differences between liquid and solid, is the DFT entropy of melting. The difference in the Gibbs free energy is with the isothermal bulk modulus and the change in pressure as the potential energy is changed from to at constant volume. In the work of Sola and Alfé,Sola and Alfè (2009) the corrections to the Gibbs free energy are found to be small so that the value of at constant V is also representative of at constant p.
Uncertainties in the size of the approximations made in this approach may be removed by making a modification to the procedure. Instead of performing a one shot calculation of free energy at a single point in (V, T) space, an entire isotherm can be evaluated. First, QMD calculations are performed at several different densities along the 3000K and 5600K isotherms centered around the melt densities calculated with the two phase calculations. Using the relation at constant temperature that
| (5) |
relative Helmholtz free energies in each phase may be found. The two phase calculation allows for the relative free energies between these phases to be set using the Gibbs construction.
For the lower density case, these free energy curves were augmented by a shift in the relative free energies using the 30.1 meV per Xe found with the above techniques. Assuming that this free energy shift will be constant as a function of volume, the change in the melt line can be found in two different ways. First, the change in the melt temperature at constant pressure is found using Eq. 4 since the additional thermodynamic information contained in the relative free energy in each phase allows the isothermal bulk modulus and the change in entropy upon melt to be calculated directly, yielding 82 GPa and 0.787 respectively. This assumption of a rigid shift in the free energy renders the second term in the change in the Gibbs free energy 0 because of a zero shift in pressure from one theory to the next. Putting this all together, gives a shift in the melt temperature to 3440 K at 24.4 GPa. Second, one can use a Gibbs construction on the relative Helmholtz free energies and find a pressure shift to a melt of 18.66 GPa at 3000 K.
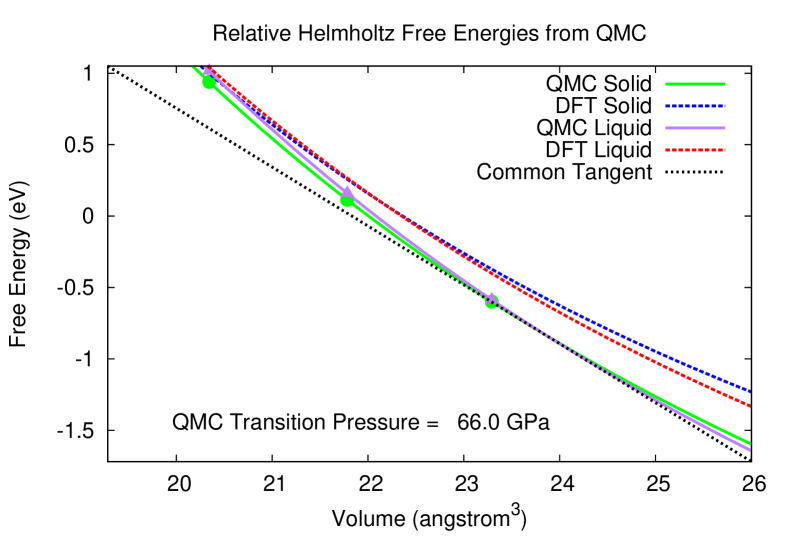
Finally, and most importantly, we take into account the effect of a change in pressure on the free energy differences of the melt near 10 g/cc where the discrepancy between theory and experiment is the largest. We here use thermodynamic integration at three different densities, allowing for information about changes in the size of the shift as a function of pressure to be considered, a notable effect in compressible materials like xenon. Doing so, we found that the pressure changes by 9 GPa upon switching from a DFT to a QMC ensemble while the isothermal bulk modulus increases to 215 GPa. These results are shown in Fig. 3, which shows how the relative free energies of the solid and liquid are changed by the thermodynamic integration. Now the full change in the Gibbs free energy for each phase can be found, yielding a melting temperature of 5810 K at 74.4 GPa. Had the relative change in free energy from the thermodynamic integration been assumed to be constant, this would have yielded a higher melting temperature of 6130 K at 74.4 GPa. Also, a pressure shift can be found as above, yielding a melting pressure of 66 GPa at 5600 K.
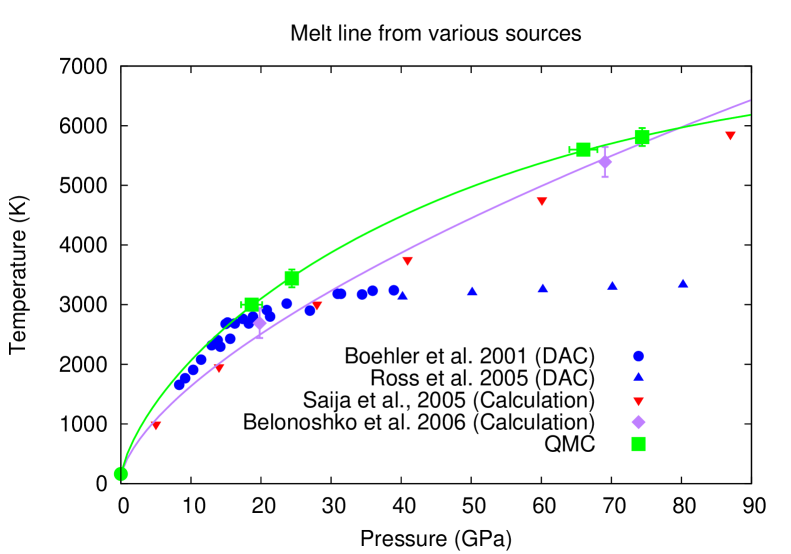
Taking these two points together with the well established melting temperature at ambient pressure results in a melt line shown in Fig. 4. The net effect is to increase the disagreement between the high pressure melt line and the DAC experiments. A notional Kechin melt curve fitting these two high pressure points and the ambient pressure melting is shown in the figure. The melting has been brought into better agreement with the DAC at low pressures, but suggests that the flattening of the melt curve at high pressures is not correct. These results for xenon suggest that the high pressure DAC experiments should be reexamined to rule out either surface effects or non-hydrostatic stresses as the cause of the flat melt line.Belonoshko and Dubrovinsky (1997) This result might be achieved by exploiting a bulk probe of the xenon structure such as x-ray diffraction rather than the speckle field technique that was previously used.Ross et al. (2005)
In addition to this result on xenon, we have provided validation of the thermodynamic integration approach to using DMCSola and Alfè (2009) to inform high pressure melt boundaries by performing a test of the method on aluminum. In the process we extended the methodology, improving the accuracy for compressible materials. This high-accuracy procedure can be used to further explore the melting behavior of a wide variety of materials, thereby contributing to the ability of hydrodynamic simulations to predictively model a wide range of phenomena from inertial confinement fusion to planetary science.
The authors acknowledge helpful discussions with Ken Esler who provided help in developing the xenon pseudopotentials and thank John Carpenter for the suggestion to validate the method against the aluminum melt line and checking the low pressure xenon behavior. The calculations reported here were performed using the Sandia National Laboratories TLCC machines as well as the ACES cielo. The work was supported by the NNSA Science Campaigns and LNS was supported through the Predictive Theory and Modeling for Materials and Chemical Science program by the Basic Energy Science (BES), Department of Energy (DOE). Sandia National Laboratories is a multiprogram laboratory managed and operated by Sandia Corporation, a wholly owned subsidiary of Lockheed Martin Corporation, for the U.S. Department of Energy’s National Nuclear Security Administration under Contract No. DE-AC04-94AL85000.
References
- Guillaume et al. (2011) C. L. Guillaume, E. Gregoryanz, O. Degtyareva, M. I. McMahon, M. Hanfland, S. Evans, M. Guthrie, S. V. Sinogeikin, and H. Mao, Nature Physics 7, 211 (2011).
- Dahl and Stevenson (2010) T. W. Dahl and D. J. Stevenson, Earth and Planetary Science Letters 295, 177 (2010).
- Dewaele et al. (2010) A. Dewaele, M. Mezouar, N. Guignot, and P. Loubeyre, Phys. Rev. Lett. 104, 255701 (2010).
- Anzellini et al. (2013) S. Anzellini, A. Dewaele, M. Mezouar, P. Loubeyre, and G. Morard, Science 340, 464 (2013).
- Ross et al. (2005) M. Ross, R. Boehler, and P. Soderlind, Phys. Rev. Lett. 95, 257801 (2005).
- Belonoshko et al. (2006) A. B. Belonoshko, S. Davis, A. Rosengren, R. Ahuja, B. Johansson, S. I. Simak, L. Burakovsky, and D. L. Preston, Phys. Rev. B 74, 054114 (2006).
- Armiento and Mattsson (2005) R. Armiento and A. E. Mattsson, Phys. Rev. B 72, 085108 (2005).
- Andersson et al. (1996) Y. Andersson, D. C. Langreth, and B. I. Lundqvist, Phys. Rev. Lett. 76, 102 (1996).
- Nellis et al. (1982) W. J. Nellis, M. van Thiel, and A. C. Mitchell, Phys. Rev. Lett. 48, 816 (1982).
- Foulkes et al. (2001) W. M. C. Foulkes, L. Mitas, R. J. Needs, and G. Rajagopal, Rev. Mod. Phys. 73, 33 (2001).
- Drummond and Needs (2006) N. D. Drummond and R. J. Needs, Phys. Rev. B 73, 024107 (2006).
- Sorella et al. (2007) S. Sorella, M. Casula, and D. Rocca, Journal of Chemical Physics 127, 014105 (2007).
- Beaudet et al. (2008) T. D. Beaudet, M. Casula, J. Kim, S. Sorella, and R. M. Martin, Journal of Chemical Physics 129, 164711 (2008).
- Vinet et al. (1986) P. Vinet, J. Ferrante, J. R. Smith, and J. H. Rose, Journal of Physics C: Solid State Physics 19, L467 (1986).
- Sola and Alfè (2009) E. Sola and D. Alfè, Phys. Rev. Lett. 103, 078501 (2009).
- Boehler (1993) R. Boehler, Nature 363, 534 (1993).
- Bouchet et al. (2009) J. Bouchet, F. Bottin, G. Jomard, and G. Zérah, Phys. Rev. B 80, 094102 (2009).
- Root et al. (2010) S. Root, R. J. Magyar, J. H. Carpenter, D. L. Hanson, and T. R. Mattsson, Phys. Rev. Lett. 105, 085501 (2010).
- Kresse and Furthmuller (1996) G. Kresse and J. Furthmuller, Phys. Rev. B 54, 11169 (1996).
- Saija and Prestipino (2005) F. Saija and S. Prestipino, Phys. Rev. B 72, 024113 (2005).
- Boehler et al. (2001) R. Boehler, M. Ross, P. Söderlind, and D. B. Boercker, Phys. Rev. Lett. 86, 5731 (2001).
- Kechin (2001) V. V. Kechin, Phys. Rev. B 65, 052102 (2001).
- Belonoshko and Dubrovinsky (1997) A. B. Belonoshko and L. S. Dubrovinsky, American Mineralogist 82, 441 (1997).