Effects of non-uniform Mn distribution in (Ga,Mn)As
Abstract
Resonant in situ photoemission from Mn states in Ga1-xMnxAs is reported for Mn concentrations down to very dilute limit of 0.1 at%. The properties of the peak at the valence-band maximum reveal an effective interaction between Mn 3d states for concentration as low as 2.5%. Concentration-dependent spectral features are analyzed on the basis of first-principles calculations for systems with selected impurity positions as well as for random alloys.
pacs:
75.50.Pp,79.60.BmIn the quest for magnetic semiconductors with potential use in spintronics, (Ga,Mn)As has emerged as the prototype system with documented spin-polarization of the electron states. Even though the Curie temperature of (Ga,Mn)As is still too low for practical implementations, the transport properties can be controlled to the extent that device structures based on the unusual magnetic characteristics can be explored. In this perspective it is remarkable that the electronic structure of (Ga,Mn)As remains poorly characterized. It is generally agreed that the ferromagnetic state is due to Mn atoms in substitutional Ga sites. From electron spin resonance (ESR) and optical data it is known that individual Mn atoms occur in either an ionized or a neutral (+hole) state, the latter being the reason for the -type behaviour with the acceptor level at 113 meV above the valence band maximum (VBM) Schneider1987; Twardowski1999. In systems with higher Mn concentrations the ESR data are found to be strongly broadened Twardowski1999 and the situation is less clear. Interestingly, the broadening is observed in epitaxial layers with relatively low Mn concentration (0.5 at%), where one would expect to have a system of well separated impurities. The broadening has been tentatively ascribed to effects of demagnetizing field Twardowski1999.
Photoelectron spectroscopy is the most direct method for probing the electron structure. An issue of concern in this context is the intrinsic surface sensitivity of this technique. This, in combination with the metastable character of (Ga,Mn)As with concentrations of interest (in the range of 1 %) prohibits standard surface preparation involving ion beam surface cleaning and annealing at sufficiently high temperatures (above 300 ∘C) to restore the surface order. Although this is obvious, it is remarkable that only a few in situ studies are available so far. Even more surprising, some of the ”generally accepted” details about the electronic structure are derived from studies involving such treatment even though they are in conflict with results from in situ studies. Specifically it has been demonstrated that the energy of the main Mn –induced valence band structure is shifted by about 1 eV towards higher binding energy by such treatment Adell2004, yet the most quoted value is that derived from ex situ treated samples Rader2009.
A particularly important issue in the context of magnetism in (Ga,Mn)As is the nature of electron states mediating the ferromagnetic coupling. The so far most successful description of ferromagnetism in (Ga,Mn)As has been based on spin polarization of holes in the GaAs valence band Dietl2000. More recently this picture has been questioned, since experiments showed that the ferromagnetic state was retained even in the absence of valence band holes Scarpulla2005.
The present letter reports a detailed in situ resonant photoemission study for samples with different Mn concentration in the range 0.1 % to 6 %. It is emphasized that these are the first photoemission data for such a very dilute limit. We focus our attention on the 3d Mn peak at the valence band maximum since the states in this energy region are crucial for the establishing of long range magnetic order. We show that at Mn concentrations as low as 2.5% there is clear sign of effective interaction between Mn 3d states. The analysis of the spectra is based on two types of first-principles calculations: for samples with selected impurity positions and for random alloys.
The photoemission data were obtained at the undulator beamline I511 at the Swedish synchrotron radiation facility MAX-lab. The samples were prepared in a local molecular beam epitaxy (MBE) system, and were transferred to the photoemission station in a portable UHV chamber without being exposed to atmosphere. The Mn concentrations were determined by means of reflection high-energy electron diffraction (RHEED) oscillations, as described earlier Sadowski2000. The RHEED oscillations were also used for defining a secondary Mn concentration scale based on the Mn absorption spectra, which was used in cases where clear oscillations were not observed. It is important to stress that the (Ga,Mn)As samples were not subject to any post-growth treatment. The surface cleanliness was checked by survey spectra recorded at 1000 eV photon energy. All samples were perfectly free from surface contamination.
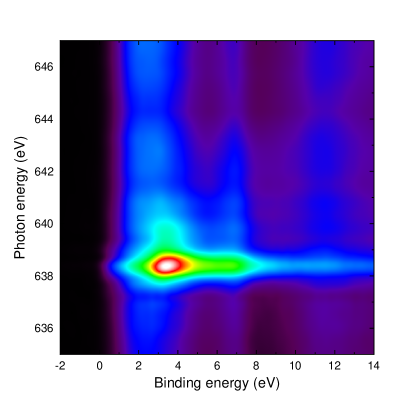
Valence band photoemission from dilute systems like (Ga,Mn)As is normally dominated by the host material states (GaAs in the present case). However, emission from impurity states can be enhanced selectively under resonant conditions, i.e. when the photoemission process involves an intermediate core hole excitation. In the present system a strong enhancement is expected just above the Mn excitation threshold, due to a large excitation matrix element in combination with a localized intermediate state. This is indeed verified in the intensity contour plot in Fig. 1. The complete lack of structures along the diagonal in this graph (i.e. structures reflecting Auger decay) shows that the enhancement is predominantly caused by resonant photoemission. This is in contrast to the results in ref. Rader2004, where about 50% of the spectral intensity was concluded to be due to incoherent Auger transitions. Since the incoherent decay becomes prominent with Mn clustering Adell2004; Adell2011, this observation together with the deeper position of the main peak, indicates that the sample in ref. Rader2004 contained Mn clusters, likely due to post-growth treatment.
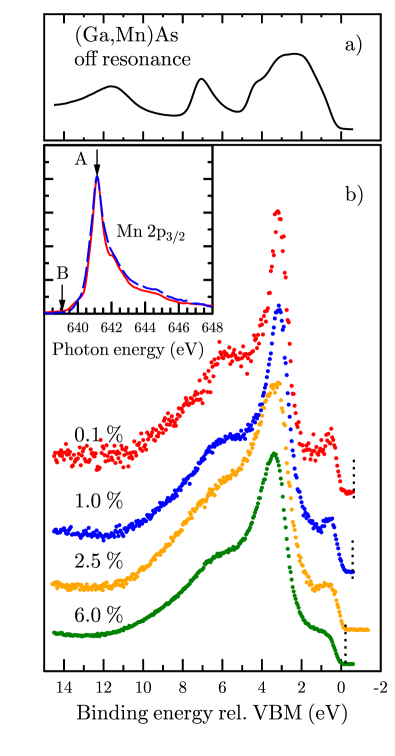
The resonant valence band emission (reflecting the Mn -states) was obtained from the difference between spectra recorded with photon energies on- and off-resonance, as indicated in the inset in Fig. 2). The main advantage of this procedure, as compared with that in ref. 8, is that it avoids artefacts not related to the resonant process, e.g. different surface states on different samples.
In situations with very low impurity concentrations, the spectra recorded on- and off-resonance are of course very similar, and the extraction of difference spectra becomes a quite delicate procedure. In such situations it is extremely important that the spectra are properly normalized and well aligned with respect to binding energy. We achieved this by extending the recorded spectra to cover the Ga peak, and used this peak for normalizing as well as aligning spectra obtained at different photon energies. The alignment was done with an accuracy of 1 meV, and the procedure was checked by the absence of any systematic structures in the Ga difference spectra. For the most dilute cases it turned out that thermal effects due to varying monochromator heating had to be considered. To minimize such effects, the recording time for each spectrum was reduced to about 1 minute. To achieve reasonable statistics, a number (typically 50-100) of such difference spectra were added after proper alignment.
In Fig. 2 we show a set of valence band difference curves obtained for samples with different Mn concentrations. Our high-concentration data resemble to some extent those presented in ref. 8, but as will be pointed out below, there are also significant differences. The analysis shows that the main Mn –induced valence band structure is observed around 3.0-3.3 eV below the VBM. With increasing Mn concentration this peak broadens and shifts by 0.2-0.3 eV towards higher binding energy. Another Mn induced structure is observed close to VBM. At low concentrations it is peak-shaped, but broadens and becomes shoulder-like for high concentrations. The electron states in this energy region are crucial for establishing long-range magnetic order and demand a careful study. Our experiments are performed for a broad range of Mn concentrations, including the very dilute limit of 0.1 %, and provides new possibilities for investigations of the interaction between distant impurity atoms.
To elucidate the experimental findings we performed an extensive first-principles study using a self-consistent Green function Korringa-Kohn-Rostoker (KKR) method implemented within the multiple scattering theory Luders2001. The calculations were performed within the density functional theory in the local spin density approximation (LSDA). Two types of calculations have been performed. First, we considered individual Mn impurities in GaAs by placing them at different positions inside a large fragment of the semiconductor. Second, the coherent potential approximation (CPA) was used to consider random alloys with different Mn concentrations. According to our CPA calculations (not displayed) the main Mn peak observed in the experiment around 3.0-3.3 eV can be clearly identified with Mn atoms in substitutional Ga sites. In the calculations this peak is found at 2.9 eV below the Fermi level. This result is in a very good agreement with other first-principles calculations performed within the local density approximation. As already mentioned, the position of the main Mn peak is an issue of controversy, and it is worth stressing that the consistency between the present experimental and theoretical results is in conflict with earlier data locating the peak around 4.5 eV below VBM Rader2004; Okabayashi1999.
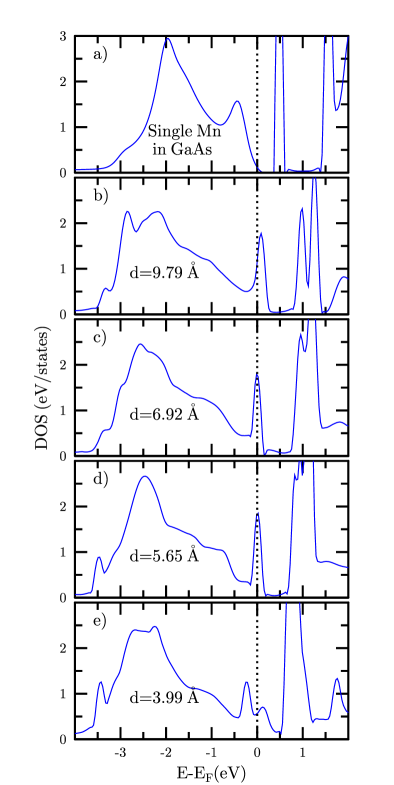
In order to address the concentration dependence we begin with calculations of the density of states of an isolated Mn impurity at a Ga site. We obtain a narrow peak above the Fermi level (Fig. 3a). These empty states reflect the acceptor nature of the MnGa impurity. The integral of the DOS above the Fermi level shows that, as expected, there is exactly one hole per Mn atom.
The CPA calculation for the 0.1% concentration of MnGa impurities gives the result very similar to those for an isolated impurity. Since in the low concentration limit the CPA calculation should reproduce the results for the isolated impurity, the agreement of two different approaches demonstrates the stability of the numerical procedures.
If we place another MnGa impurity at a distance of 5.65 Å or more from the first one, the narrow peak is shifted close to the VBM and becomes partly occupied, although the shape of the Mn DOS remains almost unchanged. The two Mn atoms do not noticeably influence each other. Merely in the case of the nearest next neighbors at the distance of 3.99 Å the peak becomes dispersive, indicating a strong hybridization between Mn -states.
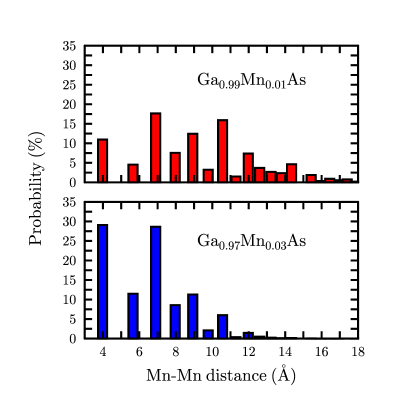
According to our experimental findings (Fig.2) the peak close to the VBM is broadened for a concentration of 2.5%. In the case of uniformly distributed Mn impurities in Ga0.975Mn0.025As, the distance between Mn atomic positions is around 12 Å. At such distances the Mn-Mn hybridization is insignificant and will not broaden the peak close the VBM (see Fig. 3). Therefore, we have reasons to believe that the distribution of Mn impurities is not uniform and strongly depends on the Mn concentration. To justify this, we have performed Monte Carlo simulations with 10.000 Mn atoms randomly distributed in a fcc matrix at different concentrations. The results of our simulations for 1% and 3% are shown in Fig. 4. The most important and striking result is the high proportion of nearest neighbors at high Mn concentrations. In the case of the 3% alloy, 30% of Mn atoms have another Mn in an adjacent site at 3.99 Å. At very low concentration (0.1%) the distribution is peaked halfway to the nominal mean distance of 36 Å (is not shown here).
The finding that the variation of the spectral features has very strong dependence on the impurity concentration is relevant for the discussion of the ferromagnetism of GaMnAs. Indeed, in the mediating of the interatomic exchange interaction the states close to the VBM play the most important role. The substantial broadening of the spectral features in this energy reagion already for relatively low Mn concentration explains the high Curie temperature in such samples.
In conclusion, the observed broadening of the Mn -states in Ga1-xMnxAs for can be explained by a highly non-uniform local distribution of Mn-impurities in GaAs and the strong - hybridization between nearest Mn atoms. Our combined experimental-theoretical approach allows to detect and interpret the features in the Mn related DOS that appear most clear in the singular impurity limit and broaden very quickly with increasing Mn concentration.