The Discovery of Pulsating Hot Subdwarfs in NGC 280811affiliation: Based on observations made with the NASA/ESA Hubble Space Telescope, obtained at STScI, which is operated by AURA, Inc., under NASA contract NAS 5-26555.
Abstract
We present the results of a Hubble Space Telescope program to search for pulsating hot subdwarfs in the core of NGC 2808. These observations were motivated by the recent discovery of such stars in the outskirts of Cen. Both NGC 2808 and Cen are massive globular clusters exhibiting complex stellar populations and large numbers of extreme horizontal branch stars. Our far-UV photometric monitoring of over 100 hot evolved stars has revealed six pulsating subdwarfs with periods ranging from 85 to 149 s and UV amplitudes of 2.0 to 6.8%. In the UV color-magnitude diagram of NGC 2808, all six of these stars lie immediately below the canonical horizontal branch, a region populated by the subluminous “blue-hook” stars. For three of these six pulsators, we also have low-resolution far-UV spectroscopy that is sufficient to broadly constrain their atmospheric abundances and effective temperatures. Curiously, and in contrast to the Cen pulsators, the NGC 2808 pulsators do not exhibit the spectroscopic or photometric uniformity one might expect from a well-defined instability strip, although they all fall within a narrow band (0.2 mag) of far-UV luminosity.
Subject headings:
globular clusters: individual (NGC 2808) – stars: horizontal branch – ultraviolet: stars – stars: oscillations (including pulsations)1. Introduction
1.1. Formation of Extreme Horizontal Branch Stars
The formation of extreme horizontal branch (EHB) stars has been an intriguing puzzle for decades (for a review, see Heber 2009). These stars are distinguished by their high effective temperatures (20,000 K) and surface gravities (log 5), and are located at the hot end of the HB in globular clusters (GCs) with extended blue HB morphologies. Their analogs in the field, the subdwarf B (sdB) stars, are responsible for the “UV upturn” in the otherwise cool spectra of ellipticals (e.g., Brown et al. 1997; Yi et al. 1997; O’Connell 1999; Brown et al. 2000). EHB stars have extremely thin envelope masses ( ), implying that they have undergone significant mass loss on the red-giant branch (RGB) since leaving the main sequence (MS). The challenge has been to understand how a star can lose 0.3 on the RGB while retaining enough mass to ignite helium in the core and evolve to the EHB. However, observations to date have not determined how this mass loss actually occurs. The high fraction of binaries among field subdwarfs (e.g., Maxted et al. 2001) suggests a binary mechanism for their production such as Roche Lobe overflow, common envelope evolution, white dwarf (WD) mergers (e.g., Han et al. 2002, 2003), or MS-WD mergers (e.g., Clausen & Wade 2011).
New insight into the formation of EHB stars in GCs has come from the discoveries of a double MS in Cen (Anderson 1997) and a triple MS in NGC 2808 (D’Antona et al. 2005; Piotto et al. 2007). These massive GCs apparently contain a significant (20%) population of helium-rich () stars (Piotto et al. 2005; Dupree & Avrett 2013), likely formed in a second stellar generation from the helium-rich ejecta of the first generation (see Bekki & Norris 2006). With enough scrutiny, one can find at least small variations in chemical composition for any GC, but the massive GCs exhibit significantly larger spreads in many heavy elements as well as clear evidence for helium-rich subpopulations (for a review, see Gratton et al. 2012). These helium-rich subpopulations may explain why massive GCs have HB morphologies that extend to high (D’Antona et al. 2002; Busso et al. 2007). Because the MS turnoff mass decreases strongly with increasing helium for a given GC age, a helium-rich star will arrive on the HB with a significantly lower mass and therefore a higher than a helium-normal star, assuming the same RGB mass loss. Thus, single-star mass loss in the helium-rich stars via a strong stellar wind (e.g., Schröder & Cuntz 2005), or even planet ingestion (Soker 1998), may be sufficient to populate the EHB. This possibility is supported by the low binary fraction among the GC subdwarfs (Moni Bidin et al. 2006, 2009, 2011). Moreover, the fact that the fraction of HB stars falling on the EHB does not appear to vary significantly with radius in Cen or NGC 2808 (e.g., Whitney et al. 1998; Iannicola et al. 2009) would also argue against a binary origin for these EHB stars. It appears therefore that the EHB stars in massive GCs are most likely the progeny of the most helium rich subpopulations, in contrast to the field population, where a greater diversity of formation mechanisms may be at play.
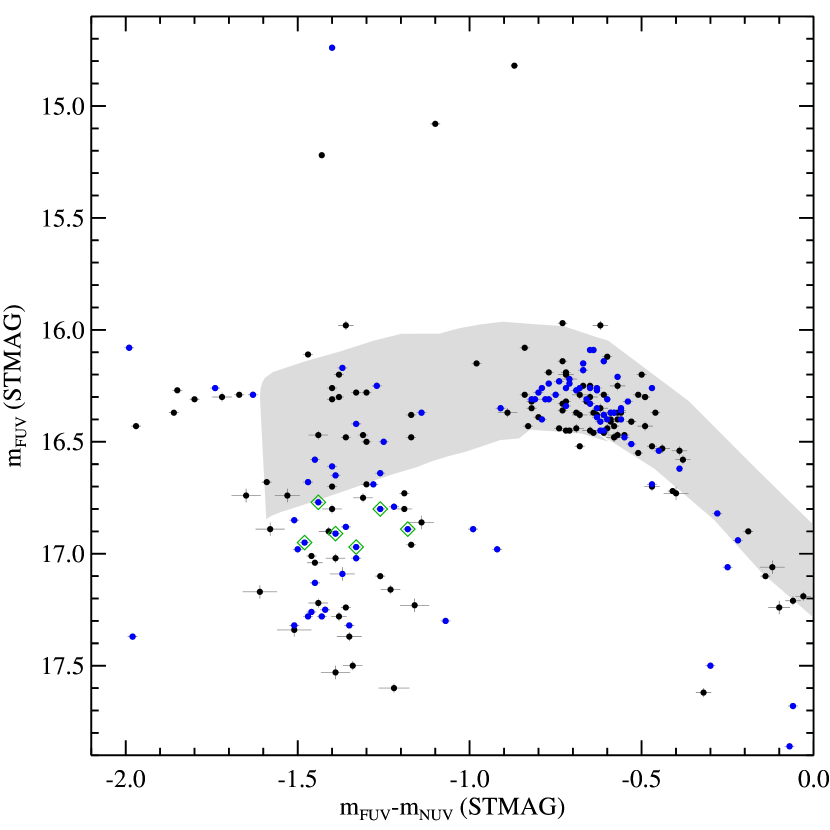
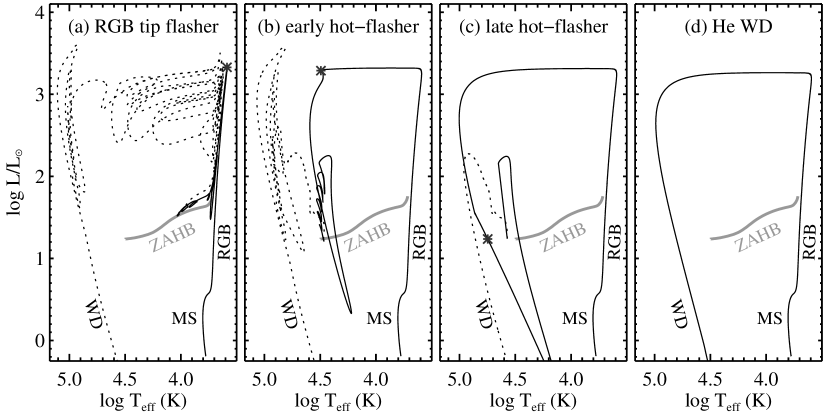
Recent observations have revealed that massive GCs also host a population of subluminous EHB stars that cannot be explained by the usual post-RGB evolution. These subluminous stars were first discovered in Cen, where they form a “blue hook” at the hot end of the EHB (D’Cruz et al. 2000). D’Cruz et al. (2000) proposed that these blue-hook stars were the result of a delayed helium-core flash beyond the RGB tip. Brown et al. (2001) subsequently found a large population of blue-hook stars in the UV color-magnitude diagram (CMD) of NGC 2808 (Figure 1). Using new evolutionary and spectroscopic models, Brown et al. (2001) demonstrated that these blue-hook stars were the result of flash mixing on the WD cooling curve. Normally, stars ignite helium at the RGB tip (Figure 2), but stars that lose sufficient mass, either through single- or binary-star mechanisms, will leave the RGB and evolve to high before igniting helium (Castellani & Castellani 1993). If the helium-core flash is delayed until the WD cooling curve, the flash convection will mix the hydrogen envelope into the helium core (Sweigart 1997), leading to greatly enhanced surface abundances of helium and carbon as well as a much higher during the subsequent EHB phase. The higher , together with the decreased hydrogen opacity, make the flash-mixed stars subluminous in observing bands longward of the Lyman limit, when compared to normal HB stars.
In a later study, Brown et al. (2010) found blue-hook stars in 5 other massive GCs spanning a wide range of metallicity. Spectroscopic investigations of the blue-hook and normal EHB populations in Cen (Moehler et al. 2011) and NGC 2808 (Brown et al. 2012) have confirmed that, compared to the normal EHB stars, the blue-hook stars are both much hotter and enhanced in helium and carbon, thus providing unambiguous evidence for flash mixing. From an analysis of Space Telescope Imaging Spectrograph (STIS) spectra, Brown et al. (2012) found that the hottest blue-hook stars in NGC 2808 exhibit effective temperatures up to 50,000 K, carbon abundances orders of magnitude higher than in normal EHB stars, helium abundances of 99% by mass, and enormous enhancements in the iron-peak elements from radiative levitation.
1.2. Pulsating Subdwarfs
One of the exciting new avenues for exploring the formation and evolutionary status of hot subdwarfs has been asteroseismology. Rapidly-pulsating hot subdwarfs are well-established in the field, where they are known as V361 Hya stars (also known as EC 14026 stars; Kilkenny et al. 1997). Their short (100–200 s) non-radial pulsations are driven by an iron opacity mechanism associated with a local overabundance of iron in the driving region (Charpinet et al. 1996), produced by diffusion in these otherwise metal-poor stars. The V361 Hya stars inhabit an instability strip at 29,000 K 36,000 K (Charpinet et al. 1997). Asteroseismic analysis of hot subdwarfs can yield accurate structural parameters (e.g., to 0.6%, log to 0.03%, total mass to 1%, and envelope mass to 20%; Charpinet et al. 2009). For this reason, the Kepler mission has dedicated significant observing time toward asteroseismology of hot subdwarfs in the field (e.g., Østensen et al. 2010).
Asteroseismology in GCs has been a different story. Until very recently, all searches for pulsating subdwarfs in GCs had been unsuccessful (e.g., Reed et al. 2006). However, Randall et al. (2011, 2012) have now discovered 5 hot pulsating subdwarfs in Cen. Compared to the field pulsators, these new pulsators have somewhat shorter periods (84–124 s) and higher temperatures (50,000 K), with similar pulsation amplitudes ranging from 0.9 to 2.7%. The Cen pulsators raise the exciting possibility of a new instability strip unseen among the field subdwarfs. Given its size, distance, and reddening, NGC 2808 is the most logical candidate to search for such pulsators beyond Cen. Previous far-UV photometry and spectroscopy of the NGC 2808 core revealed a large population of hot evolved stars to check for pulsations, including blue-hook stars near the temperature of the Cen pulsators (Brown et al. 2001, 2012). In this Letter, we report the discovery of six new pulsators among the hot evolved stars of NGC 2808.
2. Observations and Data Reduction
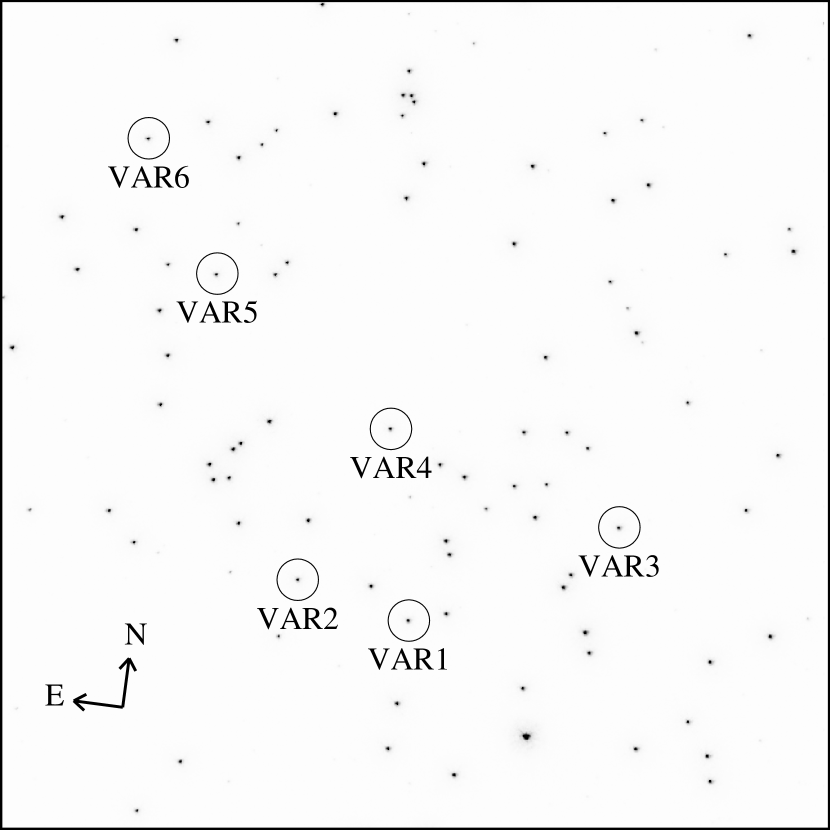
We obtained far-UV images of the NGC 2808 core in 5 consecutive orbits on 28 March 2013, using STIS on the Hubble Space Telescope (HST). The cumulative exposure time was 16 ks, spanning a 26 ks observing window interrupted by four 2.5 ks gaps due to occultations. Although we used the same instrument employed by Brown et al. (2001), the new far-UV imaging of the NGC 2808 core was distinct in three ways. First, only a single 2525′′ field was imaged within the larger area imaged previously. Second, we used the time-tag mode on STIS, which records the arrival time of each detected photon to an accuracy of 125 s. Third, we used the FUV/F25SRF2 bandpass instead of the FUV/F25QTZ bandpass. Because the F25SRF2 bandpass extends to shorter wavelengths, it includes the terrestrial O I 1301 emission, increasing the background from 10-6 counts s-1 pixel-1 to 10-3 counts s-1 pixel-1. Although the F25SRF2 background is still quite low, it varies with orbital day and night, and is significant when integrated over the entire detector, making management of the STIS data buffer in time-tag mode more difficult. The advantage is that the throughput in the F25SRF2 bandpass is much higher than that in the F25QTZ bandpass. For reference, a star with = 30,000 K at =17 mag in the F25QTZ bandpass (e.g., see Figure 1) would produce 4.5 counts s-1 in the F25QTZ bandpass and 18 counts s-1 in the F25SRF2 bandpass. Because we monitored 110 hot stars that are bright in the UV, the photometric errors are dominated by Poisson noise on the source counts, and so the use of the broader bandpass enabled the detection of significantly weaker pulsations. In general, the use of a far-UV bandpass suppresses the dominant cool population, enabling accurate photometry in a sparse field of hot stars (Figure 3), even in the cluster core.
The STIS data were processed through the standard calibration pipeline, including corrections to the photon arrival times for general relativistic effects, displacement of HST from Earth center, and displacement of Earth from the solar system barycenter. The net count rate for each star was measured in two-second bins using aperture photometry and a local sky subtraction. We then performed a Lomb-Scargle Normalized Periodogram on the time-series photometry for each star, searching for periodic signals with 99% significance and periods between 50 and 300 s. This procedure produced six pulsators (Figure 1) for additional analysis. Three of these pulsators were included in the spectroscopic sample of Brown et al. (2012), who determined to an accuracy of 5,000 K. In addition, all of these pulsators have both far-UV and near-UV photometry from Brown et al. (2001). Strictly speaking, the UV photometry provides no constraints on surface gravity and only a lower limit (20,000 K) on , due to the abundance variations in this population. However, given the UV colors, VAR2 might be as hot as 50,000 K, while VAR3 and VAR4 might be as hot as 40,000 K.
The light curves of each pulsator were converted to fractional intensity variations about zero and their Fourier spectra (Figure 4) were computed in the frequency range of interest (0 – 15 mHz). Any peaks above a detection limit set to four times the local noise level were successively pre-whitened. For this, the measured period was kept fixed, while the amplitude and phase were determined using a least-squares fitting procedure to the light curve. The resulting sinusoid was subtracted from the light curve, the Fourier spectrum was re-computed, and the exercise was repeated until no peaks remained above the detection threshold. Using this method, we extracted the periods and amplitudes listed in Table 1. The dominant period for each pulsator is the same as the one detected in the initial Lomb-Scargle Periodogram. The amplitude uncertainty is 0.4%, corresponding to the formal least-squares fitting errors. The period uncertainty is 0.1 s, corresponding to a tenth of the frequency resolution of the data set. Besides the periodicities characterized in Table 1, the Fourier spectra (Figure 4) exhibit additional peaks above the detection threshold, but these are aliases of the true peaks, offset by 0.17 mHz (corresponding to the time separation between the contiguous observing blocks). While the Lomb-Scargle periodogram of VAR5 implied a significant signal of 146.8 s, the detection in the Fourier analysis is marginal (2.0% amplitude), being just below the 4 threshold (2.1% amplitude). Splitting the VAR5 time series into two halves, the 146.8 s periodicity appears in the independent Fourier spectra of each half, lending further credence to the signal. We also note here (but not in Table 1) a tentative detection of a second periodic signal for VAR2, with a period of 129.5 s and an amplitude of 1.8%.

| Alternate | UV Catalog | Periods | Amplitudes | aafootnotemark: | Fe-peak | ||
|---|---|---|---|---|---|---|---|
| Name | Nameaafootnotemark: | Entrybbfootnotemark: | (s) | (%) | (K) | aafootnotemark: | enhancementaafootnotemark: |
| VAR1 | EHB3 | 149 | 116.0, 107.8 | 3.1, 2.9 | 30,000 | 0.23 | 10 |
| VAR2 | – | 185 | 149.5 | 3.1 | 20,000–50,000 | – | – |
| VAR3 | – | 85 | 120.8 | 2.7 | 20,000–40,000 | – | – |
| VAR4 | – | 164 | 104.2, 85.4 | 6.8, 2.3 | 20,000–40,000 | – | – |
| VAR5 | BHk1 | 230 | 146.8 | 2.0 | 50,000 | 0.99 | 50 |
| VAR6 | BHk6 | 250 | 113.3 | 3.2 | 25,000 | 0.23 | 10 |
aBrown et al. (2012)
bBrown et al. (2001)
Our observing program was designed to detect pulsators on the EHB (at 99% significance) if they have periods of order 100 s and amplitudes of at least 2%. Thus, we cannot exclude the possibility that pulsators with lower amplitudes might exist. While our pulsators are all in the blue-hook region of the UV CMD (Figure 1), and are thus somewhat fainter than the canonical EHB, our completeness in detecting pulsations is not a strong function of UV luminosity, and is similar for both the EHB and blue-hook stars. To quantify the completeness, we shuffled the observed light curves for our six pulsators (while maintaining their occultations), inserted a periodic signal, and tried to blindly recover that signal using the Lomb-Scargle periodogram screening described above. For the six pulsators, amplitudes in the range of 1.8% to 2.0% resulted in significant (99%) detections in half the trials, with slight star-to-star variations. For larger amplitudes, the sample quickly becomes more complete, with 95% completeness for amplitudes above 2.5%. Artificial signal tests of the time-series photometry for the other stars in our sample yielded similar results. For the faintest blue-hook star and brightest EHB star in our sample, significant detections were made in half the trials for amplitudes of 2.4% and 1.4%, respectively.
We note that the point spread function (PSF) of VAR4, which is the pulsator exhibiting the strongest pulsations, is partly shadowed by the STIS repeller wire. This wire casts a thin shadow across the STIS FUV detector, with a depth of 10%. However, that shadowing cannot account for the variations observed in the photometry of this star. The shadow falls approximately 0.1′′ from the center of the PSF, and the star did not drift significantly relative to the repeller wire over the entire imaging period. The region of the PSF impacted by the repeller wire accounts for 6% of the encircled energy of the PSF, but given the depth of the shadow, plus its stability over the observations, the impact on the time-series photometry would be 1%. We simply note the presence of the shadow for completeness.
3. Discussion
Surprisingly, the six NGC 2808 pulsators form a rather inhomogeneous group. Their periods range from 85 to 149 s, with amplitudes of 2.0 to 6.8%, and span 0.3 mag in UV color. The 3 pulsators with spectra span a range of 25,000 to 50,000 K, with both helium-rich and hydrogen-rich atmospheres present. VAR5 is only the second pulsating subdwarf known to be enhanced in helium; the first was LSIV-14o116, a slowly-pulsating (period 2000 s) He-sdB star with =0.21, which is not a particularly high helium enhancement for the He-sdB class (Ahmad & Jeffery 2005). All of the NGC 2808 pulsators with spectroscopy exhibit the enhancement of the iron-peak elements (relative to the cluster abundance) that is a common product of radiative diffusion in hot subdwarfs.
The only obvious commonality among the NGC 2808 pulsators is that they lie in a narrow range of far-UV luminosity, immediately below the ZAHB, among the blue-hook stars in the UV CMD. The luminosity of one of these stars (VAR1) is close enough to the ZAHB that it was identified as a normal EHB star by Brown et al. (2012). Neither VAR1 nor VAR6 exhibit an enhanced helium abundance, as would be expected for stars that have undergone flash mixing. Perhaps the surface helium abundance in these stars was depleted through atmospheric diffusion; alternatively, these stars may not have undergone flash mixing at all. The fact that the six pulsators span a range in that is only 0.2 mag wide, despite the fact that the blue-hook stars and normal EHB stars together span an FUV luminosity range that is nearly ten times larger, may be a clue to the origin of these stars. The band of detected pulsators may be bounded on the bright end by the boundary between normal EHB and blue-hook stars. It is not clear what defines the faint luminosity boundary of the pulsators. Although pulsators are more difficult to detect at fainter luminosities, and the amplitude of the pulsations is near our detection limit, the completeness of pulsation detection is not a steep function of luminosity across this luminosity range, as discussed in the previous section.
It appears that the NGC 2808 pulsators are distinct from both the diverse population of pulsators in the field and the homogeneous sample of Cen pulsators (Randall et al. 2011), which are all helium-poor and have near 50,000 K. The relatively high yield of pulsating stars in our NGC 2808 survey may be due to selection bias, given that we focused the search on a sample consisting solely of hot subdwarfs, and because the pulsation amplitudes are expected to be stronger in the UV than in the optical. Indeed, any distinctions drawn between the NGC 2808 pulsators and the Cen pulsators should be tempered by the fact that the pulsators were characterized via very distinct data and atmospheric diagnostics in each cluster; the NGC 2808 pulsators were found in the cluster core and characterized via UV imaging and spectroscopy, while the Cen pulsators were found in the cluster outskirts and characterized via optical imaging and spectroscopy. Due to the crowding, optical spectroscopy for the NGC 2808 pulsators is impossible, even with HST, but one obvious avenue for further exploration would be UV spectroscopy of the Cen pulsators, putting them on the same observational footing as the NGC 2808 pulsators. We will also investigate the driving mechanism for the NGC 2808 pulsators in our future modeling efforts.
References
- (1)
- (2)
- (3)
- (4) Ahmad, A., & Jeffery, C.S. 2005, A&A, 437, L51
- (5)
- (6) Anderson, J. 1997, Ph.D. thesis, UCB
- (7)
- (8) Bekki, K., & Norris, J.E. 2006, ApJ, 637, L109
- (9)
- (10) Brown, T.M., Bowers, C.W., Kimble, R.A., Sweigart, A.V., & Ferguson, H.C. 2000, ApJ, 532, 308.
- (11)
- (12) Brown, T.M., Ferguson, H.C., Davidsen, A.F., & Dorman, B. 1997, ApJ, 482, 685.
- (13)
- (14) Brown, T.M., Lanz, T., Sweigart, A.V., Cracraft, M., Hubeny, I., & Landsman, W.B. 2012, ApJ, 748, 85.
- (15)
- (16) Brown, T.M., Sweigart, A.V., Lanz, T., Landsman, W.B., & Hubeny, I. 2001, ApJ, 562, 368
- (17)
- (18) Brown, T.M., Sweigart, A.V., Lanz, T., Smith, E., Landsman, W.B., & Hubeny, I. 2010, ApJ, 718, 1332.
- (19)
- (20) Busso, G., et al. 2007, A&A, 474, 105
- (21)
- (22) Castellani, M., & Castellani, V. 1993, ApJ, 407, 649
- (23)
- (24) Charpinet, S., Brassard, P., Fontaine, G., Green, E.M., Van Grootel, V., Randall, S.K., & Chayer, P. 2009, AIPC, 1170, 585
- (25)
- (26) Charpinet, S., Fontaine, G., Brassard, P., Chayer, P., Rogers, F.J., Iglesias, C.A., & Dorman, B. 1997, ApJ, 483, L123
- (27)
- (28) Charpinet, S., Fontaine, G., Brassard, P., & Dorman, B. 1996, ApJ, 471, L103
- (29)
- (30) Clausen, D., & Wade, R.A. 2011, ApJ, 733, L42
- (31)
- (32) D’Antona, F., Bellazzini, M., Caloi, V., Pecci, F.F., Galleti, S., & Rood, R.T. 2005, ApJ, 631, 868
- (33)
- (34) D’Antona, F., Caloi, V., Montalbán, J., & Ventura, P. 2002, A&A, 395, 69
- (35)
- (36) D’Cruz, N.L., O’Connell, R.W., Rood, R.T., Whitney, J.H., Dorman, B., Landsman, W.B., Hill, R.S., Stecher, T.P., & Bohlin, R.C. 2000, ApJ, 530, 352
- (37)
- (38) Dupree, A.K., & Avrett, E.H. 2013, ApJ, 773, L28
- (39)
- (40) Gratton, R., Carretta, E., & Bragaglia, A. 2012, A&ARv, 20, 50
- (41)
- (42) Han, Z., Podsiadlowski, P., Maxted, P.F.L., & Marsh, T.R. 2003, MNRAS, 341, 669
- (43)
- (44) Han, Z., Podsiadlowski, P., Maxted, P.F.L., Marsh, T.R., & Ivanova, N. 2002, MNRAS, 336, 449
- (45)
- (46) Heber, U. 2009, ARAA, 47, 211
- (47)
- (48) Iannicola, G., et al. 2009, ApJ, 696, L120
- (49)
- (50) Kilkenny, D., Koen, C., O’Donoghue, D., & Stobie, R.S. 1997, MNRAS, 285, 640
- (51)
- (52) Maxted, P.F.L., Heber, U., Marsh, T.R., & North, R.C. 2001, MNRAS, 326, 1391
- (53)
- (54) Moehler, S., Dreizler, S., Lanz, T., Bono, G., Sweigart, A.V., Calamida, A., & Nonino, M. 2011, A&A, 526, A136
- (55)
- (56) Moni Bidin, C., Villanova, S., Piotto, G., & Momany, Y., 2011, A&A, 528, 127
- (57)
- (58) Moni Bidin, C., Moehler, S., Piotto, G., Momany, Y., & Recio-Blanco, A. 2009, A&A, 498, 737
- (59)
- (60) Moni Bidin, C., Moehler, S., Piotto, G., Recio-Blanco, A., Momany, Y., & Méndez, R.A. 2006, A&A, 451, 499
- (61)
- (62) O’Connell, R.W. 1999, ARAA, 37, 603
- (63)
- (64) Østensen, R.H., et al. 2010, MNRAS, 409, 1470
- (65)
- (66) Piotto, G., et al. 2005, ApJ, 621, 777
- (67)
- (68) Piotto, G., Bedin, L.R., Anderson, J., King, I.R., Cassisi, S., Milone, A.P., Villanova, S., Pietrinferni, A., & Renzini, A. 2007, ApJ, 661, L53
- (69)
- (70) Randall, S.K., et al. 2012, Ageing Low Mass Stars: From Red Giants to White Dwarfs, in press.
- (71)
- (72) Randall, S.K., Calamida, A., Fontaine, G., Bono, G., & Brassard, P. 2011, ApJ, 737, L27
- (73)
- (74) Reed, M.D., et al. 2006, BalAst, 15, 65
- (75)
- (76) Schröder, K.-P., & Cuntz, M. 2055, ApJ, 630, L73
- (77)
- (78) Soker, N. 1998, AJ, 116, 1308
- (79)
- (80) Sweigart, A.V. 1997, The Third Conference on Faint Blue Stars, ed. A.G.D. Philip, J. Liebert, R. Saffer, & D.S. Hayes (Schenectady: L. Davis Press), 3
- (81)
- (82) Whitney, J.H., Rood, R.T., O’Connell, R.W., D’Cruz, N.L., Dorman, B., Landsman, W.B., Bohlin, R.C., Roberts, M.S., Smith, A.M., & Stecher, T.P. 1998, ApJ, 495, 284
- (83)
- (84) Yi, S., Demarque, P., & Oemler, A., Jr. 1997, ApJ, 486, 201
- (85)