Hard X-ray Lags in Active Galactic Nuclei: Testing the Distant Reverberation Hypothesis with NGC 6814
Abstract
We present an X-ray spectral and temporal analysis of the variable active galaxy NGC 6814, observed with Suzaku during November 2011. Remarkably, the X-ray spectrum shows no evidence for the soft excess commonly observed amongst other active galaxies, despite its relatively low level of obscuration, and is dominated across the whole Suzaku bandpass by the intrinsic powerlaw-like continuum. Despite this, we clearly detect the presence of a low frequency hard lag of 1600s between the 0.5–2.0 and 2.0–5.0 keV energy bands at greater than 6 significance, similar to those reported in the literature for a variety of other AGN. At these energies, any additional emission from e.g. a very weak, undetected soft excess, or from distant reflection must contribute less than 3% of the observed countrates (at 90% confidence). Given the lack of any significant continuum emission component other than the powerlaw, we can rule out models that invoke distant reprocessing for the observed lag behavior, which must instead be associated with this continuum emission. These results are fully consistent with a propagating fluctuation origin for the low frequency hard lags, and with the interpretation of the high frequency soft lags – a common feature seen in the highest quality AGN data with strong soft excesses – as reverberation from the inner accretion disk.
1. Introduction
Physical interpretation of the complex X-ray spectral and temporal behavior of active galaxies has been subject to continuous debate. One of the most popular interpretations invokes relativistic disc reflection (Fabian et al. 2009; Walton et al. 2010; Brenneman et al. 2011; Reis et al. 2012; Nardini et al. 2012; Gallo et al. 2013). In this scenario, the powerlaw-like coronal emission irradiates the accretion disk, resulting in an additional ‘reflected’ emission component consisting of both continuum emission and discrete atomic features, the most prominent of which is typically the iron K emission line (George & Fabian 1991). The majority of the emission arises from the inner regions of the accretion flow, and the relativistic effects inherent to such regions of strong gravity can broaden and blend these atomic features to the extent that at soft energies the reflected emission appears as an additional smooth continuum component (the ‘soft excess’; Crummy et al. 2006; Nardini et al. 2011; Walton et al. 2013), and result in the characteristic broad, skewed relativistic iron emission line profile first observed in MCG–6-30-15 (Tanaka et al. 1995). Comparison with the spectra observed from Galactic black hole binaries (BHBs) appears to support the presence of relativistic disc reflection in active galaxies (Walton et al. 2012), and indeed this has now been strongly confirmed for the variable AGN NGC1365 (Risaliti et al. 2013), through coordinated observations with XMM-Newton and the recently launched NuSTAR observatory (Harrison et al. 2013).
Relativistic disc reflection also offers a natural explanation for some of the temporal behavior typically observed, in particular the frequency dependent time lags (the ‘lag frequency-spectrum’) between different energy bands. Much of the work in this field has naturally focused on reverberation of the soft excess, owing to the photon statistics required for detailed lag studies, which on short timescales is observed to lag behind the emission at higher energies dominated by the intrinsic powerlaw continuum (‘soft’ lags; Fabian et al. 2009; Zoghbi et al. 2011; De Marco et al. 2013; Fabian et al. 2013; Cackett et al. 2013), a natural expectation of disc reflection. More recently, similar high-frequency reverberation of the broad iron K line has also been detected in sufficiently bright AGN (Zoghbi et al. 2012, 2013b; Kara et al. 2013a, b). However, in contrast to this apparent short-timescale reverberation, for variations on long timescales, higher energy emission is observed to lag behind that at lower energies (‘hard’ lags; McHardy et al. 2004; Papadakis et al. 2001; Vaughan et al. 2003). In the reflection scenario, these low-frequency hard lags are believed to be intrinsic to the powerlaw-like continuum rather than related to the reflection process. Similar hard lags are seen in Galactic BHBs, and are currently generally believed to arise due to inwardly propagating mass accretion rate fluctuations (Kotov et al. 2001; Arévalo & Uttley 2006), although an origin related to Compton scattering, widely expected to produce the powerlaw continuum, has also been discussed in the literature (Kazanas et al. 1997).
However, it has recently been argued that both the hard lags and the apparent reverberation of the soft excess instead arise simultaneously through reverberation from more distant optically thick material, rather than via separate physical processes (Miller et al. 2010; Legg et al. 2012). In this scenario, the low-frequency hard lags are interpreted as the true signature of reverberation, while the high-frequency soft lags are proposed to arise as a secondary consequence of this same reverberation process. This requires the reverberation transfer function – which determines how the hard band is observed to respond to variations in the soft band – to have a sharp functional form, resulting in oscillatory behavior in the lag frequency-spectrum at high frequencies (“phase wrapping”), which if strong enough (or the data sensitive enough) can additionally result in the apparent observation of soft lags at high frequencies. In this scenario strong non-zero structure should only be observed in lag spectra when comparing energy bands in which at least one contains a substantial contribution due to reprocessing by distant absorbing material. Such additional absorption/emission will naturally serve to distort the observed energy spectrum away from the intrinsic powerlaw-like AGN continuum. This interpretation for the lag behavior is designed to complement the absorption dominated solutions for the observed X-ray spectral complexities (Miller et al. 2009; Turner et al. 2009), although at the time of writing interpretations that self-consistently explain both the temporal and spectral behavior have not yet been presented.
Here, we present a new analysis of a recent Suzaku observation of the variable AGN NGC 6814 (Mukai et al. 2003), in which we demonstrate that the hard lags are most likely intrinsic to the powerlaw-like continuum, rather than arising through reverberation from distant circumnuclear material.
2. Data Reduction
Suzaku (Mitsuda et al. 2007) observed NGC 6814 in November 2011 for 85 ks duration. Here, we are primarily interested in the data obtained with the XIS detectors (Koyama et al. 2007). Following the Suzaku data reduction guide111http://heasarc.gsfc.nasa.gov/docs/suzaku/analysis/, we reprocessed the unfiltered event files for each of the XIS CCDs (XIS0, 1, 3) and editing modes (3x3, 5x5) operational using HEASOFT (v6.13), re-running the pipeline with the latest calibration database release (Nov 2012) and the standard screening criteria. Source products were taken from circular regions 200” in radius, and background estimated from regions free of any contaminating sources in the surrounding areas on the CCD. Spectra and lightcurves were extracted from the cleaned event files with XSELECT, and responses were generated for each individual spectrum using the XISRESP script (with medium resolution). After confirming their consistency, the spectra and responses for the front-illuminated (FI) detectors (XIS0 and 3) were combined using ADDASCASPEC. Finally, we grouped the spectra to have a minimum signal-to-noise (S/N) of 5 per energy bin with SPECGROUP (part of the XMM-Newton SAS), to allow the use of minimization during spectral fitting.
For the collimating HXD PIN detector (Takahashi et al. 2007) we again reprocessed the unfiltered event files. Estimation of the background requires individual consideration of the non X-ray instrumental background (NXB; the dominant component) and the cosmic X-ray background (CXB). Although we initially considered the recommended ‘tuned’ NXB model provided by the Suzaku team, doing so resulted in a severe under-prediction of the cross-normalization between the XIS and PIN data for any reasonable model in this case, giving rather than the expected 1.17 (the opposite effect a hard excess would give). Instead we used the earth-occulted data (earth elevation angle ∘) as the NXB contribution, which gave much more sensible results with the standard cross-calibration. The PIN response matrix was downloaded for the relevant observing epoch222http://www.astro.isas.ac.jp/suzaku/analysis/hxd/. Spectral products were generated using the HXDPINXBPI script, which simulates the expected contribution from the CXB, and the source spectrum was re-binned to a minimum S/N of 3 per bin, lower than required in the XIS spectra owing to the much lower countrate, but still sufficient to allow the use of minimization.
During this work, we consider the XIS data over the 0.5–10.0 keV energy range, and the PIN data over the 15–50 keV energy range. The data from all the detectors are modeled simultaneously, with all parameters tied between the spectra, and we attempt to account for any cross-calibration uncertainties between the FI and BI XIS detectors by allowing a multiplicative constant to vary between them. This value is always found to be within 1 per cent of unity. Unless stated otherwise, quoted uncertainties on spectral parameters are the 90% confidence limits throughout, and spectral analysis is performed with XSPEC v12.8.0 (Arnaud 1996).

3. Spectral Analysis
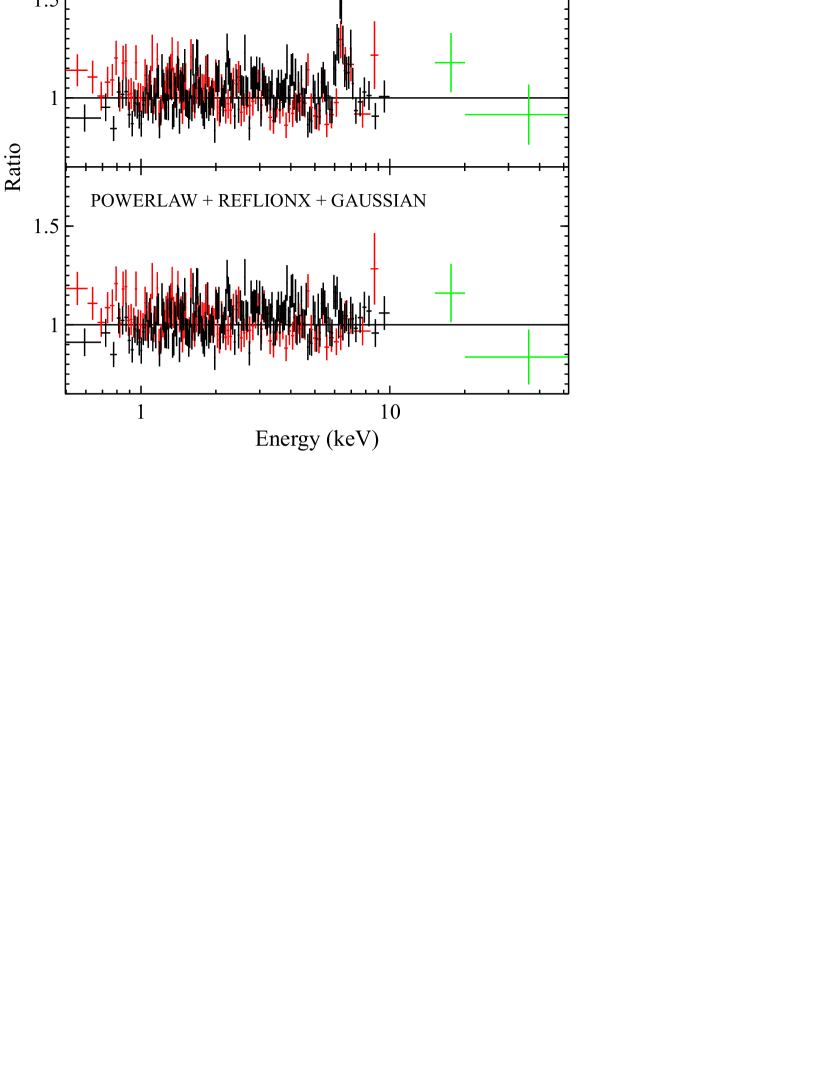
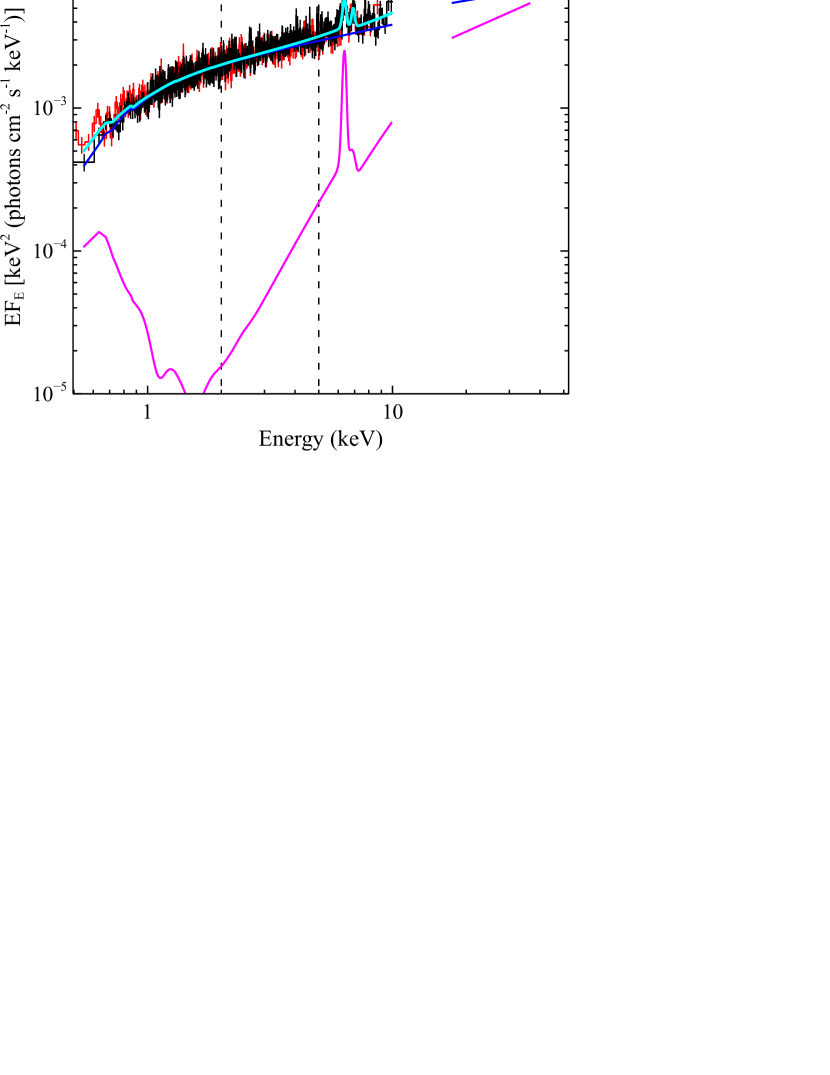
We begin by modeling the 0.5–50.0 keV spectrum of NGC 6814 with a simple absorbed powerlaw, allowing for both Galactic absorption ( atom cm-2; Kalberla et al. 2005) and intrinsic neutral absorption, utilising the TBNEW absorption code333http://pulsar.sternwarte.uni-erlangen.de/wilms/research/tbabs along with the solar abundances quoted in Wilms et al. (2000). Aside from some residual features at the iron K energies, this simple model provides an extremely good fit to the Suzaku data (see Fig. 1); the statistics are naturally dominated by the XIS data, but with the standard cross-calibration () the PIN spectrum is fully consistent with an extrapolation of the lower energy data. The photon index is fairly hard, , however NGC 6814 is radio quiet (Xu et al. 1999), so the X-ray spectrum should not be jet-dominated, and the amount of intrinsic neutral absorption is very small, atom cm-2.
The Fe K residuals show clear evidence for emission from neutral iron. Including a Gaussian emission line improves the fit by for 3 additional free parameters. There may also be emission associated with hydrogen-like iron at 7 keV. Including a second line provides only a moderate improvement, (3 additional free parameters), but doing so improves the constraints on the neutral line parameters, which no longer also attempt to account for the weaker excess emission at higher energies. Therefore, although the significance of this second line is more marginal, we include it in all our subsequent fits. The line energies obtained are and keV. We find the widths of the two lines to be consistent with one another, so for simplicity we link these parameters, obtaining keV, and their equivalent widths are and eV. The resulting fit is excellent, with .
Critically, the Suzaku spectrum of NGC 6814 does not display the soft excess typically observed in other unobscured AGN; in terms of the continuum the observed spectrum is dominated by the intrinsic powerlaw-like emission. Addition of a cool blackbody component, frequently used to phenomenologically model the soft excess, does not improve the fit ( additional free parameters). For a temperature of 0.15 keV, as is typically obtained (Gierliński & Done 2004; Miniutti et al. 2009), we find the upper limit to the 0.5–2.0 keV blackbody flux to be less than 3% of the powerlaw flux in this bandpass (at 90% confidence), even allowing for a variable intrinsic absorption column. When present in other AGN, the soft excess usually contributes 50% of the 0.5–2.0 keV powerlaw flux when modeled with a blackbody component (Miniutti et al. 2009). In fact, for many of the particular AGN on which the debate over the origin of the spectro-temporal behavior has focused, e.g. 1H 0707-495, the soft excess is substantially stronger than average.
The narrow iron line may indicate the presence of reflection by distant material. We therefore replace the neutral Gaussian with a full reflected spectrum (REFLIONX; Ross & Fabian 2005). Based on the line widths obtained previously, we allow some mild, Gaussian broadening with GSMOOTH, with the width linked to the Fe XXVI line. Again, an excellent fit is obtained, with . The iron abundance is constrained to be , the ionisation of the reflector is low, erg cm s-1, and the line broadening is consistent with that obtained previously: keV. This reflection component is weak (, calculated following Walton et al. 2013) and contributes less than 2–3% of the observed countrates in each of the 0.5–2.0 and 2.0–5.0 keV bands, given the XIS responses. The observed 2–10 keV flux from NGC 6814 is , which for a distance of 18.5 Mpc, mass of (Bentz et al. 2009) and the appropriate bolometric correction (Vasudevan & Fabian 2009) implies a rather low Eddingtion ratio, . In this regime, the inner disk may be truncated. Alternatively, the corona could be mildly outflowing (Beloborodov 1999). Either would offer a natural explanation for the weak reflection and the lack of a soft excess, and the latter could also explain the hard spectrum.

4. Variability and Lags
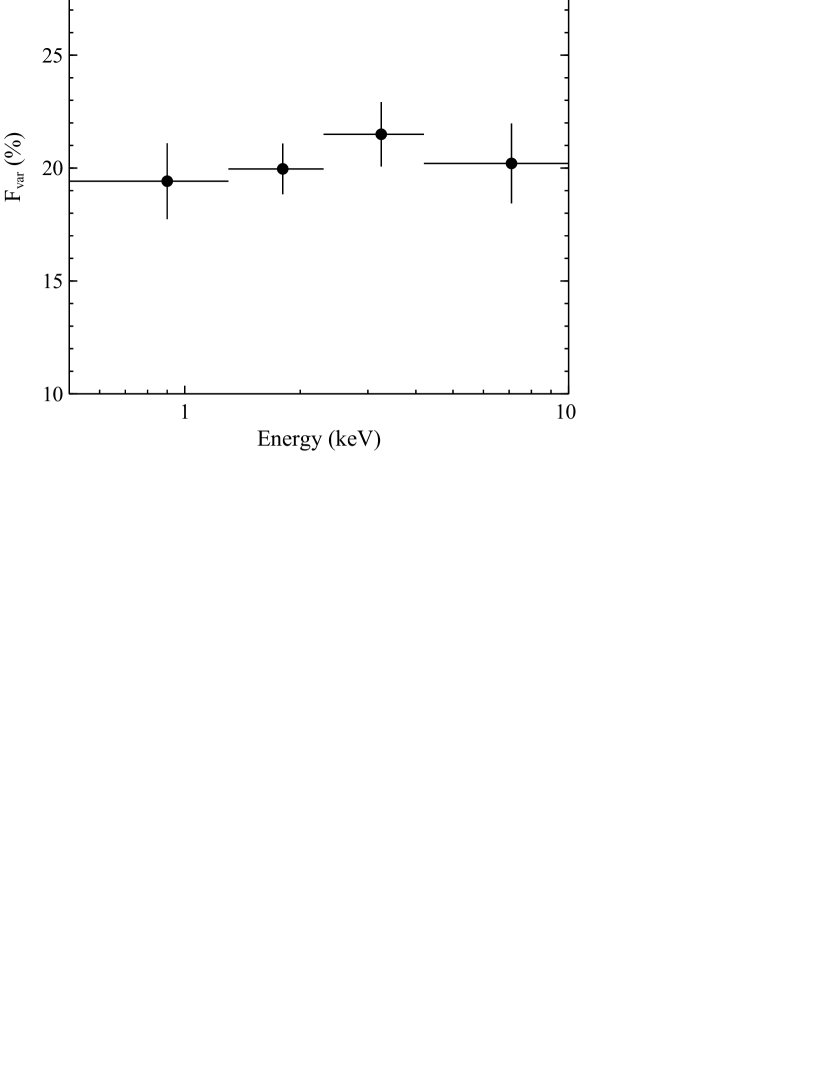
Given the unusual lack of the spectral features that have been so hotly debated in the literature, this observation of NGC 6814 provides the ideal testing ground to distinguish between some of the varying explanations for the hard lags seen in other AGN. In Fig. 2 we show the combined 0.5–10.0 keV XIS lightcurve, visibly demonstrating the variability displayed during this epoch. Despite this clear flux variability, the spectrum retains its simple powerlaw-like shape throughout. The fractional excess variability (Edelson et al. 2002; Vaughan et al. 2003) for full lightcurve (covering frequencies 1.2 Hz) does not display any significant energy dependence (see Fig. 3), as expected if the flux variability is dominated by a single component that does not strongly vary its spectral shape.
We therefore investigate the presence/behavior of any time lags displayed by NGC 6814 during this period, in order to provide a comparison with sources that display more complex X-ray spectra. To calculate the lag frequency-spectrum, we utilize the method introduced in Miller et al. (2010), and detailed in Zoghbi et al. (2013a), which is designed specifically for use with windowed time series, a result of the low-earth orbit of Suzaku. In brief, the method relies on maximizing the likelihood function. The model of the likelihood function is constructed from the cross-correlation function, whose input parameters are the lag values in pre-defined frequency bins (four in this case, giving the best balance between S/N and frequency resolution). The lag frequency-spectrum is inverse-Fourier transformed to give the cross-correlation function, which in turn is used to construct the time-domain covariance matrix of the light curve values, and hence the probability of obtaining the data given the model (i.e. the likelihood). The final result is then obtained by maximizing this likelihood. The energy ranges used here are 0.5–2.0 and 2.0–5.0 keV for the soft and hard bands, comparable to similar studies in the literature.

The lag frequency-spectrum obtained is shown in Fig. 4. At the lowest frequencies probed, the 2.0–5.0 keV emission lags behind the softer 0.5–2.0 kev emission by s. The detection of the hard lag is highly significant: the lowest frequency bin alone is inconsistent with zero lag at greater than the 6 level based on the obtained uncertainties, and the total deviation from zero lag towards lower frequencies is more than 8. A model of zero lag provides a very poor fit, with (null hypothesis probability of ; lag errors are Gaussian). We also show the lag energy-spectrum in Fig. 5, computed over the frequency range Hz and using the full 0.5–10.0 keV energy range as the reference band, which results in an offset of the lags obtained, but does not change the relative behavior. The lag relative to the softest band increases with increasing energy. All of this behavior is consistent with that reported for a variety of other AGN (McHardy et al. 2004; Papadakis et al. 2001; Vaughan et al. 2003; Kara et al. 2013b). Although the spectrum does not vary strongly, some weak pivoting must occur to produce the lags (Körding & Falcke 2004).
Finally, given our spectral results, we test whether distant reprocessing could produce the observed lags. Following Miller et al. 2010, we model the observed lag frequency-spectrum as arising from a simple tophat reverberation transfer function for the reflection, plus a delta-function for the continuum, both of which naturally contribute to the flux in both bands considered. The fractional contribution to the total hard band countrate from the reprocessed emission is conservatively set to the upper limit obtained previously (), while the soft contribution (limited to ) and the center and width of the tophat were allowed to vary. This model provides a very poor fit to the data (; ), severely underpredicting the low frequency lag; the maximum lag produced by the model can be made similar to that observed, but only by shifting the frequency at which this lag occurs outside the range probed observationally. Allowing additional complexity in the transfer function by allowing different tophat parameters for the soft and hard bands does not resolve this discrepancy. Instead, a much larger hard band contribution from the distant reflection is required to fit the lags, (90% confidence), roughly an order of magnitude greater than the upper limit obtained from spectroscopy. Furthermore, even if the FeXXVI emission arises from highly-ionised Compton reflection, such emission would contribute more flux in the soft band than the hard, while the opposite relative contribution is required to produce hard lags. We therefore conclude that any contribution from distant reflection cannot explain the observed lags.
5. Discussion and Conclusions
We have presented a combined spectral and temporal analysis of the recent Suzaku observations of the variable, unobscured AGN NGC 6814. Remarkably, the X-ray spectrum of NGC 6814 is well described simply with a basic powerlaw continuum. The source does not display any evidence for the soft excess typically displayed by other unobscured AGN (Gierliński & Done 2004; Crummy et al. 2006; Miniutti et al. 2009; Walton et al. 2013).
During this observation, NGC 6814 displayed significant variability. In order to provide a comparison with AGN that display more complex X-ray spectra, we investigated the presence and frequency dependence of any lags between the emission observed in the 0.5–2.0 and 2.0–5.0 keV energy bands, comparable to recent studies undertaken for AGN that display clear soft excesses. Similar to these sources, at low frequencies we find that the harder emission lags significantly behind the softer emission, despite their substantially different soft X-ray spectra (McHardy et al. 2004; Fabian et al. 2009, 2013). The natural conclusion is that these hard lags are associated with the intrinsic powerlaw-like continuum.
A variety of physical scenarios have been proposed to explain this energy- and frequency-dependent temporal behavior when seen in other accreting black holes: propagating accretion rate fluctuations (Arévalo & Uttley 2006), Comptonisation (Kazanas et al. 1997) and distant reverberation (Legg et al. 2012). Of these, only the former two associate the hard lags with the intrinsic continuum, while the latter associates them with a second emission component that arises through reprocessing of the intrinsic continuum by relatively distant material. However, we find that simple reverberation scenarios can be excluded, as the contribution of any distant reprocessing in NGC 6814 is too weak to produce the observed lags. Furthermore, we stress that the same hard lags are observed in Galactic BHBs, with sufficient data quality to allow detailed studies. The natural expectation is that these lags are produced by a common process. However, Kotov et al. (2001) also find the hard lags observed from Cygnus X-1 to be inconsistent with a distant reverberation origin, due to the lack of the expected iron feature in the lag energy-spectrum. Instead, Uttley et al. (2011) argue strongly in favour of the propagating fluctuations origin, based on the magnitude and energy dependence of the lowest frequency lags observed from Galactic BHBs. We therefore conclude this is also the likely origin of the lags in NGC 6814.
Although this dataset is not sensitive to high frequency variability, where the soft lags are seen for sources with soft excesses, our results most likely support the hypothesis that the soft and hard lags arise through separate physical mechanisms, as is strongly suggested by their differing lag energy-spectra (Zoghbi et al. 2011; Kara et al. 2013a). Indeed, our results are fully consistent with the interpretation of the soft lags associated with the soft excess as the signature of reverberation from the inner accretion disc, also implied by the more recent detections of similar reverberation lags from the broad component of the iron line in numerous AGN (e.g. Zoghbi et al. 2013b). In the few cases in which both the iron line and the soft excess are observed (i.e. bright, unobscured AGN), the lags inferred independently from the soft excess and the broad iron line are fully consistent (e.g. Kara et al. 2013a), highly indicative that both features originate from the same region of the accretion flow, and from a common physical process, which is most likely relativistic disk reflection.
ACKNOWLEDGEMENTS
The authors thank the reviewer for useful feedback. This research has made use of data obtained from the Suzaku observatory, a collaborative mission between the space agencies of Japan (JAXA) and the USA (NASA). CSR thanks support from NASA under grant NNX12AE13G
References
- Arévalo & Uttley (2006) Arévalo P., Uttley P., 2006, MNRAS, 367, 801
- Arnaud (1996) Arnaud K. A., 1996, in Astronomical Data Analysis Software and Systems V, edited by G. H. Jacoby & J. Barnes, vol. 101 of Astronomical Society of the Pacific Conference Series, 17
- Beloborodov (1999) Beloborodov A. M., 1999, ApJ, 510, L123
- Bentz et al. (2009) Bentz M. C., Walsh J. L., Barth A. J., et al., 2009, ApJ, 705, 199
- Brenneman et al. (2011) Brenneman L. W., Reynolds C. S., Nowak M. A., et al., 2011, ApJ, 736, 103
- Cackett et al. (2013) Cackett E. M., Fabian A. C., Zogbhi A., Kara E., Reynolds C., Uttley P., 2013, ApJ, 764, L9
- Crummy et al. (2006) Crummy J., Fabian A. C., Gallo L., Ross R. R., 2006, MNRAS, 365, 1067
- De Marco et al. (2013) De Marco B., Ponti G., Cappi M., et al., 2013, MNRAS, 431, 2441
- Edelson et al. (2002) Edelson R., Turner T. J., Pounds K., et al., 2002, ApJ, 568, 610
- Fabian et al. (2013) Fabian A. C., Kara E., Walton D. J., et al., 2013, MNRAS, 429, 2917
- Fabian et al. (2009) Fabian A. C., Zoghbi A., Ross R. R., et al., 2009, Nat, 459, 540
- Gallo et al. (2013) Gallo L. C., Fabian A. C., Grupe D., et al., 2013, MNRAS, 428, 1191
- George & Fabian (1991) George I. M., Fabian A. C., 1991, MNRAS, 249, 352
- Gierliński & Done (2004) Gierliński M., Done C., 2004, MNRAS, 349, L7
- Harrison et al. (2013) Harrison F. A., Craig W. W., Christensen F. E., et al., 2013, ApJ, 770, 103
- Kalberla et al. (2005) Kalberla P. M. W., Burton W. B., Hartmann D., et al., 2005, A&A, 440, 775
- Kara et al. (2013a) Kara E., Fabian A. C., Cackett E. M., Miniutti G., Uttley P., 2013a, MNRAS, 430, 1408
- Kara et al. (2013b) Kara E., Fabian A. C., Cackett E. M., Uttley P., Wilkins D. R., Zoghbi A., 2013b, MNRAS, 434, 1129
- Kazanas et al. (1997) Kazanas D., Hua X.-M., Titarchuk L., 1997, ApJ, 480, 735
- Körding & Falcke (2004) Körding E., Falcke H., 2004, A&A, 414, 795
- Kotov et al. (2001) Kotov O., Churazov E., Gilfanov M., 2001, MNRAS, 327, 799
- Koyama et al. (2007) Koyama K., Tsunemi H., Dotani T., et al., 2007, PASJ, 59, 23
- Legg et al. (2012) Legg E., Miller L., Turner T. J., Giustini M., Reeves J. N., Kraemer S. B., 2012, ApJ, 760, 73
- McHardy et al. (2004) McHardy I. M., Papadakis I. E., Uttley P., Page M. J., Mason K. O., 2004, MNRAS, 348, 783
- Miller et al. (2009) Miller L., Turner T. J., Reeves J. N., 2009, MNRAS, 399, L69
- Miller et al. (2010) Miller L., Turner T. J., Reeves J. N., Braito V., 2010, MNRAS, 408, 1928
- Miniutti et al. (2009) Miniutti G., Ponti G., Greene J. E., Ho L. C., Fabian A. C., Iwasawa K., 2009, MNRAS, 394, 443
- Mitsuda et al. (2007) Mitsuda K., Bautz M., Inoue H., et al., 2007, PASJ, 59, 1
- Mukai et al. (2003) Mukai K., Hellier C., Madejski G., Patterson J., Skillman D. R., 2003, ApJ, 597, 479
- Nardini et al. (2011) Nardini E., Fabian A. C., Reis R. C., Walton D. J., 2011, MNRAS, 410, 1251
- Nardini et al. (2012) Nardini E., Fabian A. C., Walton D. J., 2012, MNRAS, 423, 3299
- Papadakis et al. (2001) Papadakis I. E., Nandra K., Kazanas D., 2001, ApJ, 554, L133
- Reis et al. (2012) Reis R. C., Fabian A. C., Reynolds C. S., et al., 2012, ApJ, 745, 93
- Risaliti et al. (2013) Risaliti G., Harrison F. A., Madsen K. K., et al., 2013, Nat, 494, 449
- Ross & Fabian (2005) Ross R. R., Fabian A. C., 2005, MNRAS, 358, 211
- Takahashi et al. (2007) Takahashi T., Abe K., Endo M., et al., 2007, PASJ, 59, 35
- Tanaka et al. (1995) Tanaka Y., Nandra K., Fabian A. C., et al., 1995, Nat, 375, 659
- Turner et al. (2009) Turner T. J., Miller L., Kraemer S. B., Reeves J. N., Pounds K. A., 2009, ApJ, 698, 99
- Uttley et al. (2011) Uttley P., Wilkinson T., Cassatella P., et al., 2011, MNRAS, 414, L60
- Vasudevan & Fabian (2009) Vasudevan R. V., Fabian A. C., 2009, MNRAS, 392, 1124
- Vaughan et al. (2003) Vaughan S., Fabian A. C., Nandra K., 2003, MNRAS, 339, 1237
- Walton et al. (2013) Walton D. J., Nardini E., Fabian A. C., Gallo L. C., Reis R. C., 2013, MNRAS, 428, 2901
- Walton et al. (2012) Walton D. J., Reis R. C., Cackett E. M., Fabian A. C., Miller J. M., 2012, MNRAS, 422, 2510
- Walton et al. (2010) Walton D. J., Reis R. C., Fabian A. C., 2010, MNRAS, 408, 601
- Wilms et al. (2000) Wilms J., Allen A., McCray R., 2000, ApJ, 542, 914
- Xu et al. (1999) Xu C., Livio M., Baum S., 1999, AJ, 118, 1169
- Zoghbi et al. (2012) Zoghbi A., Fabian A. C., Reynolds C. S., Cackett E. M., 2012, MNRAS, 2570
- Zoghbi et al. (2013a) Zoghbi A., Reynolds C., Cackett E., 2013a, ArXiv e-prints
- Zoghbi et al. (2013b) Zoghbi A., Reynolds C., Cackett E. M., Miniutti G., Kara E., Fabian A. C., 2013b, ApJ, 767, 121
- Zoghbi et al. (2011) Zoghbi A., Uttley P., Fabian A. C., 2011, MNRAS, 412, 59