Muons in EAS with eV according to the data from Yakutsk array
Abstract
The lateral distribution of muons with threshold energy GeV have been studied in showers with energy eV. The data considered in the analysis have been collected from November 2011 to June 2013. Experimental values are compared to predictions obtained with the use of CORSIKA code within the framework of various hadron interaction models. The best agreement between experiment and theory is observed for QGSJETII-04 model. At eV it complies to a mixed cosmic ray composition with the mean atomic number . At eV the composition varies around the value .
pacs:
96.40.-z, 98.70.-fI Introduction
Ultra-high energy ( eV) cosmic rays (UHECR) are still remain a major scientific problem despite being studied worldwide by extensive air shower (EAS) arrays for good 50 years. Their mass composition is still not known exactly, and without this knowledge it is difficult to understand the character of nuclear interactions in this energy region. Muons with energy near GeV are very important component of EAS. They are poorly moderated in the atmosphere, are sensitive to the characteristics of nuclear interactions during development of a shower and to the chemical composition of cosmic rays (CR). Due to their yield and properties of lateral distribution they can be effectively registered with widely spaced ground arrays. Since 1978 Yakutsk EAS array has been continuously registering muons with the threshold energy GeV. During this period a large amount of experimental data has been accumulated. Analysis of this material (Glushkov et al., 1995, 1998, 2000; Glushkov, Pravdin et al., 2000; Glushkov et al., 2005; Glushkov & Pravdin, 2006) has revealed that the development of showers with eV differs significantly from those at lesser energies of CR. It also allowed us to estimate the fraction of primary gamma-quanta in the total CR flux at energies above eV (Glushkov et al., 2009).
Recently we have shown (Glushkov & Pravdin., 2012) that the muon fraction in the total number of charged particles in EASs with energies eV changes significantly over periods of time. Until 1996, it fluctuated around a single stable position and then increased significantly. This was accompanied by near simultaneous variations in the energy spectrum and in the global anisotropy of CR within energy range eV (Glushkov & Pravdin., 2012, 2013). After 1996, during the next 7 years, the integral intensity of CR at eV increased by % and then started declining. As for the phase of the first harmonic and its amplitude sampled during 1983-1994, they changed to values and during 1998-2010. In recent years, a tendency has been manifested towards the change of these values in the opposite direction. It seems like the effect of some gargantuan explosion which have contributed a significant portion of heavy nuclei to the background. It’s difficult to pinpoint exactly what kind of event in the Galaxy could led to such result. Here we need further studies involving temporal factor of the experimental data.
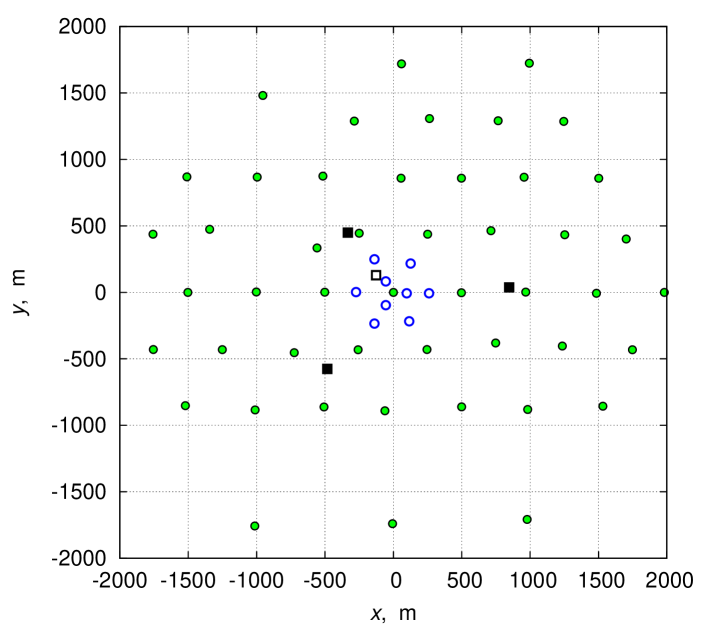
In this work we present the results of analyzes of muon data with GeV threshold collected during the period from November 2011 to June 2013. The geometry of the muon part of the array is shown on Fig.1. The work (Glushkov & Pravdin., 2012) describes the technique of their control and calibration. The data from the detector with GeV (Glushkov & Sabourov, 2013) are currently being accumulated and will be analyzed later.
II Results
Further we consider EASs with zenith angles and axes fallen within a km radius circle in the center of the array and with the precision of axis detection no less than m. The energy of primary particles was derived from relations:
| (1) |
| (2) |
| (3) |
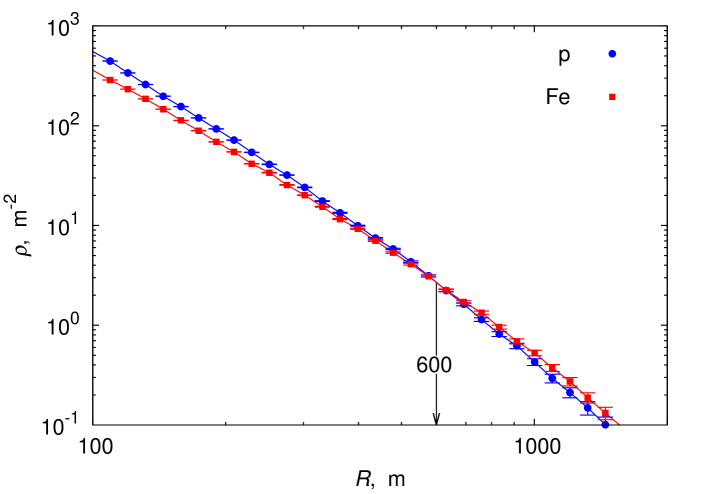
where is the density of charged particles as measured by surface scintillation detectors at m from a shower axis. The precision of estimation in individual showers was no worse than 10 %. The relation (1) unambiguously connects the with at any given CR composition. It is due to the fact that at the distance m from the axis, the lateral distribution functions (LDF) of all charged particles inter-cross each other. It is demonstrated on Fig.2 where two LDFs are shown, for charged particles in showers with eV and initiated by primary protons (blue circles) and iron nuclei (red squares) obtained with the use of QGSJETII-04 model (Ostapchenko, 2011). Values for were derived from the modified Linsley approximation (Linsley et al., 1962):
| (4) |
where is the Molier radius which depends on air temperature ( C) and pressure (, mbarn):
| (5) |
The value for is measured in each individual event (for Yakutsk C, m). In the expression (4) is the parameter defined in (Glushkov et al., 1976):
| (6) |
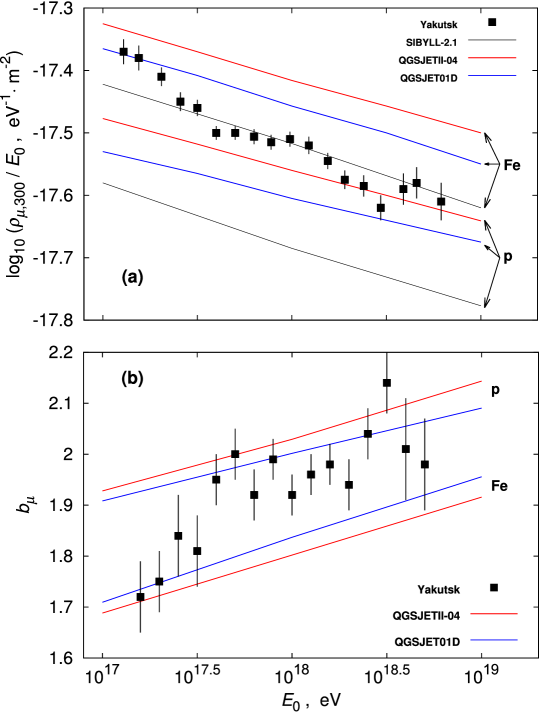
On Fig.3(a) with black squares are shown muon densities at the distance m from axis of showers within a considered group, with mean values of and . Normalization to primary energy gives a representation of muon data that is more descriptive and convenient for further analysis. Mean LDFs were obtained within energy bins with logarithmic step which were subsequently shifted towards higher energies by . This procedure was performed for a detailed test of an agreement between the experiment and various hadron interaction models. values were obtained from approximations of mean LDFs. When constructing an LDF, muon densities were multiplied by normalizing ratio and averaged over an energy cut in radial bins . Mean muon densities were determined from the expression
| (7) |
where and are the numbers of operated muon detectors at axis distances within the interval . The indexes denote whether a detectors had non-zero or zero readings during the registration of event. Zero readings are related to cases when a detector hasn’t registered any muons while being in a wait state. Mean LDFs were approximated according to functions (Glushkov, Pravdin et al., 2000):
| (8) |
with well-known relation by Greisen (1960):
| (9) |
where m, is a free parameter. The best fit values of , in (4) and , in (9) were determined with the use of minimization. Error bars on Fig.3(a) include the entire combination originated from statistics of events and averaging of the data. Lines represent expected values predicted by hadron interaction models QGSJETII-04 (red), QGSJET01D Ostapchenko et al. (1997) (blue) and SIBYLL-2.1 Engel et al. (2009) (black). Simulations were performed with the use of CORSIKA code Heck et al. (1998) (version 6.990 in the case of SIBYLL-2.1 and QGSJET01D and 7.3700 in the case of QGSJETII-04). 200 showers were simulated per each set of initial shower parameters (mass of primary particle, energy and zenith angle). To speed-up the computations, the thin-sampling algorithm was activated in the CORSIKA code with the parameters and depending on the primary energy Heck & Pierog (2013). The density was calculated directly from total number of particles arrived at a detector of given area.
It is clearly seen that the experiment is not consistent with SIBYLL at neither given composition; the model predicts significantly less muon yield. Other two models agree with our experiment much better and allow to estimate the mass composition of primary particles. To simplify, let us consider a two-component composition, consisting of protons and iron nuclei. In this case the relation
| (10) |
gives weighting functions and . Within the framework of this hypothesis, according to the QGSJET01D model we have:
| (11) |
where — are the values obtained in the experiment (exp) and in simulation.
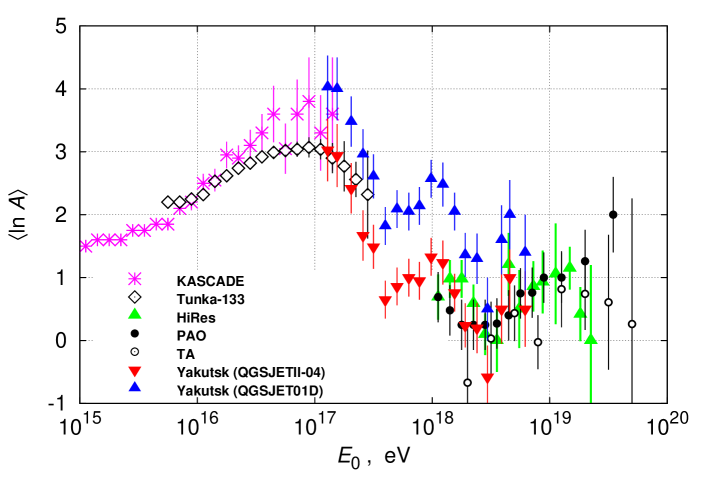
With red and blue triangles on Fig.4 are shown energy dependencies of CR mass composition according to predictions of QGSJETII-04 and QGSJET01D correspondingly. For comparison, on the same figure the data from various EAS experiments are shown. Purple stars denote the results of KASCADE obtained during the period from May 1998 to December 1999 Ulrich et al. (2001). White diamonds represent the data of Tunka-133 obtained from the LDF of Cherenkov radiation emitted by EAS during two winter observational periods (2009 - 2011) Berezhnev et al. (2012). Other values were derived from dependence established in experiments and simulations within the framework of QGSJET01 model, with the use of the expression (11) with substitution . With green triangles are shown HiRes data related to the observational period from November 1999 to September 2001 High Resolution Fly’s Eye (2005). Black circles — results from PAO obtained between December 2004 and September 2010 PAO collaboration (2011), open circles — interpretation of the Telescope Array data within the framework of QGSJETII model. TA (2013).
III Discussion

Results presented on Fig.4 give evidence that in energy region eV the CR composition probably changes rapidly towards lighter nuclei. Our data do not contradict this scenario. It is seen that QGSJETII-04 model better agrees with the experiment than QGSJET01D, especially in view of the works Glushkov & Pravdin. (2012, 2013), which have demonstrated that at eV the mass composition changes rapidly. Yet, it is still a bit premature to make a strong conclusion — both models predict similar shapes of muon LDFs and agree with experiment, as evidenced by the parameter of LDF’s steepness shown on Fig.3(b). Experimental values of this parameter confirm the above-mentioned hypothesis about lightening of the CR mass composition with the increase of primary energy. The LDFs obtained in simulations are well-described by the function (8) in a wide range of distances from a shower axis. It is demonstrated on Fig.5 where points represent LDF for muons with GeV threshold obtained with the use of QGSJET01D model for primary protons with eV and . Line is the approximation of (9) with steepness parameter found with weighted least square method. Similar picture is observed at other values of initial shower parameters (i.e. energy, zenith angle and composition).
Our estimations of based on the (10) do not differ drastically from other, more traditional method based on the (see e.g., Kampert & Unger (2011)):
| (12) |
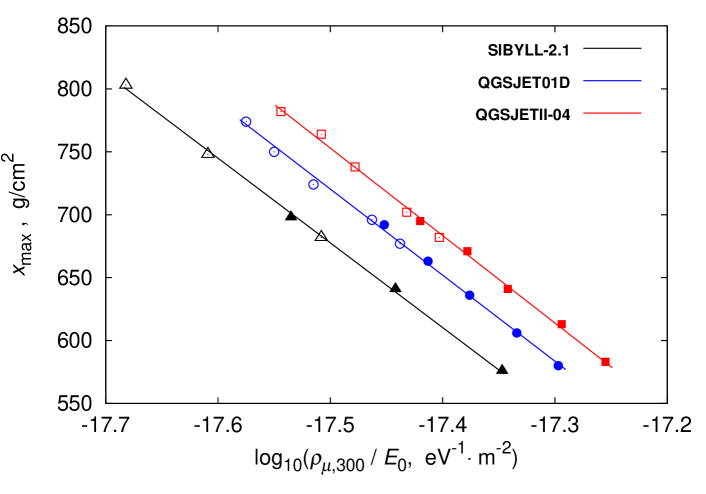
It is due to some peculiarity of EAS muons, which is demonstrated on Fig.6. It shows that within the framework of any shower development model, between the depth of maximum and the logarithm of muon density normalized to , there is a quasi-linear dependence at any composition of primary particles:
| (13) |
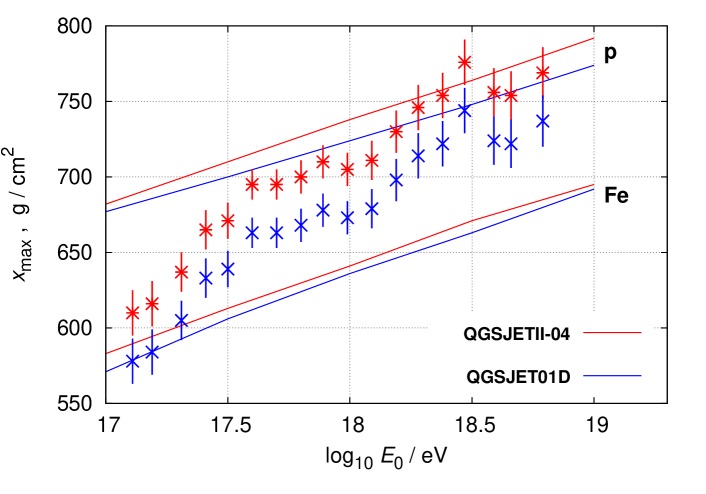
If one inserts (13) into (12), then (10) follows. The relations visualized on Fig.6 allow one to find from muon density normalized to primary energy. In our case, from the plot on this figure follow the dependencies shown on Fig.7. This method of extracting the depth of maximum from muon data, in our opinion, is comfortably simple and efficient from practical point of view. With sufficient statistics it is essentially a fully functional alternative to a technique of determination from the LDF of Cherenkov light radiation. It is possible to use different muon thresholds and distances from shower axis, where muon density is sampled.
IV Conclusion
The comparison of the Yakutsk array data to modern ultra-high energy interaction models has demonstrated once again the importance that this component presents for studying of shower development and CR mass composition. The results from Fig.3 demonstrate a certain degree of agreement between the experiment and QGSJETII-04 and QGSJET01D models on the whole energy range eV. Estimations of the mean CR mass composition from Fig.4 obtained within the frameworks of these models are close enough to worldwide data Ulrich et al. (2001); Berezhnev et al. (2012); High Resolution Fly’s Eye (2005); PAO collaboration (2011). The QGSJETII-04 model agrees with them better than QGSJET01D. Our data displayed on Fig.4 have added to the whole picture that testifies of a rapid change in the CR composition towards lighter nuclei in energy range eV. It cannot be ruled out that at there is a peak of local heaviness of CR composition. It is seen from Fig.5 that LDFs obtained from simulations are well-described by the approximation (8) within a wide range of distances from shower axis. This approximation is convenient for comparison between the experimental data and theoretical predictions as seen on Fig.3(b). Fig.6 suggests that muon component contains some possibilities yet to discover. In particular, it allows to relatively easy determine the depth of maximum EAS development (see Fig.7). We suppose that muons can play a vital role in the energy cross-calibration between world’s EAS arrays, where there is still no clarity in relation to correctness of any given method of estimating the energy of primary particle.
Acknowledgements.
The work was conducted with the financial support from Russian Academy of Science within the framework of research program “Fundamental properties of matter and Astrophysics” and is supported by RFBR grant # 13–02–12036 ofi-m-2013.References
- Glushkov et al. (1995) A. V. Glushkov, I. T. Makarov, E. S. Nikiforova et al. Astroparticle Physics, 4, 1274 (1995)
- Glushkov et al. (1998) A. V. Glushkov, V. B. Kosraev, I. T. Makarov et al. JETP Letters, 67, 383 (1998)
- Glushkov et al. (2000) A. V. Glushkov, I. T. Makarov, M. I. Pravdin et al. JETP Letters, 71, 97 (2000)
- Glushkov, Pravdin et al. (2000) A. V. Glushkov, M. I. Pravdin, I. Ye. Sleptsov et al. Physics of Atomic Nuclei, 63, 1477 (2000)
- Glushkov et al. (2005) A. V. Glushkov, L. G. Dedenko, I. Ye. Sleptsov. Physics of Atomic Nuclei, 68, 73 (2005)
- Glushkov & Pravdin (2006) A. V. Glushkov, M. I. Pravdin. JETP, 130, 831 (2006)
- Glushkov et al. (2009) A. V. Glushkov, I. T. Makarov, M. I. Pravdin et al. Phys. Rev. D, 82:041101 (2010)
- Glushkov & Pravdin. (2012) A. V. Glushkov, M. I. Pravdin. JETP Letters 95, 439 (2012)
- Glushkov & Pravdin. (2013) A. V. Glushkov, M. I. Pravdin. Astronomy Letters, 39, 65 (2013)
- Glushkov & Sabourov (2013) A. V. Glushkov, A. Sabourov. JETP Letters 97, 514 (2013)
- Ostapchenko (2011) S. Ostapchenko. Phys. Rev. D 83, 014018 (2011)
- Linsley et al. (1962) J. Linsley, L. Scarsi, B. Rossi. J. Phys. Soc. Japan, 17, Suppl. A-III, 91 (1962)
- Glushkov et al. (1976) A. V. Glushkov et al. Proc. Yakutsk: YaF SO AN SSSR, 45 (1976) (in Russian)
- Greisen (1960) K. Greisen. Ann. Rev. Nucl. Sci., 10, 63 (1960)
- Ostapchenko et al. (1997) N. N. Kalmykov, S. Ostapchenko, A. I. Pavlov. Nucl. Phys. B (Proc. Suppl.), 52B, 17 (1997)
- Engel et al. (2009) E.-J. Ahn, R. Engel, T. K. Gaisser et al. Phys. Rev. D 80, 094003 (2009)
- Heck et al. (1998) D. Heck, J. Knapp, J. N. Capdevielle et al. Report FZKA 6019 (1998), Forschungszentrum Karlsruhe, http://www-ik.fzk.de/corsika/physics_description/corsika_phys.html
- Heck & Pierog (2013) D. Heck, T. Pierog. Extensive Air Shower Simulation with CORSIKA: A User’s Guide, Version 7.37xx. Karlsruhe Institut für Technologie (2013).
- Ulrich et al. (2001) H. Ulrich, T. Antoni, W. D. Apel et al. Proc. 27th ICRC, 2, 97 (2001)
- Berezhnev et al. (2012) S. F. Berezhnev, D. Besson, A. V. Korobchenko et al. arXiv:astro-ph.HE/1201.2122v1
- High Resolution Fly’s Eye (2005) R.U. Abbasi, T. Abu-Zayyad, G. Archbold et al. Astrophys. J. 622 910-926 (2005)
- PAO collaboration (2011) P. Abreu, M. Aglietta, E. J. Ahn et al. arXiv:astro-ph.HE/1107.4804v1
- TA (2013) E. Barcikowski, J. Bellido, J.Belz et al. EPJ Web of Conferences 53, 01006 (2013)
- Kampert & Unger (2011) K.-H. Kampert and M. Unger. arXiv:astro-ph.HE/1201.0018v2