Accretion disk and ionized absorber of the 9.7-hour dipping black hole binary MAXI J1305704
Abstract
We report the results from X-ray studies of the newly discovered black hole candidate MAXI J1305-704 based on Suzaku and Swift observations in the low/hard and high/soft states, respectively. The long Suzaku observation shows two types of clear absorption dips, both of which recur on a dip interval of hours, which we identify with the orbital period. There is also partially ionized absorption in the non-dip (persistent) emission in both the high/soft state and, very unusually, the low/hard state. However, this absorption (in both states) has substantially lower ionization than that seen in other high inclination systems, where the material forms a homogeneous disk wind. Here instead the absorption is most probably associated with clumpy, compact structures associated with the dipping material, which we see uniquely in this source likely because we view it at a very large inclination angle. A large inclination angle is also favored, together with a low black hole mass, to explain the high disk temperature seen in the fairly low luminosity high/soft state, as Doppler boosting enhances the disk temperature at high inclination. The disk radius inferred from these data is significantly smaller than that of the soft component seen in the low/hard state, supporting models where the disk is truncated at low luminosities. We find, however, that the lack of variability power on time scales of sec in the Suzaku low/hard state data is difficult to explain, even with a low mass black hole.
Subject headings:
accretion, accretion disks — black hole physics — line: profiles — X-rays: binaries — X-rays: individual(MAXI J1305704)I. Introduction
Transient black hole X-ray binaries (BHXBs) are the best laboratories to study the physics of the accretion flow in a wide range of the mass accretion rate. They make drastic changes in spectral properties during their outburst while exhibiting orders of magnitude increase and decrease of their X-ray luminosity, suggesting that the geometry of inner disk differs significantly according to the mass accretion rate (e.g., McClintock & Remillard, 2006; Done et al., 2007, and references therein). In low X-ray luminosity phases, they show a relatively hard, power-law shaped spectrum with a photon index of less than 2.0 and an exponential cutoff at 100 keV, which is generally interpreted as the disk emission Comptonized by thermal electrons in the surrounding corona. This state is called “low/hard state”, in which the inner part of standard disk (Shakura & Sunyaev, 1973) is thought to be truncated. Following the rapid increase of the X-ray luminosity in outbursts, they undergo a state transition to the so-called “high/soft state” typically at a mass accretion rate of ( is the Eddington Luminosity: , where , , , , and represent the gravitational constant, proton mass, speed of light, black hole mass, and Thomson scattering cross-section, respectively), in which the soft X-ray flux is dominated by thermal emission from the standard accretion disk. Many previous studies showed that the inner disk radius stays constant during the high/soft state (see e.g., Ebisawa et al., 1993). This suggests that the disk extends down to the inner most stable circular orbit (hereafter ISCO) in the high/soft state.
The properties of fast time variabilities are also remarkably different between the low/hard state and the high/soft state. In the low/hard state, BHXBs show noisy light curves on time scales of up to hundred seconds. Their power density spectra (PDSs) are roughly characterized with the so-called band limited noise with flat profile in the spectrum () within the low and high frequency break, below and above which the power declines as and , respectively. This noise profile is better described as a superposition of multiple Lorentzians (Belloni et al., 1990; Nowak, 2000; Belloni et al., 2002). Negoro et al. (2001) reported that these structures are reproduced by the superposition of “shots” (flare like events) seen in the low/hard state light curve, which are thought to be related to density fluctuation of advection-dominated accretion flow inside the inner edge of the standard disk (e.g., Manmoto et al., 1996). In contrast, rapid variability is typically weak in the high/soft state, where the constant standard disk emission dominates the X-ray flux (e.g., Homan et al., 2001). The low-frequency break of the band-limited noise seen in the low/hard state moves toward higher frequencies as the X-ray luminosity increases, and the profile of PDS is smoothly connected to those in the high/soft state through the intermediate or very high state (van der Klis, 2004; Axelsson et al., 2005). These characteristics support the idea that the standard disk is truncated and the inner edge moves inward to reach ISCO as the luminosity increases (Ingram & Done, 2012).
BHXBs with a relatively high inclination angle are particularly interesting objects because they give us key information to uncover the structure of the outer accretion disk. In the high/soft state, these sources often exhibit highly ionized blue-shifted absorption lines that originate in the “disk wind” outflowing from the outer region of the accretion disk (e.g., Ueda et al., 1998; Kotani et al., 2000; Miller et al., 2006a; Kubota et al., 2007; Ponti et al., 2012). Importantly, the mass loss rate of a disk wind is comparable with or even several to a few dozens times larger than the mass accretion rate (Ueda et al., 2004; Neilsen et al., 2011), which suggests that the disk wind would also affect the properties of inner region of the disk and play a critical role on accretion disk physics.
High inclination X-ray binary systems often show quasi-periodic dips accompanied by spectral hardening in their light curves. It is generally believed that the dips are caused by absorption of the X-ray emission from the central source with dense structure in outer disks such as the “bulge”, which is formed by the accretion stream from the companion star impacting the rim of the disk (see e.g., White & Swank, 1982). Previous studies showed that dipping spectra are well reproduced by a partial absorption by neutral material (e.g., Marshall et al., 1993). While this approach was successfully applied in many sources including both neutron star and black hole X-ray binaries, another explanation has recently been proposed; Boirin et al. (2005) and Díaz Trigo et al. (2006) successfully described both non-dipping and dipping spectra of neutron-star low mass X-ray binaries, using a single photo-ionized absorption model with different column densities and ionization parameters. It is suggested that absorption dips are generally caused by ionized gas of lower ionization state and higher column density than the disk winds (see section 5.2).
MAXI J1305704 is an X-ray transient discovered on 2012 April 9 (Sato et al., 2012) with MAXI/GSC (Monitor of All-sky X-ray Image/Gas Slit Camera; Matsuoka et al., 2009). The monitoring results with the GSC suggest that the source is likely a black hole X-ray binary, as its hardness-intensity diagram showed a q-shaped hysteresis over the whole outburst and the spectrum during the soft phase is well modelled with thermal emission from the standard disk like those of typical BHXBs in the high/soft state (Morihana et al., 2013). A lot of follow-up observations were triggered in X-ray and other wavelengths. Multiple Swift X-ray Telescope (XRT) observations discovered dips in the X-ray light curves, whose interval has been however still controversial; 1.5 hours and 2.7 hours were suggested by Kennea et al. (2012) and Kuulkers et al. (2012). Swift/XRT also detected strong ionized absorption lines, likely originated in the disk wind (Miller et al., 2012a). Chandra HETGS discovered complex absorption feature around 1 keV, which can be reproduced by ionized iron-L absorption lines (Miller et al., 2012b). Those dips and absorption profiles strongly indicate that the source has a large inclination angle, although the precise value is not determined yet. The optical and near infrared counterparts were also detected in the observations performed about a few days after the start of the outburst (Greiner et al., 2012).
In this paper, we present the results of a Suzaku TOO (Target of Opportunity) observation of MAXI J1305704 performed during the low/hard state to investigate the detailed properties of the accretion flow, dips, and ionized absorbers in a low mass accretion rate. The data obtained from a Swift/XRT observation during the high/soft state are also analyzed to be compared with the Suzaku results. In addition, we report the near infrared observations with the 1.4m telescope of Infrared Survey Facility (IRSF) performed quasi-simultaneously with the Suzaku observation and in an earlier epoch when MAXI J1305704 was in the high/soft state. Errors represent the 90% confidence range for a single parameter in the following sections. We refer to the table by Anders & Grevesse (1989) as the solar abundances throughout the paper.
II. X-ray Observation and Data Reduction
II.1. Suzaku Observation in the Low/hard State
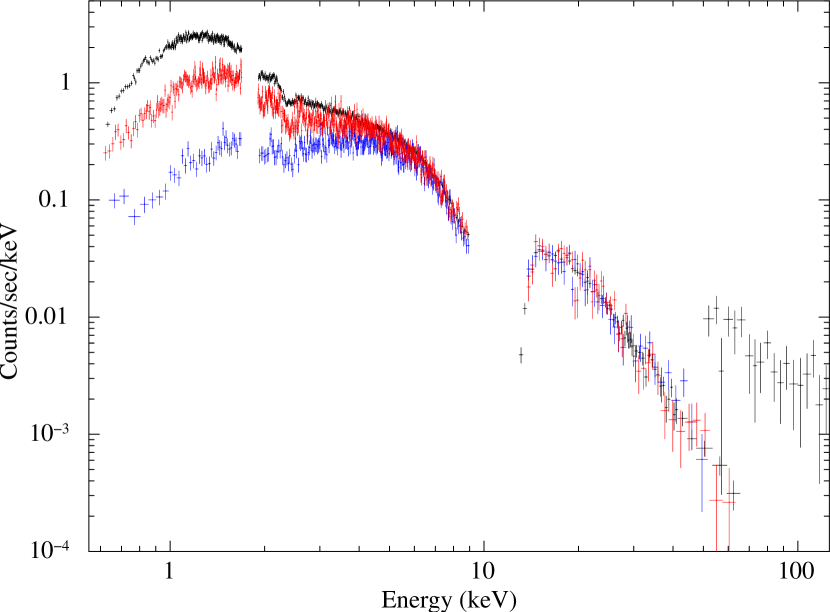
We observed MAXI J1305704 with Suzaku (Mitsuda et al., 2007) from 2012 July 20 18:10:29 (UT) to 22 00:30:23 for a net exposure of 40 ksec. This was carried out as a TOO observation based on the monitoring by MAXI/GSC. Suzaku carries X-ray CCD camera called the X-ray Imaging Spectrometer (XIS), operated in the energy range of 0.2–12 keV, and a non-imaging collimated instrument called the Hard X-ray Detector (HXD), which consists of PIN silicon diodes sensitive to 10–70 keV and gadolinium silicon oxide (GSO) crystal scintillators covering 40–600 keV. The XIS consists of two frontside-illuminated (FI) chips (XIS-0 and XIS-3) and a backside-illuminated (BI) chip (XIS-1), which has a larger effective area than the FI chips below 1.5 keV and a higher sensitivity to low energy X-rays. In this observation, the 1/4 window option was employed for the XIS. The actual observed count rate was 5 counts sec-1 on average, which is low enough that we can ignore any effects by pileup. The Suzaku observation (MJD 56128–55130) corresponds to the period after the spectral hardening at the end of the outburst in 2012 June (Morihana et al., 2013), suggesting that the source was in the low/hard state in our observation.
We utilized the cleaned event data produced by the pipeline processing version 2.7.16.33, and reduced them with HEASOFT version 6.12 and Calibration Database (CALDB) released on 2012 October 5. The source events of the XIS were extracted from a circular region centered on the source position with a radius of 1.9’. The background was taken from a circular region with the same radius in a source-free area. For the non X-ray background of the HXD, we used the modelled background files provided by the Suzaku team. The modelled spectrum of the cosmic X-ray background was subtracted from the PIN data, but not from the GSO data, because its contribution is less than 0.1% of the total background rate of the GSO111http://www.astro.isas.ac.jp/suzaku/analysis/hxd/gsonxb/. The PIN and GSO data were corrected for the dead time with hxddtcor. The XIS response matrix and ancillary response files were created with the xisrmfgen and xissimarfgen, respectively, to be used in our spectral analysis. We utilized ae_hxd_pinxinome11_20110601.rsp as the response file of PIN, and ae_hxd_gsoxinom_20100524.rsp and ae_hxd_gsoxinom_crab_20100526.arf 222http://www.astro.isas.ac.jp/suzaku/analysis/hxd/gsoarf2/ as those of GSO. We combined the spectra and response files of the FI-XISs (XIS-0 and XIS-3) to improve statistics. The data in the 1.7–1.9 keV band were always ignored in the spectral fits due to the systematic uncertainties in the instrumental Si-K edge. A 1% systematic error was included in each bin of the XIS and HXD spectra to account for possible calibration uncertainties.
The spectra of the FI-XISs, BI-XIS, and HXD were simultaneously
fitted in the spectral analysis. The cross-normalization
of the HXD with respect to the FI-XISs was fixed at
1.16333http://www.astro.isas.ac.jp/suzaku/doc/suzakumemo/suzaku
memo-2008-06.pdf.
We corrected for cross-calibration errors in the energy
responses between the FI-XISs and BI-XIS, as we found that our
FI-XIS data resulted in significantly harder spectra than
the BI-XIS ones from the individual spectral analysis, probably
due to uncertainties in modelling the contamination on the
XIS window filters.
To examine trends of these uncertainties in the period near our
observation, we analyzed two Suzaku archival data of the
blazar PKS 2155304 observed on 2012 April 27-29 and October 30-31,
both of which were operated with the same (1/4) window option.
We created time-averaged FI-XIS and BI-XIS spectra separately
for the two epochs, using the same versions of HEASOFT and CALDB as
those applied in the analysis of the MAXI J1305704 data.
The spectra were fitted with an absorbed power-law model, in which
the photon indices were linked between the FI-XIS and BI-XIS data.
We found that the FI-XIS spectra show larger than the
BI-XIS ones by cm-2 and
cm-2 in the April and
October observations, respectively. Similarly, for the case of
MAXI J1305–704, we estimated difference of
cm-2. To account for this offset,
we unlinked the column density of the neutral absorption along with
the flux normalization between the FI-XIS and BI-XIS spectra in the
simultaneous fit.
In the following section we show the column density obtained from
the BI-XIS spectrum as the best estimated value.
The inclusion of this correction is found to significantly improve
the quality of the fit, although it does not affect the conclusion
of this paper.
MAXI J1305704 is located near a bright source 4U 1254690 with a separation angle of 1.41∘ and the GSO flux can be contaminated by the emission from this nearby source (Takahashi et al., 2007). However, we confirmed that the contamination is completely negligible as the source is more than several orders of magnitude fainter than our target above 50 keV by considering the previous spectral study of 4U 1254690 (Díaz Trigo et al., 2009).
II.2. Swift/XRT Observations in the High/soft State
Since its discovery, MAXI J1305704 was observed with Swift/XRT many times. In order to compare the Suzaku data in the low/hard state with Swift ones in the high/soft state, we analyzed the data of Swift/XRT obtained from 2012 April 19 13:19:53 to 21 17:03:00 (UT). This is one of the longest ( 10 ksec) Swift/XRT observations for this source in the high/soft state. Using this dataset, Miller et al. (2012a) reported the existence of a strong iron-K absorption line around 6.6 keV. In this observation, XRT was operated with the 1-dimensional Window Timing mode. The data are not affected by pile-up, because the averaged count rate ( counts sec-1) is much lower than the maximum pileup-free count rate (100 counts sec-1; Romano et al., 2006).
We used Swift/XRT archival data and performed the standard reduction
with xrtpipeline. The source events were extracted from a box
region of 40 pixels 30 pixels along with the X- and Y-axis in
the detector coordinates, respectively, with the center located at the
target position. The background region was defined as two boxes of 40
pixels 30 pixels in the source-free area at the same distance
from the target position. We included 3% systematic error in each
spectral bin to absorb possible calibration
uncertainty444http://heasarc.gsfc.nasa.gov/docs/heasarc/caldb/swift/docs/
xrt/SWIFT-XRT-CALDB-09_v16.pdf.
We utilized a response matrix file, swxwt0to2s6_20010101v014.rmf, taken from
the Swift CALDB provided on 2012 October 5. The ancillary response
file is created by using xrtmkarf with the exposure file
produced in the pipeline tool.
III. Analysis and Results
III.1. Suzaku light curve and dip feature
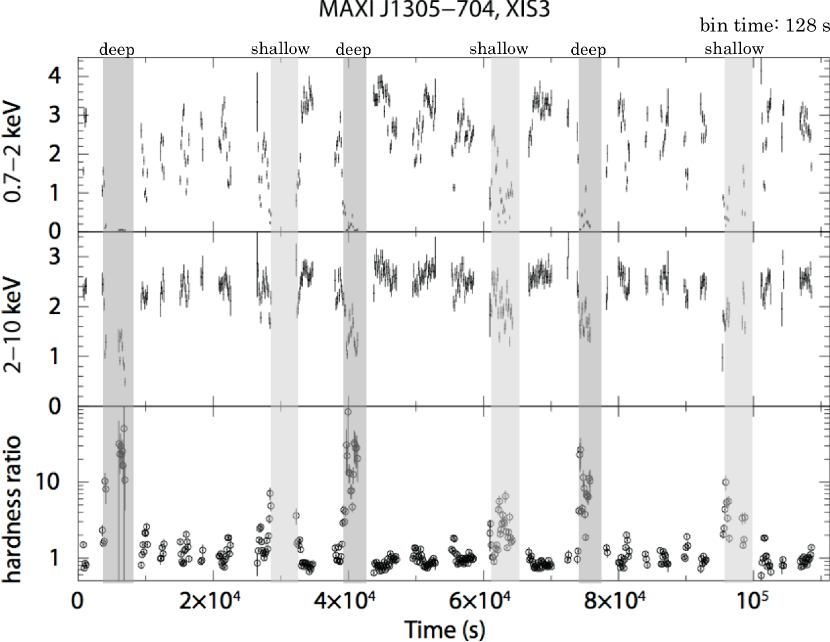
Figure 1 shows the Suzaku XIS-3 light curves in the soft (0.7–2 keV) and hard (2–10 keV) bands together with their hardness ratio in 128 sec binning. The light curve is highly variable particularly in the soft band, suggesting that the variability is mainly caused by absorption. We can see two dipping features with different mean hardness ratios (5–10 for the softer ones and 20–30 for the harder ones), in which more than 80% of the averaged flux is lost in the soft band, and those dips with similar mean hardness ratios are observed almost periodically. Here we define the start and end times of the dips as the points at which the hardness ratio crosses a value to 2.6 upward and downward in Fig. 1. We then call the dips whose peak hardness ratios reach 20 in 128 sec binning as “deep dips” and the other softer ones as “shallow dips”. In shorter time scales, the shallow dips have small variabilities with typical time scale of a few minutes, while this behavior is not significant in the deep dips (Figure 2).


We find each dip recurrently occurs with a period of 9.74 0.04 hours, which is calculated from the intervals of the start times of deep dips obtained in the XIS-3 hardness ratio with 64 sec bin. The error is estimated by propagating the uncertainty of each measured start time, which is assumed as half width of time bins in the light curve (32 sec). This interval, instead of 1.5 or 2.7 hours suggested by Swift/XRT observations with shorter exposure (Kennea et al., 2012; Kuulkers et al., 2012), likely corresponds to the orbital period. The light curves have data gaps with durations of 0.8–1.1 hours, which are not exactly periodic. The durations of the deep and shallow dips (1.0–1.7 hours) are comparable or larger than those of the data gaps. Because the hardness ratio never exceeds 2.6 outside of the dip phases we identified, it is unlikely that the actual period is shorter than 9.74 hours and we miss other dip events in these data gaps. We also note that dips do not always appear precisely in the same orbital phase, and the interval between the first and second deep dips actually 50 sec longer than that of second and third deep dips, when we measure them from the light curve with shorter time bins. The interval from a deep dip to the next shallow dip is derived to be hours, which is obtained by averaging the intervals between the beginning of deep dips and those of the following shallow dips. The durations of the deep and shallow dips, however, are not precisely constant, and consequently their intervals are slightly different event by event.
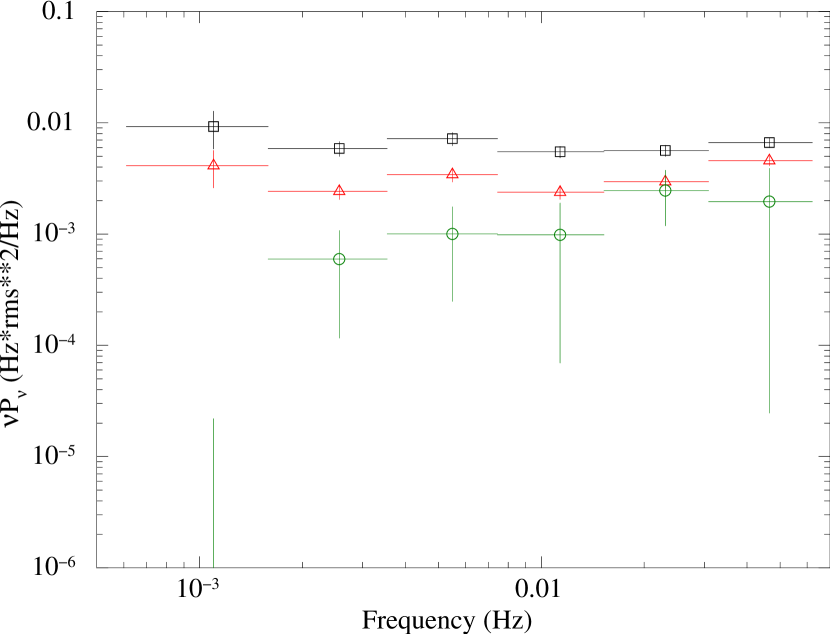
Figure 3 shows the normalized power density spectra in the non-dip phases in the 0.7–1 keV, 1–5 keV, and 5–10 keV bands, calculated from the combined light curve of all three XISs with 8 sec bins. We find that the softer energy band has much larger power than those of the harder bands in the frequency range of to Hz. This suggests that the power is likely dominated by the residual variability of absorption that exists even outside the dips. The source has only small intrinsic power ( rms2/mean2) in the 5–10 keV band, where the flux variabilities are little affected by absorption. Thus, this frequency region is likely below the low frequency break of the band-limited noise observed from BHXBs in the low/hard state.
III.2. Modeling time-averaged non-dip spectrum
We extract the time-averaged XIS and HXD spectra in the deep dip, shallow dip, and non-dip phases and analyze them separately. In this subsection we concentrate on the non-dip spectra. We utilize the energy bands of 0.7–9.0 keV, 0.7–8.0 keV, 12–70 keV, and 50–130 keV for FI-XISs, BI-XIS, HXD/PIN, and HXD/GSO, respectively, where the signal-to-noise ratios are sufficiently good and the calibration is the most reliable.
| Component | Parameter | non-dip | deep dip | shallow dip |
|---|---|---|---|---|
| phabs | ( cm-2) | |||
| xsabs | ( cm-2) | |||
| blue shift (km)ccPositive values represent blue shifts. | ||||
| covering fraction | 1 (fix) | |||
| diskbb | (keV) | |||
| norm | ||||
| nthcomp | ||||
| (keV) | (fix) | |||
| norm | ||||
| reflect | ||||
| (deg) | 75 (fix) | |||
| gauss aaThe normalization of Gaussian component is linked to the reflection strength of the reflect model so that the equivalent width with respect to the reflection continuum is 1.0 keV. | (keV) | 6.4 (fix) | ||
| (eV) | 10 (fix) | |||
| flux 55footnotemark: 5b |
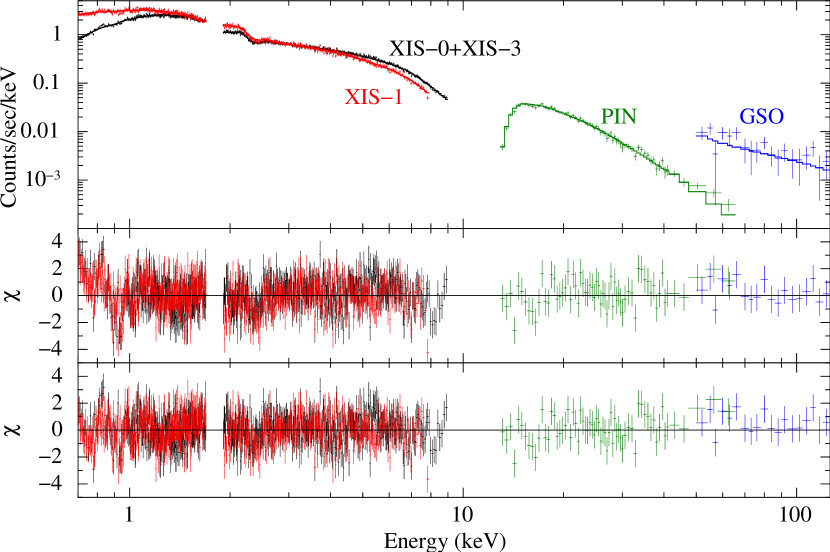
The non-dip spectrum is roughly characterized by a power-law component extended up to 130 keV with a photon index of (), although we find broad depressions around 0.75 keV and 0.9 keV. These structures likely correspond to the photoelectronic absorption lines and/or edges of highly ionized oxygen-K and iron-L shells, which are similar to “warm absorbers” seen in many active galactic nuclei like MCG-6–30–15 (e.g., Nandra & Pounds, 1992; Fabian et al., 1994) and NGC 4051 (e.g., Pounds et al., 1994; Mihara et al., 1994). The hard spectral shape suggests that the source stayed in the low/hard state during our observation. The exponential cutoff is not detected within the energy band of the non-dip spectrum ( keV), and therefore in the following analysis, we fix the cutoff energy at 300 keV, which is within the typical value observed from BHXBs in the low/hard state ( keV; see e.g., Tanaka & Shibazaki, 1996).
To investigate the detailed properties of the accretion flow and the ionized absorber, we next analyze the non-dip spectrum with a more sophisticated model. Following the general description of the X-ray spectrum in the low/hard state (e.g., Gierliński et al., 1997), we adopt a model composed of the multicolor disk (MCD) emission and its thermal Comptonization. The nthcomp model (Zdziarski et al., 1996; Zycki et al., 1999) and the diskbb model (Mitsuda et al., 1984) are employed to represent the Comptonization and direct emission from the disk, respectively. We assume that all the seed photons for the Comptonized component are produced by the disk, and link the seed temperature of the nthcomp model to the inner disk temperature of the MCD component. We add phabs as interstellar absorption, assuming the solar abundance. To consider reflection of Comptonized photons on the disk, we convolve the nthcomp component with the reflect model. This model calculates a reflected spectrum from neutral material (Magdziarz & Zdziarski, 1995)666We examine the ionization level of the reflector utilizing the ireflect model, an ionized version of reflect, but the ionization parameter () is not constrained at all. We obtain the minimum reduced chi-squared in the case of a neutral reflector ().. The reflect model does not contain the iron K emission line, whose equivalent width is keV with respect to the reflected continuum, as suggested by numerical calculations (e.g., Matt et al., 1991). Hence, we add a Gaussian component as the iron-K emission line and fix the line energy and the line width at 6.4 keV and 10 eV, respectively. The normalization of Gaussian component is linked to the reflection strength of the reflect model so that the equivalent width with respect to the reflection continuum is 1 keV (e.g., Matt et al., 1991)777We first fitted with the strength of the Gaussian unlinked with that of the reflection continuum. However, the upper limit of the line flux was found to be unreasonably small, an order of magnitude lower than what is expected from the equivalent width with respect to a reflection continuum ( 1 keV). . The reflection spectrum is smeared with kdblur, which calculates relativistic effects from an accretion disk around a rotating black hole using the results of Laor (1991). We assume a inclination angle of 75∘ (see Section 5.1) and the index for the radial dependence of emissivity (, where emissivity ) of , and an outer radius of 400 ( represents the gravitational radius, ). The inner radius is first left as a free parameter but it is totally unconstrained. We therefore fix the inner radius at 100 in the following spectral fits. The energy range for the model calculation is extended to 0.1–1000 keV to apply the convolution models.
To analyze the ionized absorption features, we create a photoionized absorption model with the spectral synthesis code XSTAR version 2.2.1bk, assuming that the ionized absorber has the solar abundances and that its turbulent velocity is 300 km sec-1. This model can be used in XSPEC as an multiplicative component with free parameters of the equivalent hydrogen column density (), ionization parameter (, where , , and represent the ionizing flux in the energy range of 1–1000 Ry (Rydberg unit; 1 Ry 13.6 eV), the number density of hydrogen nuclei, and the distance from the X-ray source to absorber, respectively), and the Doppler shift. The absorption spectra calculated with XSTAR depend on the spectral shape of the incident radiation on the absorber. We first adopt a single power-law model with a photon index of 1.6 as the input spectrum for XSTAR and fit the resulting model to the non-dip spectrum. Next, we re-create an XSTAR absorption model using the best-fit unabsorbed continuum model and then refit the spectrum with the newly obtained absorption model. These steps are performed in an iterative manner, until the parameters of the continuum model become identical with those obtained in the previous iteration within the ranges of 90% errors. In the following, we show the final best-fit results after the iteration.
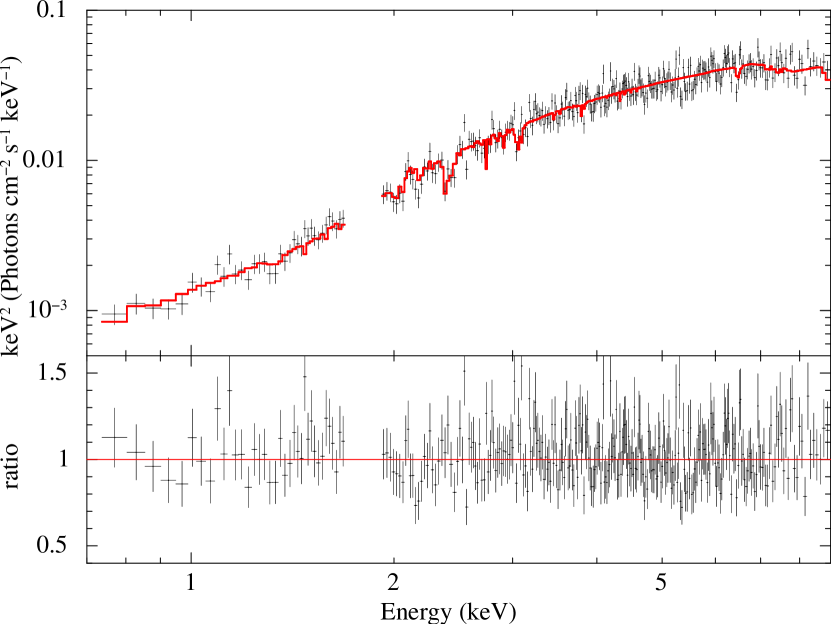
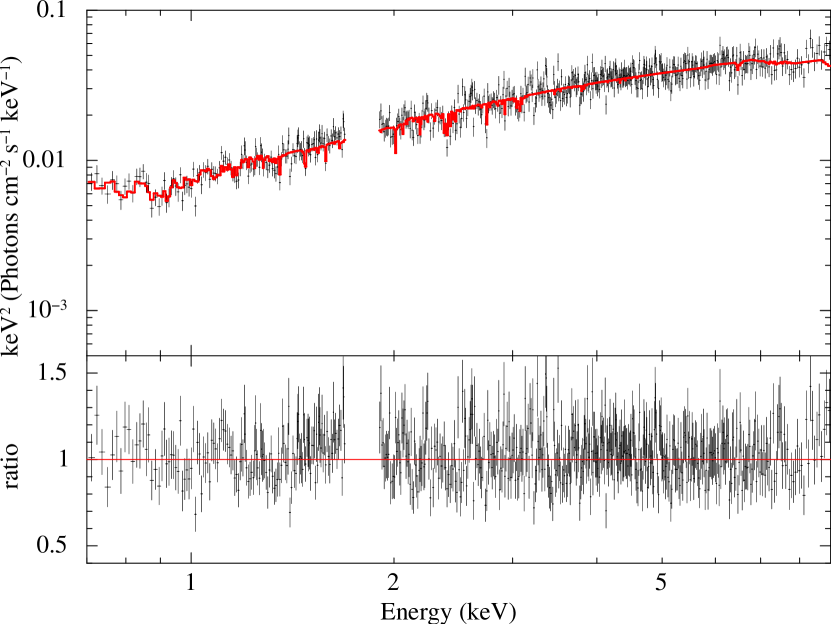
The final fitting model is thus expressed as phabs*
xsabs*(diskbb+kdblur*(gaussian+reflect*nthcomp)), where xsabs represents the XSTAR ionized absorption model. The spectra and
the best-fit model are shown in Figure 4 and
Figure 5, and the
resulting parameters are given in Table 1.
We find that this model describes the Suzaku spectra reasonably well,
with . The fit quality is improved
from that of the power-law model with an F-test probability of
. The ionization parameter and column
density are estimated as and cm-2 for the ionized
absorber, respectively. The Doppler shift is not
detected with an upper limit of km sec-1. A small inner
disk temperature ( keV) and a large
normalization of the MCD model () are
obtained, which suggest that the standard disk is truncated (see
Section 5.3) during the Suzaku observation. The hydrogen column
density of neutral absorption, cm-2,
is comparable to the total Galactic column in the
direction of MAXI J1305704 ( cm-2),
estimated from the HI all-sky map by Kalberla et al. (2005) by utilizing the
nh ftool.
Recent Suzaku observation of BHXBs in the low/hard state have revealed that the Comptonized plasmas are more complex than a single-zone homogeneous structure. Takahashi et al. (2008), Makishima et al. (2008), and Shidatsu et al. (2011) reproduced the time-averaged spectra with double Comptonization components that have different optical depths. Furthermore, Yamada et al. (2013) successfully separated the second variable component from the Suzaku spectra of Cyg X-1 in the low/hard state by considering timing information. Here we investigate whether or not these complex structures are also detected in MAXI J1305704. We add another nthcomp component to the single nthcomp model to consider the double Comptonization corona. The seed temperatures of the two nthcomp models are linked to the inner disk temperature of the MCD component. We find, however, that this “double nthcomp” model does not improve the fit.
III.3. Analysis of Dip spectra
We analyze the deep and shallow dip spectra with the same model that
used for the non-dip spectrum. Figure 6 compares the
XIS and HXD spectra in the deep dip, shallow dip, and non-dip
phases. We obtain the HXD/PIN spectrum up to 60 keV for the shallow
dip and to 50 keV for the deep dip. The HXD/GSO data in the dips are
not usable due to the limited photon statistics, however. We employ
the final results described in the previous section and fix all the parameter
at the best-fit value of the non-dip spectrum, except for those of the
neutral and ionized absorption components. Considering
that dipping spectra often modelled with partial absorbers, we
introduce a covering fraction of the ionized absorber. The total
fitting model for the dip spectra is described as phabs*(f*xsabs+(1-f))*(diskbb+kdblur*(gaussian
+reflect*nthcomp)),
where f corresponds to the covering fraction.
This model successfully reproduce the dip spectra, yielding , and for the deep and shallow dips, respectively. We find that the two dip spectra can be described with more than one order of magnitude larger column densities and about a factor of 2 smaller ionization parameters than those of the non-dip spectrum. The column density of the deep dip is twice as much as that of shallow dip. The covering fraction is estimated as for the shallow dip, while the deep dip spectrum is almost totally absorbed, with . The resulting parameters are listed in Table 1 and the best-fit spectra are plotted in Figure 7.
The xsabs model do not include the Comptonization in the ionized absorber itself. This might affect the fits particularly for the deep dip spectrum, in which the ionized absorber has relatively large column density ( cm-1). To account for the possible effects of Compton scattering, we add the cabs model to the final model with its column density linked to that of the ionized absorber, and re-fit the deep dip spectrum. We find, however, that the effects are negligible and all the parameters remain unchanged within their 90% confidence ranges. We confirm that the energy dependence of the scattering cross section, which is not included in cabs, is also negligible in our energy range. The column density of the deep dip corresponds to an optical depth of in Thomson scattering, which only reduces to at 50 keV.
III.4. Swift/XRT spectrum in the high/soft state
| Component | Parameter | Model1aaphabs*simpl*bhspec | Model2bbabsorbed 1–10 keV flux (ergs cm-2 sec-1) | Model3ccphabs*(xsabs2*xsabs1*simpl*bhspecgaussgauss) | Model4ddphabs*(xsabs2*xsabs1*simpl*diskbbgaussgauss), for direct comparison with the disk flux obtained from the Suzaku non-dip spectrum. |
|---|---|---|---|---|---|
| phabs | ( cm-2) | ||||
| xsabs1eeIonized absorption model created with XSTAR. Incident spectrum is defined as the diskbb model with a inner temperature of 1.0 keV. We assume a turbulent velocity of 300 km sec-1. | ( cm-2) | – | |||
| – | |||||
| blue shift (km)ffPositive values represent blue shifts. | – | ||||
| xsabs2eeIonized absorption model created with XSTAR. Incident spectrum is defined as the diskbb model with a inner temperature of 1.0 keV. We assume a turbulent velocity of 300 km sec-1. | ( cm-2) | – | – | ||
| – | – | ||||
| blue shift (km)ffPositive values represent blue shifts. | – | – | 0 (fix) | 0 (fix) | |
| diskbb | (keV) | – | – | – | |
| norm | – | – | – | ||
| bhspecggWe assume , , luminosity , and , where represents the viscosity parameter in the Shakura & Sunyaev (1973) prescription for the stress ( is the total pressure). | – | ||||
| norm | – | ||||
| simpl | (fix) | (fix) | (fix) | (fix) | |
| scattering fraction | |||||
| gauss | line energy (keV) | – | – | ||
| norm | – | – | |||
| E.W. (eV) | – | – | |||
| gauss | line energy (keV) | – | – | ||
| norm | – | – | |||
| E.W. (eV) | – | – | |||
To compare the Suzaku non-dip spectrum in the low/hard state with
spectra in the high/soft state, we
analyze a Swift/XRT spectrum of MAXI J1305704 obtained from 2012
April 19 to 21 during the high/soft state. As described in
Miller et al. (2012a), these XRT data also show dipping behaviors. We create
a time-averaged non-dip spectrum by extracting the events when the count
rate exceeds 20 counts sec-1 in the 1–10 keV light curve with 16
sec bins. Following the release note for the Swift XRT
CALDB888http://heasarc.gsfc.nasa.gov/docs/heasarc/caldb/swift/docs/
xrt/SWIFT-XRT-CALDB-09_v16.pdf,
we use the data down to 0.3 keV for the following spectral fit, where
the calibration of the energy response is reliable.
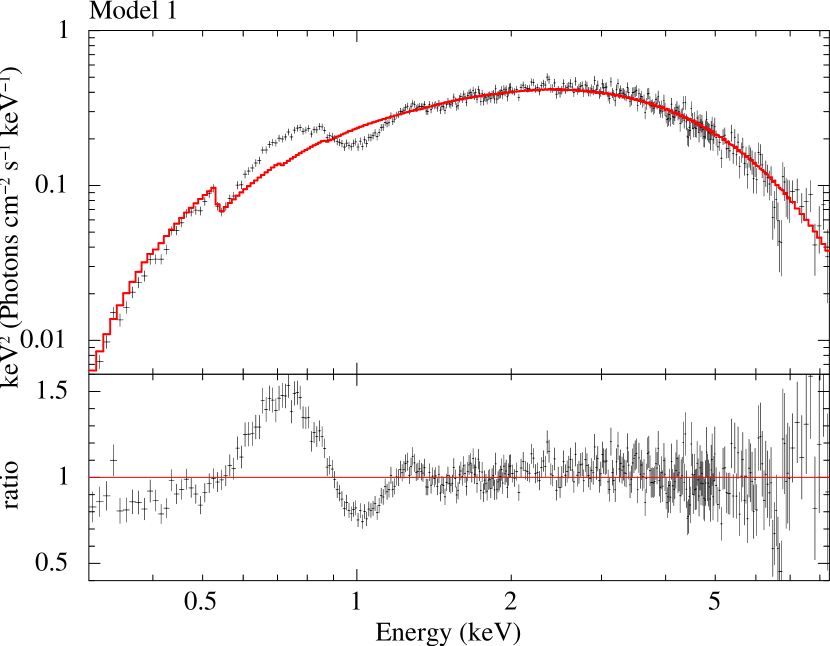
First we fit the XRT spectrum using an MCD model with a neutral absorption. A simpl model (Steiner et al., 2009) is also incorporated to account for Comptonization, with a fixed photon index of 2.2, a typical value in the high/soft state of BHXBs (e.g., Ebisawa et al., 1994; Done et al., 2007; Kolehmainen et al., 2011). We extend the energy range to 0.01–100 keV for the model calculation since simpl is a convolution model. We find that this model, phabs*simpl*diskbb, roughly describes the XRT spectrum, with an inner disk temperature ( keV) and a small scattering fraction (% of the total disk emission), although the fit is far from acceptable () mainly due to the broad absorption (and/or emission)-like structures in the soft band below 1 keV. These large residuals are probably a composition of the iron-L absorption lines, which are detected in the Chandra HETGS observation on 10 days after the Swift observation, as reported by Miller et al. (2012b). The XRT spectrum also has a narrow absorption line at about 6.6 keV, which likely corresponds to K- lines of highly ionized iron ions. By fitting the line with a negative Gaussian, its center energy, line flux, and equivalent width are estimated to be keV, ergs cm-2 sec-2, and eV, respectively.
We find that the unabsorbed flux in the 0.01–100 keV band, erg cm-2 sec -1, is only times larger than that of the Suzaku non-dip spectrum ( erg cm-2 sec -1). This suggests that MAXI J1305704 was in a relatively faint high/soft state and that the bolometric luminosity in the Swift observation was comparable with that in the soft-to-hard transition, typically (Maccarone, 2003). However, the inner disk temperature is too high to be expected for such a faint high/soft state with a low accretion rate. This could be understood in the way that the strong relativistic beaming effects due to a high inclination angle and/or a high black hole spin significantly modify the disk spectrum and consequently we obtain an apparently higher inner temperature than the intrinsic one. We therefore replace diskbb with bhspec (Davis et al., 2005), a relativistic disk emission model, to fit the spectra (i.e., phabs*simpl*bhspec; Model 1 in Table 2). The bhspec model calculates the radiation transfer in the accretion disk around a black hole by self-consistently considering its vertical structure. The model parameters are the black hole mass (), spin parameter (, where represents angular momentum of the black hole), distance, inclination angle, disk luminosity, and the parameter, which we fix at 0.01. Here we assume a black hole mass of , a high inclination, (see Section 5.1), and a disk luminosity corresponding to , and leave and the normalization , which is related to the distance via (10 kpc/)2, as free parameters. We find that the Swift/XRT spectrum favors this bhspec model better than the diskbb model with a smaller reduced chi-squared value (). A moderate spin parameter () is obtained.
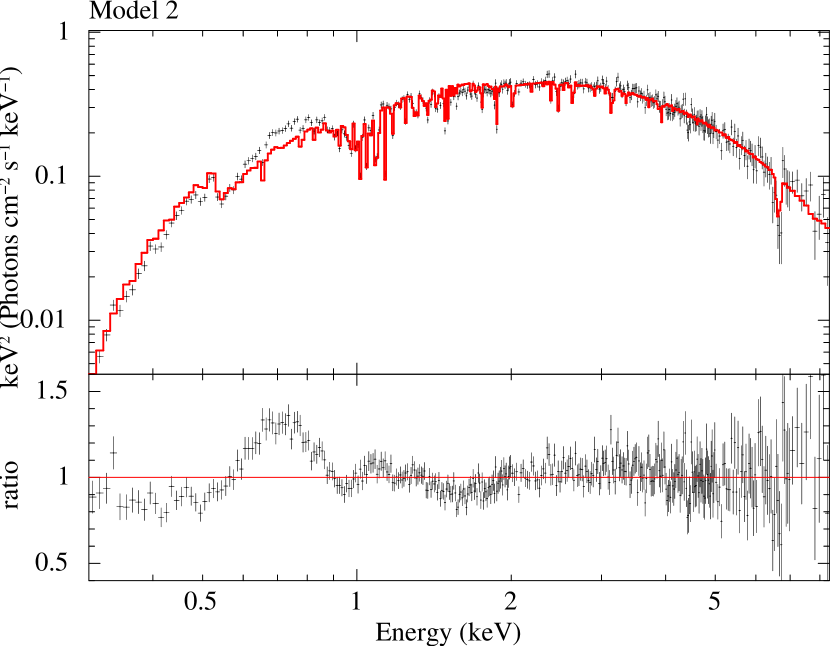
To investigate the properties of the ionized absorber responsible for the structures at 6.6 keV and below 1 keV, we create a multiplicative photoionized absorption model by utilizing XSTAR to fit the non-dip XRT spectrum. We adopt an MCD with an inner temperature of 1.0 keV as the incident spectrum in the energy range of 1–1000 Ry. The ionized absorber is assumed to have the solar abundances and a turbulent velocity of 300 km sec-1. The fit is much improved () by using this model, phabs*xsabs*simpl*bhspec (Model 2 in Table 2), where the xsabs represents the photoionized absorption. We obtain an ionization parameter of and an equivalent hydrogen column density of cm-2.
The fit is still far from acceptable, however, due to the large residuals at around 0.7 keV and 1.2 keV, which cannot be explained by calibration uncertainties of the response. The iron-K absorption line is not well modeled either, likely because these large structures at around 1 keV lead to wrong constraints on the parameters of the ionized absorption component. The residuals are not originated from the uncertainties of bhspec in modelling absorption edges, either. We confirm that the quality of fit is not improved by replacing the bhspec component with another relativistic disk emission model, kerrbb, which does not consider the vertical structure of the disk and has no absorption edges. Furthermore, they are reproduced neither by ionized O and Ne edges of additional absorption components nor by a superposition of emission lines created by the ionized absorber, which can never produce huge equivalent widths to fit the structures. We also change the oxygen, neon and iron abundances in the model, which could produce artificial emission and/or absorption-like structures around 0.5–1.0 keV if not appropriate. While the fit is not improved by varying the iron abundance, a better fit is obtained with a smaller oxygen abundance: for an oxygen abundance of 0.5 in the solar unit both for neutral and ionized absorbers. Nevertheless, we find that huge residuals still remain at 0.7 keV even in the extreme case of no oxygen. A larger neon abundance also gives a better fit but the improvement of chi-squared value is not so significant as the oxygen abundance (at best for a neon abundance of 9.0 in the solar unit). Thus, the oxygen and neon abundances in the absorbers cannot entirely explain the differences between the data and model in the soft energy band.
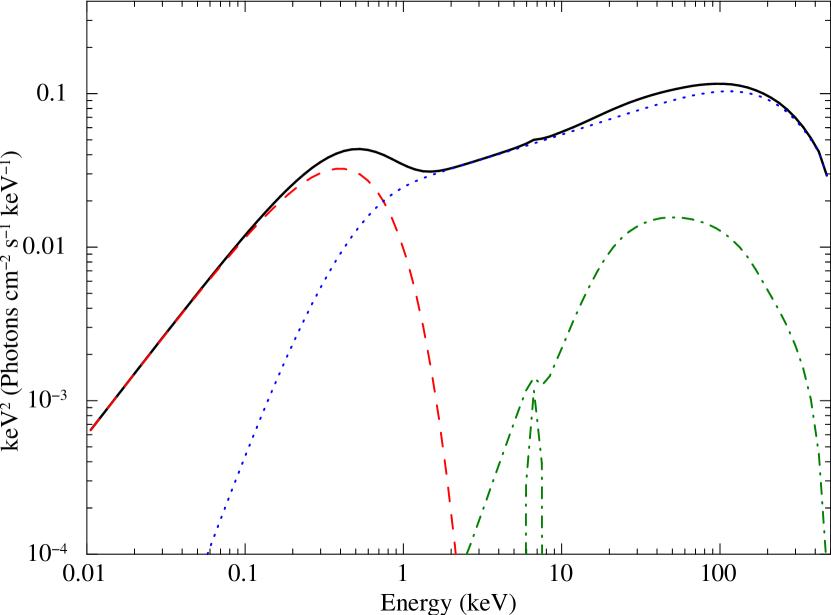
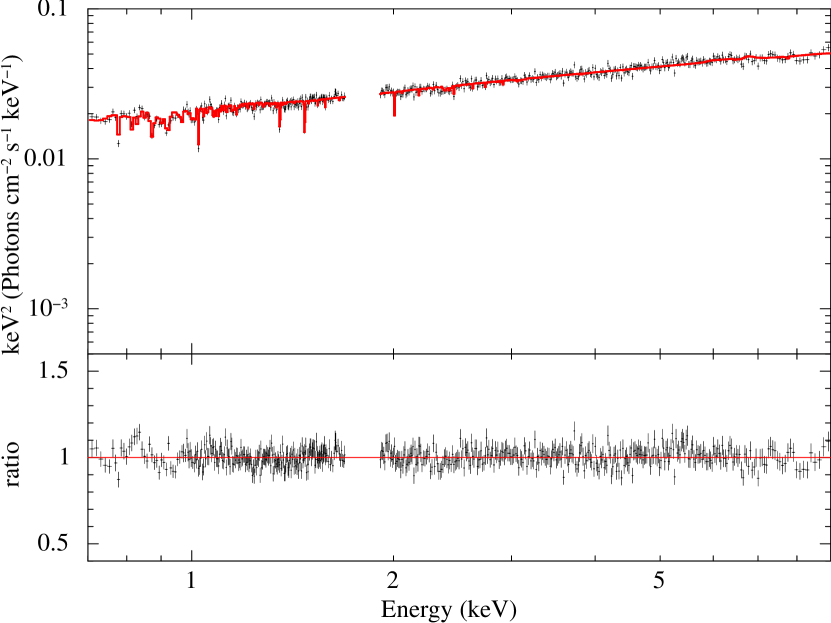
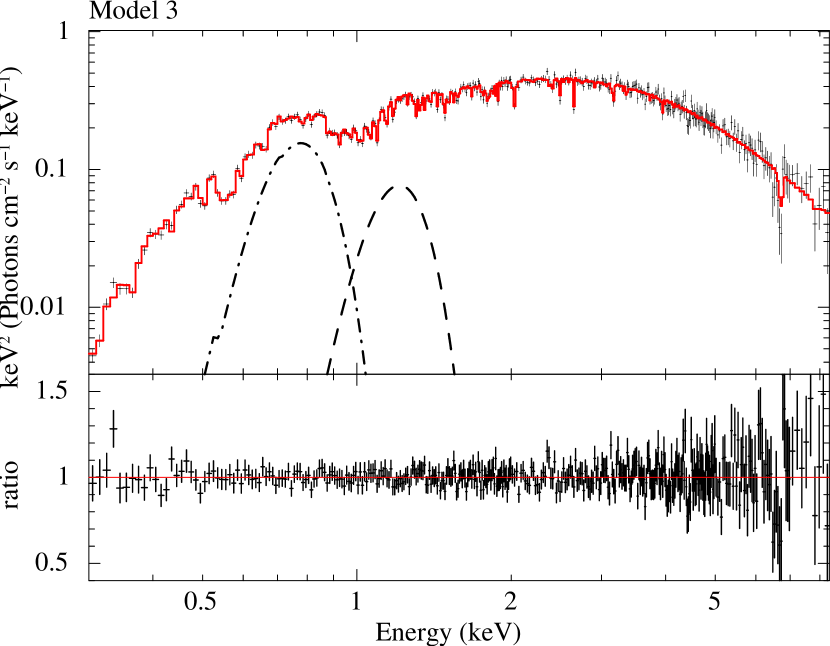
We find that the structures below 1 keV are well reproduced by empirically adding two broad Gaussian components at 0.75 keV and 1.2 keV with line widths of eV and 140 eV, and equivalent widths of eV and eV, respectively. The fit is significantly improved and becomes acceptable () with this model phabs*(xsabs*simpl*bhspec+gauss+gauss) where the solar abundances are assumed for both the ionized and neutral absorbers. For the ionized absorber, the resulting ionization parameter is and the column density is cm-2. However, the equivalent width of the iron-K absorption line estimated from this model is somewhat smaller than that actually seen in the Swift/XRT spectrum. We therefore add another ionized absorption component and fit the spectrum with the model expressed as phabs*(xsabs*xsabs*simpl*bhspec+gauss+gauss) (Model 3 in Table 2). This model excellently describes the overall spectrum and further decreases the reduced chi-squared value (). The resulting model is plotted in Figure 8 and the best-fit parameters are given in Table 2. The ionization parameter and column density are and cm-2 for one ionized absorber responsible for the iron K absorption line, and and cm-2 for the other. The spin parameter is estimated as .
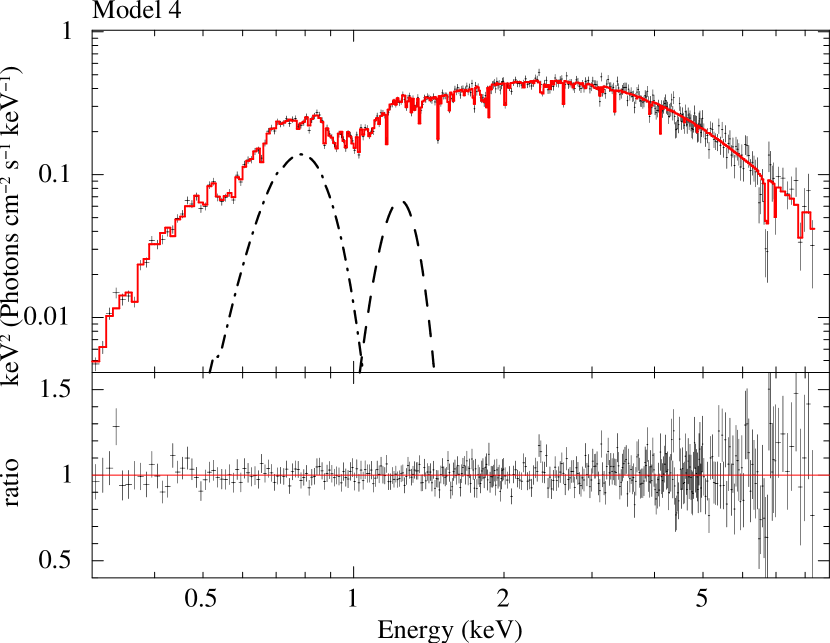
For direct comparison of the disk emission between the low/hard state (Suzaku) and the high/soft state (Swift), we replace bhspec in the final model with diskbb (phabs*(xsabs*xsabs*simpl*diskbb+gauss+gauss); Model 4 in Table 2) and fit the Swift/XRT spectrum. The fit is again acceptable (), and the inner disk temperature and normalization of diskbb are estimated to be keV and , respectively. The normalization is about 35 times smaller than that of the direct MCD component obtained from the Suzaku best-fit model. This indicates that the inner disk radius is smaller during the Swift observation in the high/soft state than during the Suzaku observation in the low/hard state. These Swift/XRT results are summarized in Table 2 and Figure 8.
IV. Near-infrared Observations and Results
Photometric observations of MAXI J1305704 in the (1.25m), (1.63m), and (2.14m) bands were carried out on 6 nights by using the SIRIUS camera (Nagayama et al., 2003) on the 1.4m IRSF telescope at the South African Astronomical Observatory (SAAO). The first 3 nights (2012 April 27, 28, and 29) were about 20 days after the beginning of outburst and the source was stayed in the high/soft state, while it was in the low/hard state on the last 3 nights (2012 July 22, 23, and 24). The July observations with IRSF/SIRIUS were made only 1 day after the end of Suzaku X-ray observation. The typical seeing in full width at half maximum was 1.5–2.0” (3.5–4.5 pixels) in the band. The observation log is given in Table 3.
| Date | Number of | Integration time | Magnitudeb,cb,cfootnotemark: | ||
|---|---|---|---|---|---|
| (2012) | observationsaa10 and 15 dithered frames are combined for each observation at first and last three nights, respectively. | in each frame (sec) | |||
| Apr. 27 | 1 | 30 | |||
| Apr. 28 | 1 | 30 | |||
| Apr. 29 | 54 | 30 | |||
| Jul. 22 | 1 | 15 | |||
| Jul. 23 | 1 | 15 | |||
| Jul. 24 | 1 | 15 | |||
We performed the standard data reduction (i.e., dark subtraction, flat-fielding, sky subtraction, and combining dithered images) with IRSF pipeline software on IRAF version 2.16 (the Image Reduction and Analysis Facility, distributed by the National Optical Astronomy Observatory). We combined all the object frames obtained in one night to maximize the signal-to-noise ratio. We found the most probable near infrared counterpart of MAXI J1305704 at R.A. and Dec. (J2000), which is located in the Swift/XRT 90% error circle (Kennea et al., 2012) and is consistent with the position of the optical/near-infrared counterpart discovered on April 11 by Greiner et al. (2012) with the GROND instrument mounted on the 2.2m telescope in the MPI/ESO La Silla observatory. The IRSF/SIRIUS position is also consistent with those estimated in the Swift/UVOT (Ultraviolet/Optical Telescope) and Chandra HETGS observations (Greiner et al., 2012; Miller et al., 2012b) performed on April 10 and 29, respectively. The magnitudes in the three bands on each night are listed in Table 3. These were obtained by performing aperture photometry calibrated with the 2MASS (2 Micron All-SkySurvey; Skrutskie et al., 2006) photometric data of the stars in the field of view.
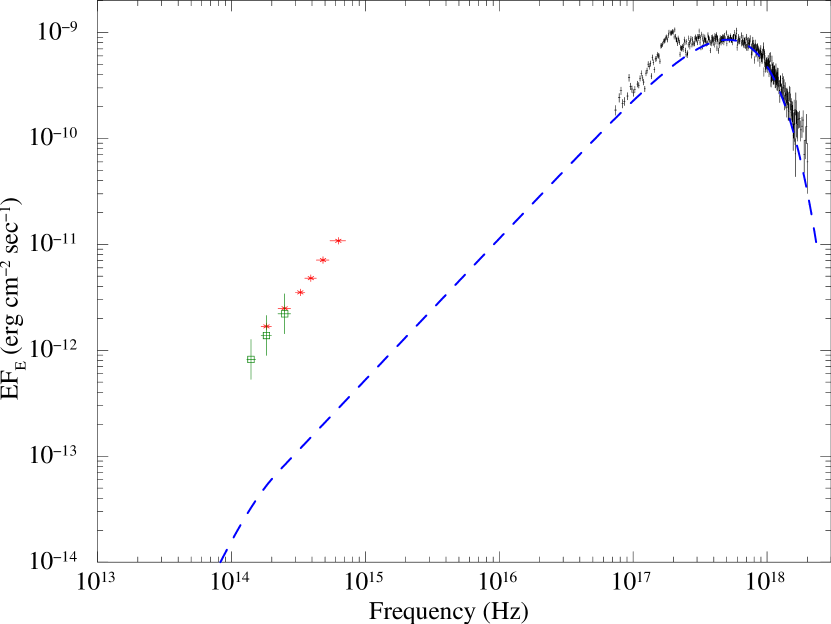
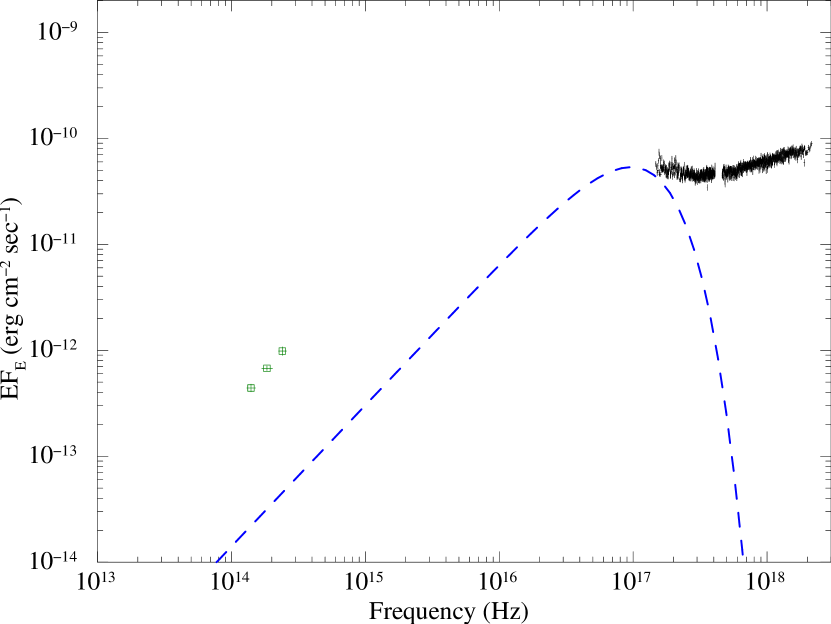
Figure 9 shows the IRSF fluxes on April 29 in the high/soft state (left panel) and on July 22 in the low/hard state (right panel). These fluxes were corrected for Galactic extinction. Considering the Suzaku and Swift results, we assumed the hydrogen column density of interstellar absorption as cm-2 and derived the extinction in each band as , , and by combining the conversion factors given by Predehl & Schmitt (1995) and Rieke & Lebofsky (1985).
In Figure 9, the quasi-simultaneous X-ray data obtained in the Swift and Suzaku observations are plotted in the left and right panel, respectively. The best-fit intrinsic disk components are separately shown. The X-ray spectra are corrected for both neutral and ionized absorptions. The GROND data in the optical and near infrared bands (, , , , , and ; Greiner et al., 2012) are also plotted in Fig. 9 together with our IRSF ones obtained in the high/soft state. As noticed from the figure, these fluxes in the high/soft and low/hard states are times larger than those of the intrinsic disk components estimated from the X-ray data. The flux levels in the optical and near infrared bands were decreased by 50% from the high/soft state to the low/hard state. These results suggest that in addition to the direct disk emission and the constant black body radiation from the companion star, another component (probably irradiation in the outer disk region) significantly contributes to the optical and near infrared fluxes (see also Section 5.1). The IRSF fluxes on July 24, which are the weakest ones in the 6 nights, correspond to the absolute magnitudes of 2.8, 2.4, and 2.1 in the , , and bands (where the distance of MAXI J1305704 is assumed as 6 kpc), respectively. If the companion is a main-sequence star, these magnitudes indicate that it is a late F-type or smaller mass star (Wainscoat et al., 1992).
V. Discussion
V.1. Implications for the System Parameters
It is likely that the compact object of MAXI J1305704 is a black hole because the behavior of spectral evolution in the outburst is quite similar to those of typical BHXBs (Morihana et al., 2013). However, no constraint has been obtained so far on the black hole mass of this source, as well as its distance and the mass of the companion star. Here we summarize what we find about these system parameters from the Suzaku and Swift results.
The power spectrum obtained with the XIS light curve shows very weak intrinsic variability with a fractional rms2 of Hz-1 from Hz to Hz. This result suggests that the low-frequency break of the band limited noise is located above the frequency range. Normally, BHXBs have an order of magnitude stronger power and the break frequency is much lower when they are in the low/hard state, although weaker variability is sometimes observed from low mass black holes like GRO J165540 (5–7 , Remillard et al. 1999) in that state. This might suggest that MAXI J1305704 also have a relatively small mass black hole. However, even with a low mass black hole it is difficult to explain the lack of the variability power for such a very hard spectrum with a photon index of .
Since the source shows dips but no eclipse, its inclination angle is estimated to be – (Frank et al., 1987). The dips seen in MAXI J1305704 are deeper and more periodic than those in GRO J165540, whose inclination angle is (Orosz & Bailyn, 1997). This suggests that MAXI J1305704 has a larger inclination angle than GRO J165540, likely , and that the complex dips are originated in absorbing structures with small scale heights above the disk crossing the line of sight. From the Suzaku XIS light curve, the dip interval is estimated as , which likely correspond to the orbital period of MAXI J1305704. We derive the binary size as km from the Kepler’s third law, where represents the total mass of companion star and black hole in the unit of . Combining the Kepler’s third law and the relation between the radius and mass of the Roche lobe in a semi-detached binary system (Equation 4. in Paczyński, 1971), we have
| (1) |
where , , and represent the averaged density and mass of the companion star, which fills its Roche lobe, and the orbital period. From this equation, we derive the averaged density of the companion star as g cm-3, which is smaller than that of the Sun ( g cm-3). If the companion is a main sequence star, it has a slightly larger mass than the Sun. This is consistent with the near-infrared absolute magnitudes observed with IRSF in the low/hard state. However, an upper limit of the stellar radius is imposed by the inclination angle and binary size, km, or , by considering that the source has no eclipses. This radius and the averaged density of the Roche lobe give a somewhat smaller mass of the companion star than that of the Sun, , although this limit strongly depends on the assumed inclination angle and the total mass of the binary system. Thus, it is also possible that the companion is an evolved star with a mass of , instead of an earlier-type main sequence star than the Sun.
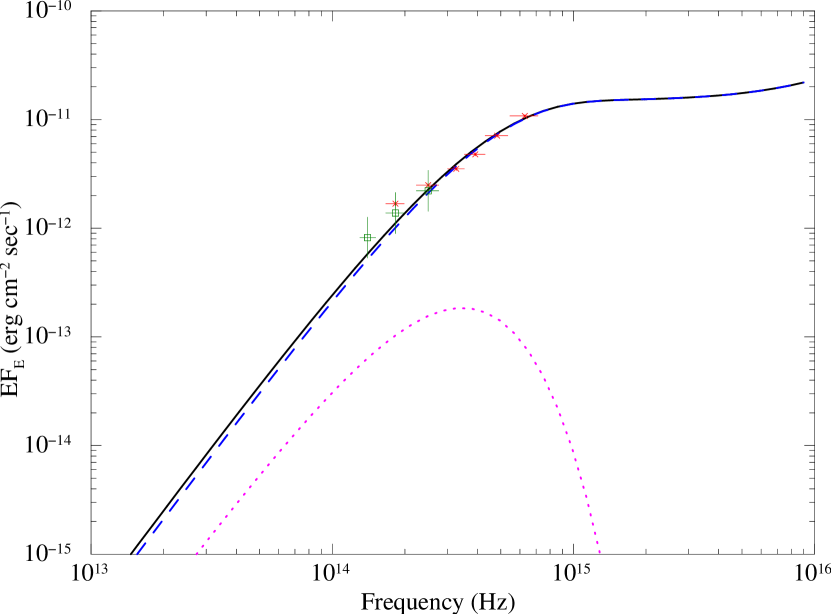
As presented in Fig. 9, the near infrared and optical fluxes of MAXI J1305704 in the high/soft state is 10 times higher than the flux level of the multicolor disk component, suggesting that the fluxes are dominated by other components, likely reprocessed emission from the irradiated outer disk and the black body emission from the companion star. To estimate the contributions of these two components to the optical and near infrared spectral energy distribution (SED), we fit the Swift/XRT (X-ray), GROND (optical and near infrared), and IRSF (near infrared) data in the high/soft state using the diskir (Gierliński et al., 2008, 2009) plus bbodyrad model, which represent the direct and reprocessed emission from the disk and the black body component from the companion star, respectively. The diskir model calculates the total spectrum of the disk emission and its Comptonization including the reprocessed emission from the irradiated outer disk, by using the inner disk temperature (), photon index and electron temperature of the Comptonized component ( and , respectively), the ratio of the luminosity of the Compton tail to disk luminosity (), the fraction of luminosity of the Comptonized component that is thermalized in the inner disk (), the fraction of bolometric flux that illuminates the outer disk (), the radius of the Compton illuminated disk (), and the outer disk radius (). The bbodyrad model produces a black body spectrum from a temperature () and a normalization (), which is related to the source radius (km) and distance through , where is the distance in units of 10 kpc.
We replace diskbb of the best-fit results of Model 4 in the Swift/XRT fit (Section 3.4) with diskir and add bbodyrad to fit the multiwavelength SED. Here we set and following Gierliński et al. (2009). The photon index of the Compton tail and the inner disk temperature are fixed at the same values of Model 4, and keV. The electron temperature of the Compton component is set to 300 keV in order not to have an exponential cut-off in the energy range of the Swift/XRT. After some traials of the spectral fit, we find that the black body component favors a small temperature and a large normalization. Considering the maximum radius constrained from the absence of eclipse, we vary the normalization of the bbodyrad component within .
The best-fit parameters of the diskir and bbodyrad models are listed in Table 4. The optical and near infrared SED in the high/soft state is reproduced reasonably well with the dominant irradiated disk component and the weak black body component from the companion star (Figure 10). The irradiation fraction () is 10 times smaller than those of GX 3394 and GRS 1915105 during the high/soft state (Rahoui et al., 2010, 2012), but 5 times larger than those of XTE J1817330 in that state (Gierliński et al., 2009). The radius of the companion star is estimated as and the temperature is found to be smaller than that of the Sun (3000 K 5600 K). These results and the averaged density estimated from Equation 1 suggest that the companion is likely an evolved star at an early stage that has a smaller mass than .
| Component | Parameter | value |
|---|---|---|
| diskir | (keV) | (fix) |
| 2.2 (fix) | ||
| (keV) | 300 (fix) | |
| fin | 0.1 (fix) | |
| () | 1.1 (fix) | |
| norm | ||
| bbodyrad | (K) | |
| (/6 kpc) | ||
We find that the non-dip spectra in the Swift and Suzaku observations have comparable bolometric luminosities within a factor of 3. This suggests that they are likely to be about only a few times more and less than that in the soft-to-hard transition, , respectively, by considering the results of Maccarone (2003). However, the inner disk temperature of the diskbb component obtained from the Swift spectrum ( keV) is much higher than what we expect from a faint high/soft state for normal BHXBs. This suggests that the disk spectrum is significantly modified by the Doppler effects due to a very high inclination angle, probably . Indeed, assuming a black hole mass of , bolometric luminosity of , and inclination angle of , we successfully reproduce the Swift spectrum with a relativistic disk emission model (bhspec), and obtain a moderate spin () and a distance of kpc calculated from the normalization (). We note that there is strong coupling between the spin, luminosity, and black hole mass in the bhspec fit and a smaller spin parameter is obtained when a larger luminosity and/or a lower black hole mass is assumed. For instance, in the cases of and , we have and , while and give and , respectively.
V.2. Dipping Behavior
The Suzaku observation revealed that MAXI J1305704 has two separate periodic dips with different column densities, ionization parameters, and covering fractions of the absorbers. We find that these dips have the same recurrence period of hours and the harder dip (deep dip) is followed by the softer one (shallow dip) in 6.38 hours. Such strong, softer “secondary dips” are occasionally seen in dipping X-ray binaries (a few neutron star binaries like XB 1916053; Smale et al. 1992). Dips are generally interpreted as the absorption by the “bulge” formed in a region where the accretion stream from the companion star impacts the outer boundary of the disk, but what is the origin of secondary dip? It may be the result that the accretion stream hits the disk again and splashes at its circularization radius, which is smaller than the outer disk radius (Frank et al., 1987, 1992). Frank et al. (1987) suggest that the stream causes ionization instabilities at the second impact and creates patchy cold clouds within hot medium. This is consistent with the behavior of the shallow dip, in which significant time variabilities can be seen in the XIS light curve. The shallow dip occurs at the orbital phase of 0.64 (if the start of the deep dip is assumed to be phase 0), which is also consistent with the picture of Frank et al. (1987).
The properties of time variabilities and absorption profiles in the dipping spectra provide us with key information on the two dips. The shallow dip exhibits significant fast variabilities on the timescale of a few minutes in the XIS light curve, suggesting that the absorber is not a single continuous structure, but composed of blobs. If the absorber of the shallow dip is created at the circularization radius of km and rotates with the Keplerian velocity, one minute corresponds to a typical blob size of km, where is defined as . The covering fraction in the shallow dip can be understood as the filling factor of blobs in the dipping zone. Interestingly, similar short-time variability was also found in the neutron star XB 1254690 (Díaz Trigo et al., 2009), suggesting that shallow dips in dipping X-ray binaries may generally consist of clumps. By contrast, in the deep dip, short-time variabilities are not significant and the covering fraction is larger than 90%, suggesting that the absorber of the deep dip has more continuous structure or is filled with much smaller blobs than those of the shallow dip.
We have shown that both non-dip and dip spectra of MAXI J1305704 obtained with Suzaku are successfully modeled by ionized absorbers with different column densities and ionization parameters. The dip spectra have an order of magnitude larger hydrogen column densities and smaller ionization parameters than those of the non-dip spectrum. These results are very similar to those reported by Boirin et al. (2005) and Díaz Trigo et al. (2006) for neutron star low mass X-ray binaries. Thus, it may be a general picture in low-mass X-ray binaries that dips are created by ionized absorbers with much larger column densities and in lower ionization states than those observed in non-dip spectra.
V.3. Structure of Accretion Disk and Comptonized Corona
The Suzaku non-dip spectrum of MAXI J1305704 is approximated by a power-law extending up to 130 keV with a photon index of . This hard spectrum indicates that the source was in the low/hard state. By more detailed modeling, we find that the spectrum can be described with a general model in the low/hard state of BHXBs (e.g., Gierliński et al., 1997), a multicolor disk and its Comptonization with a reflection component from the disk. Although recent Suzaku studies on other BHXBs report that two Comptonization components with different optical depths are needed to reproduce their spectra in the low/hard state (Takahashi et al., 2008; Makishima et al., 2008; Shidatsu et al., 2011; Yamada et al., 2013), our data do not require the second component. The reason is unclear, but it may be because the large inclination of MAXI J1305704 makes it difficult to detect the softer component (i.e., with a small optical depth) than the other systems, although it may be partially due to the poor statistics of our data. The smooth spectral profile of MAXI J1305704 without any complex Comptonized component required, as well as the relatively weak time variability below Hz (see Section 5.1) are unusual and interesting properties for a BHXB in the low/hard state.
We obtained a much larger normalization () and smaller temperature ( keV) of the direct MCD component than those obtained with the Swift/XRT spectrum in the high/soft state. Assuming that the Comptonizated corona is isotropic and that the total number of photons from the disk is conserved after reprocessed by Comptonization, we obtain the following equation (Kubota & Makishima, 2004);
| (2) | |||||
where and are the 0.01–100 keV photon flux from the disk and thermal Comptonized component, respectively. We estimate the flux of the nthcomp component as photons cm-2 sec-1 and that of diskbb component as photons cm-2 sec-1. Using Equation 2, we estimate the innermost disk radius of km, (where is the distance in unit of 6 kpc). The actual radius is derived to be km, by multiplying 1.19, a correction factor of the boundary condition and spectral hardening (Kubota et al., 1998).
We compare the inner disk radius in the Suzaku and Swift observations, using the intrinsic flux of the MCD component. Although the absolute radius obtained from the Swift result may be affected by the strong beaming effects, we are able to discuss the relative difference of the radius between the two epochs. Using the diskbb normalization obtained with the XRT spectrum () and multiplying the correction factor 1.19 (Kubota et al., 1998), we derive the inner disk radius as km. Thus, the inner radius obtained from the best-fit model of Suzaku data, km is 5.8–8.8 times larger than that from the XRT result. Thus, we robustly conclude that the inner radius increased in the Suzaku observation, giving strong evidence for disk truncation in the low/hard state.
We find significant broad emission-line like residuals at 0.7 keV and 1.2 keV in the Swift/XRT spectrum, which cannot be reduced by multiple ionized absorptions, partial covering, emission components from the absorber itself. Also, these residuals are not completely explained by changing the elemental abundances in the neutral and ionized absorbers. It is difficult to know what makes these structures. Because they are not seen in the Suzaku spectra in the low/hard state, their origin would be associated with the geometry of the accretion disk and/or the ionized absorbers in the high/soft state.
Similar features at 0.7 keV were reported in several ultracompact low mass X-ray binaries (UCXBs; e.g., Juett et al., 2001), which have very short orbital periods (less than about 80 minutes). Madej et al. (2010) and Madej & Jonker (2011) recently suggested that the structures seen in UCXBs are the relativistically broadened OVIII Ly line created by reflection on the disk in the vicinity of the accretor with an ionization parameter of . Likewise, the residuals in MAXI J1305704 might be originated from reflection on ionized accretion disk in the strong gravitational field created by the central black hole. Indeed, we find a relativistic emission line model laor instead of Gaussian can also give an acceptable fit () by assuming an inclination of , inner radius of (corresponding to ), outer radius of , and emissivity index (). The resulting line energy and equivalent width of the laor model are keV and eV for the lower energy feature and keV and eV for the higher energy one (here we vary the emissivity index within and obtain the best fit value of ). These line energies are consistent with the K line from H-like oxygen ions and L-lines from ionized iron ions. The photons to illuminate the disk would be produced from the Comptonizing corona, or from the disk itself, whose emission could be partially incident on the disk because of gravitational light bending. If these photons could strongly illuminate the disk, huge emission lines might arise through a temperature inversion region of the irradiated disk atmosphere. The large equivalent width of the emission lines with respect to the continuum emission would be expected for a very high inclination source because of a large optical depth of the disk atmosphere. However, we have no model to accurately evaluate these effects at present. Radiative transfer calculation including all these possible effects is left for future studies.
V.4. Ionized absorbers
We find that not only the Swift/XRT spectrum in the high/soft state but also the Suzaku spectrum in the low/hard state exhibit ionized absorption features. Blue shifts are not significantly detected with upper limits of 2300–5800 km s-1. The absorber of the Suzaku non-dip spectrum has a column density of cm-2 and an ionization parameter of , while the Swift/XRT spectrum requires two ionized absorbers with different parameters, cm-2 and for one, cm-2 and for the other. As discussed in Section 5.2, the dip spectra of Suzaku are also described with ionized absorbers but with much larger column densities and lower ionization parameters, cm-2 and for the deep dip, and cm-2 and for the shallow dip.
To investigate the origin of the ionized absorbers, we estimate their distances from the X-ray source () from the definition of the ionization parameter,
| (3) |
where and represent the hydrogen number-density and the length of the absorber, respectively. Here is the incident luminosity, whose energy range is 1–1000 Ry in the definition of XSTAR. is estimated as erg sec-1 for the Suzaku observation, and erg sec-1 for the Swift observation. Assuming , we obtain km for the absorber seen in the Suzaku non-dip spectrum. For the Swift/XRT data, we estimate km for the absorber with a higher ionization state and km for that with a lower ionization state. All these radii are more than an order of magnitude larger than predicted values for thermally driven disk winds in BHXBs ( km; e.g., Begelman et al. 1983; Woods et al. 1996; also see below). Furthermore, they are comparable to or even larger than the binary size (see Section 5.1). Hence, if the ionized absorbers of MAXI J1305704 are located on the disk, should be much less than 1. This suggests that the absorbers are originated from rather compact structures and do not largely extend in the radial direction. The absorbers in the deep and shallow dips are calculated to be km, and km, respectively, which are comparable to those seen in the Suzaku and Swift/XRT non-dip spectra.
Table 5 summarizes the physical properties of ionized absorbers reported in previous studies of black hole or neutron star X-ray binaries. The ionization parameter, column density, Doppler velocity, and luminosity taken from the literature are listed. We then calculate the apparent distance by assuming for each set of parameters. Although there is considerable variety in each parameter, almost all of the absorbers in the BHXBs are found to be outflowing with a velocity of 100–1000 km sec-1. Typically, they are located at – km when is assumed. They are interpreted as thermally (e.g., Kubota et al., 2007), radiatively (Kotani et al., 2000), or magnetically driven disk winds (Miller et al., 2008). By contrast, ionized absorbers in neutron star low mass X-ray binaries do not often exhibit significant blue shifts, except for some sources like GX 13+1 (Ueda et al., 2004) and Cir X-1 (Schulz et al., 2008), which are known to have powerful outflows. This implies that the photoionized plasma on neutron star dippers remain gravitationally bound to the system as disk atmosphere and is not outflowing due to a small system size and a low luminosity of the central X-ray source (see Díaz Trigo & Boirin, 2012).
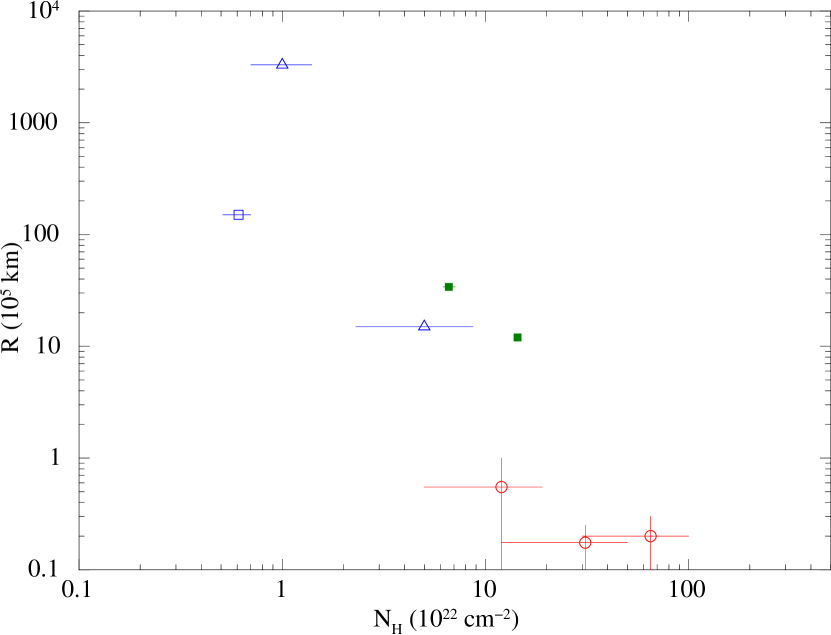
From the comparison, we find that MAXI J1305704 has somewhat lower ionization parameters () and consequently larger than those of typical disk winds observed in other BHXBs. By contrast, absorbers in neutron star dippers sometimes have similar values (see the table of XB 1916053 and EXO 0748676) and exhibit complex and deep dips like MAXI J1305704. Although the BHXB GRO J165540 shows a similar value of ( km and km) based on the results by Díaz Trigo et al. (2007), the turbulent velocity () adopted there is much higher than that assumed for MAXI J1305704 in our paper. We have to note that a larger value gives a smaller column density; in the case of 4U 163047, about 10 times larger values of was obtained with km sec-1 than that with km sec-1 (Kubota et al., 2007). If we assumed km sec-1, the values of the MAXI J1305704 would become much larger than those of GRO J165540. The BHXB GRS 1915105 also shows a large apparent distance ( km), but its binary size is very large ( km) as the source has a very long ( days; Greiner et al. 2001) orbital period and contains a massive black hole (). Thus, the distance of the ionized absorber in GRS 1915105 would be well within the size of accretion disk, even if is assumed. Figure 11 plots the values of and for the ionized absorbers in MAXI J1305704 and those in other BHXBs that exhibit dips and have turbulent velocities less than 1000 km sec-1, except for GRS 1915105. The absorbers in MAXI J1305704 have large values and comparable or smaller values compared to those in the other sources.
These properties suggest that the absorbers in MAXI J1305704 are originated from compact structures like those responsible for the dips, rather than a typical disk wind, which would be widely extended in the radial direction (i.e., ). The Suzaku light curve in the soft band exhibits significant time variability even in the non-dip phases on the shorter time scale than the orbital period. We find these small variabilities occur almost recurrently as well as the deep and shallow dips, by folding the Suzaku light curve with the orbital period. This fact would support the idea that the ionized absorbers in MAXI J1305704 are associated with the disk and composed of compact clouds, unlike disk winds observed in other BHXBs that distribute quite homogeneously over the orbital phase (Yamaoka et al., 2001). Miller et al. (2013) have recently obtained a very large number density ( cm-3) from density-sensitive absorption lines seen in the high-resolution Chandra/HETG spectrum of the source in the high/soft state and derived the actual distance of the absorber as km utilizing the density without any assumption of . From the distance and density, we can estimate the size of ionized absorber as km. This strongly indicates that the absorbers are composed of small clumps.
A possibility is that a fraction of the absorbing gas responsible for the dips is spread to the non-dip phases. MAXI J1305704 is likely to be a high inclination system even compared with other dipping BHXBs and we may see many complex structures of the absorbing gas with a small scale height on the surface of the accretion disk. As described in Frank et al. (1987), the short orbital period of MAXI J1305704 may maintain the clumpy absorbers and produce the similarity in the properties of the ionized absorbers seen in neutron star binaries. Also, like neutron star dippers, the disk size of MAXI J1305704 ( km), estimated from the binary size, is comparable with or maybe smaller than the Compton radius ( km, where is the Compton temperature in units of K) and would not be sufficiently large to power a thermal-driven disk wind (see Díaz Trigo & Boirin, 2012). However, there remains a possibility that we are seeing the launching site of the disk wind near the outer edge of the disk, which may be less homogeneous than in its outer parts and can be compact (). If this were the case, our Suzaku result would imply that such a disk wind exists in the low/hard state of a BHXB and that the accretion states do not always determine the presence of disk winds. Future studies using high quality and high resolution spectra, like those obtained by ASTRO-H (Takahashi et al., 2010), should provide important clues to reveal the origin of these ionized absorbers in X-ray binaries.
VI. Summary
The Suzaku, Swift, and IRSF observations of the newly discovered black hole candidate MAXI J1305704 provide us with the following results:
-
1.
The source clearly shows two absorption dips with different mean hardness ratios. They have the same interval ( hours), which likely corresponds to the orbital period.
-
2.
The Suzaku non-dip spectrum in the low/hard state can be described with a model composed of a multicolor disk emission, its Comptonization, and a reflection component, absorbed by an ionized gas.
-
3.
The Swift/XRT spectrum in the high/soft state is well reproduced with a relativistic disk emission model with a moderate spin parameter () for an assumed inclination angle of , a black hole mass of 3 , and a luminosity of . The inner disk radius obtained in the Swift/XRT spectrum is much smaller than that in the Suzaku spectrum, indicating that the inner edge of the standard disk was receded as the state transition from the high/soft state to the low/hard state.
-
4.
The ionized absorbers in the dip spectra of Suzaku have smaller ionization parameters and larger hydrogen column densities than those of the non-dip spectrum. Similar trends are observed from dipping neutron star X-ray binaries.
-
5.
We find that the ionized absorbers have much smaller ionized parameters and column densities than those of typical disk winds seen in other BHXBs. The properties of the absorbing gas are rather similar to the deeply-dipping neutron star X-ray binaries. These results suggest that the absorbers have compact and clumpy structures like those responsible for the dips rather than a homogeneous disk wind. The possibility that we are seeing the launching site of a disk wind is not ruled out, however.
-
6.
Near infrared observations in the , , and bands were also performed with IRSF both in the high/soft state and low/hard state. The fluxes in the three bands are about an order of magnitude larger than the disk emission estimated from the X-ray spectra and can be described with the reprocessed thermal emission from the irradiated outer disk and the black body emission from the companion star.
References
- Anders & Grevesse (1989) Anders, E., & Grevesse, N. 1989, Geochim. Cosmochim. Acta, 53, 197
- Axelsson et al. (2005) Axelsson, M., Borgonovo, L., & Larsson, S. 2005 A&A, 438, 999
- Beer & Podsiadlowski (2002) Beer, M. E., & Podsiadlowski, P. 2002, MNRAS, 331, 351
- Begelman et al. (1983) Begelman, M. C., McKee, C. F., and Shields, G. A. 1983 ApJ, 271, 70
- Belloni et al. (1990) Belloni, T., & Hasinger, G. 1990, A&A, 227, L33
- Belloni et al. (2002) Belloni, T., Psaltis, D., & van der Klis, M. 2002, ApJ, 572, 392
- Boirin et al. (2005) Boirin, L., Méndez, M., Díaz Trigo, M., et al. 2005, A&A, 436, 195
- Corbet et al. (2010) Corbet, R. H. D., Pearlman, A. B., Buxton, M., & Levine, A. M. 2010, ApJ, 719, 979
- Davis et al. (2005) Davis, S. W., Blaes, O. M., Hubeny, I., et al. 2005, ApJ, 621, 372
- Díaz Trigo et al. (2006) Díaz Trigo, M., Parmar, J., Miller, et al. 2006, A&A, 445, 179
- Díaz Trigo et al. (2007) Díaz Trigo, M., Parmar, A. N., Miller, J., et al. 2007, A&A, 462, 657
- Díaz Trigo et al. (2009) Díaz Trigo, M., Parmar, A. N., Boirin, L., et al. 2009, A&A, 493, 145
- Díaz Trigo & Boirin (2012) Díaz Trigo, M., & Boirin, L. 2012, arXiv:1210.0318
- Done et al. (2007) Done, C., Gierliński, M., & Kubota, A. 2007, A&A Rev., 15, 1
- Ebisawa et al. (1993) Ebisawa, K., Makino, F., & Mitsuda, K. 1993, ApJ, 403, 684
- Ebisawa et al. (1994) Ebisawa, K., Ogawa, M., Aoki, T., et al. 1994, ApJ, 46, 375
- Fabian et al. (1994) Fabian, A. C., Kunieda, H., Inoue, S., et al. 1994, 46, L59
- Frank et al. (1987) Frank, J., King, A. R., & Lasota, J.-P. 1987, A&A, 178, 137
- Frank et al. (1992) Frank, J., King, A., & Raine, D. 1992, Accretion Power in Astrophysics 2rd ed., (Cambridge University Press)
- Gierliński et al. (1997) Gierliński, M., Zdziarski, A. A., & Done, C., et al. 1997, MNRAS, 288, 958
- Gierliński et al. (2008) Gierliński, M., Done, C., & Page, K. 2008, MNRAS, 388, 753
- Gierliński et al. (2009) Gierliński, M., Done, C., & Page, K. 2009, MNRAS, 392, 1106
- Greiner et al. (2001) Greiner, J., Cuby, J. G., & McCaughrean, M. J. 2001, Nature, 414, 522
- Greiner et al. (2012) Greiner, J., Rau, A., & Schady, P. 2012, ATel #4030
- Homan et al. (2001) Homan, J., Wijnands, R., van der Klis, M., et al. 2001, ApJS, 132, 377
- Hynes et al. (2003) Hynes, R. I., Steeghs, D., Casares, J., Charles, P. A., & O’Brien, K. 2003, ApJ, 583, L95
- Ingram & Done (2012) Ingram, A. & Done, C. 2012, MNRAS, 419, 2369
- Juett et al. (2001) Juett, A. M., Psaltis, D., & Chakrabarty, D. 2001, ApJ, 560, L59
- Kalberla et al. (2005) Kalberla, P. M. W., Burton, W. B., Hartmann, D. et al. 2005, A&A, 440, 775
- Kennea et al. (2012) Kennea, J. A., Yang, Y. J., Altamirano, D., et al. 2012, ATel #4044
- Kolehmainen et al. (2011) Kolehmainen, M., Done, C., & Diaz Trigo, M. 2011, MNRAS, 416, 311
- Kotani et al. (2000) Kotani, T., Ebisawa, K., Dotani T., et al. 2000, ApJ, 539, 413
- Kubota et al. (1998) Kubota, A., Tanaka, Y., Makishima, K., et al. 1998, PASJ, 50, 667
- Kubota & Makishima (2004) Kubota, A., & Makishima, K. 2004, ApJ, 601, 428
- Kubota et al. (2007) Kubota, A., Dotani, T., Cottam, J., et al. 2007 PASJ, 59, 185
- Kuulkers et al. (2012) Kuulkers, E., Motta, S., & Belloni, T. M. 2012, Atel #4073
- Laor (1991) Laor, A. 1991, ApJ, 376, 90
- Lee et al. (2002) Lee, J. C., Reynolds, C. S., Remillard, R., et al. 2002, ApJ, 567, 1102
- Maccarone (2003) Maccarone, T. J. 2003, A&A, 409, 697
- Madej et al. (2010) Madej, O. K., Jonker, P. G., Fabian, A. C., et al. 2010, MNRAS, 407, L11
- Madej & Jonker (2011) Madej, O. K., & Jonker, P. G. 2011, MNRAS, 412, L11
- Matt et al. (1991) Matt, G., Perola, G. C., & Piro, L. 1991, A&A, 247, 25
- McClintock & Remillard (2006) McClintock, J. E., & Remillard, R. A. 2006, in Compact Stellar X-Ray Sources, ed. W. H. G., Lewin, & M. van der Klis (Cambridge: Cambridge Univ. Press), 157
- Magdziarz & Zdziarski (1995) Magdziarz, P., & Zdziarski, A. A. 1995, MNRAS, 273, 837
- Makishima et al. (2008) Makishima, K., Takahashi, H., Yamada, S., et al. 2008, PASJ, 60, 585
- Manmoto et al. (1996) Manmoto, T., Takeuchi, M., Mineshige, S., Matsumoto, R., & Negoro., H. 1996, ApJ, 1996, 464, L135
- Marshall et al. (1993) Marshall, F. E., Mushotzky, R. F., Petre, R. et al. 1993 ApJ, 419, 301
- Matsuoka et al. (2009) Matsuoka, M., Kawasaki, K., Ueno, S., et al. 2009, PASJ, 61, 999
- Mihara et al. (1994) Mihara, T., Matsuoka, M., & Mushotzky, R. F. et al. 1994, PASJ, 46, L137
- Miller et al. (2004) Miller, J. M., Raymond, J., Fabian, A. C., et al. 2004, ApJ, 601, 465
- Miller et al. (2006a) Miller, J. M., Raymond, J., Fabian, A. C., et al. 2006, Nature, 441, 953
- Miller et al. (2006b) Miller, J. M., Raymond, J., Homan, J., et al. 2006, ApJ, 646, 394
- Miller et al. (2008) Miller, J. M., Raymond, J., Reynolds, C. S., et al. 2008, ApJ, 680, 1359
- Miller et al. (2011) Miller, J. M., Maitra, D., Cackett, E. M., et al. 2011, ApJ, 731, L7
- Miller et al. (2012a) Miller, J. M., Beardmore, A., Kennea, J., et al. 2012, Atel #4070
- Miller et al. (2012b) Miller,J. M., Raymond, J., Kennea., J., et al. 2012, Atel #4191
- Miller et al. (2013) Miller, J. M., Raymond, J., Kallman, T. R., et al. 2013, arXiv:1306.2915
- Mitsuda et al. (1984) Mitsuda, K., Inoue, H., Koyama, K., et al. 1984, PASJ, 36, 741
- Mitsuda et al. (2007) Mitsuda, K., Bautz, M., Inoue, H., et al. 2007, PASJ, 59, 1
- Morihana et al. (2013) Morihana, K., Nakahira. S., Serino, M., et al. 2013, PASJ, in press
- Nagayama et al. (2003) Nagayama, T., et al. 2003, Proc. SPIE, 4841, 459
- Nandra & Pounds (1992) Nandra, K., & Pounds, K. A. 1992, Nature, 359, 215
- Negoro et al. (2001) Negoro, H., Kitamoto, S., & Mineshige, S. 2001, ApJ, 554, 528
- Neilsen et al. (2011) Neilsen, J., Remillard, R. A., & Lee, J. C. 2011, ApJ, 737, 69
- Nowak (2000) Nowak, M. A. 2000, MNRAS, 318, 361
- Orosz & Bailyn (1997) Orosz, J. A., & Bailyn, C. D., 1997, ApJ, 477, 876
- Papitto et al. (2011) Papitto, A., D’Aì, A., Motta, S., et al. 2011, A&A, 526, L3
- Paczyński (1971) Paczyński, B. 1971, ARA&A, 9, 183
- Ponti et al. (2012) G. Ponti, G., Fender, R. P., Begelman, M. C., et al. 2012, MNRAS, 422, L11
- Pounds et al. (1994) Pounds, K. A., Nandra, K., Fink, H. H., et al. 1994, MNRAS, 267, 193
- Predehl & Schmitt (1995) Predehl, P., Schmitt, J. H. M. M. 1995, A&A, 293, 889
- Rahoui et al. (2010) Rahoui, F., Chaty, S., Rodriguez, J., Fuchs, Y., Mirabel, I. F., & Pooley, G. G. 2010, MNRAS, 715, 1191
- Rahoui et al. (2012) Rahoui, F., Coriat, M., & Corbel, S., et al. 2012, MNRAS, 422, 2202
- Remillard et al. (1999) Remillard, R. A., Morgan, E. H., McClintock, J. E., Bailyn, C. D., & Orosz, J. A. 1999, ApJ, 522, 397
- Rieke & Lebofsky (1985) Rieke, G. H., Lebofsky, M. J. et al. 1985, ApJ, 288, 618
- Romano et al. (2006) Romano, P., Campana, S., Chincarini, G., et al. 2006, A&A, 456, 917
- Sato et al. (2012) Sato, R., Serino, R., Nakahira, S., et al. 2012, ATel #4024
- Schulz et al. (2008) Schulz, N. S., Kallman, T. E., Galloway, D. K., et al. 2008 ApJ, 672, 1091
- Shakura & Sunyaev (1973) Shakura, N. I., & Sunyaev, R. A. 1973, A&A, 24, 337
- Shidatsu et al. (2011) Shidatsu, M., Ueda, Y., Tazaki, F., et al. 2011 , PASJ, 63, 785
- Skrutskie et al. (2006) Skrutskie, M. F., Cutri, R. M., Stiening, R., et al. 2006, AJ, 131, 1163
- Smale et al. (1992) Smale, A. P., Mukai, K., Williams, O. R., et al. 1992, ApJ, 400, 330
- Steiner et al. (2009) Steiner, J. F., Narayan, R., McClintock, J. E., et al. 2009, PASP, 121, 1279
- Takahashi et al. (2007) Takahashi, T., Abe, K., Endo, M., et al. 2007, PASJ, 59, 35
- Takahashi et al. (2008) Takahashi, H., Fukazawa, Y., Mizuno, T., et al. 2008, PASJ, 60, S69
- Takahashi et al. (2010) Takahashi, T., Mitsuda, K., Kelley, R. et al. 2010, Proc. SPIE, 7732, 77320Z
- Tanaka & Shibazaki (1996) Tanaka, Y., & Shibazaki, N. 1996, ARA&A, 34, 607
- Ueda et al. (1998) Ueda, Y., Inoue, H., Tanaka, Y., et al. 1998, ApJ, 492, 782
- Ueda et al. (2004) Ueda, Y., Murakami, H., Yamaoka, K., et al. 2004 ApJ, 609, 325
- Ueda et al. (2009) Ueda, Y., Yamaoka, K., Remillard, R., et al. 2009 ApJ, 695, 888
- van der Klis (2004) van der Klis, M. 2004, arXiv:astro-ph/0410551
- Wainscoat et al. (1992) Wainscoat, R. J., Cohen, M., Volk, K., Walker, H. J., & Schwartz, D. E. 1992, ApJS, 83, 111
- White & Swank (1982) White, N. E., & Swank, J. H. 1982, ApJ, 253, L61
- Woods et al. (1996) Woods, D. T., Klein, R. I., Castor, J. I., et al. 1996 ApJ, 461, 767
- Xiang et al. (2009) Xiang, J., Lee, J. C., Nowak, M. A., et al. 2009 ApJ, 701, 984
- Yamada et al. (2013) Yamada, S., Makishima, K., Torii, S., et al. 2013, PASJ, submitted
- Yamaoka et al. (2001) Yamaoka, K., Ueda, Y., Inoue, H., et al. 2001, PASJ, 53, 179
- Zdziarski et al. (1996) Zdziarski, A. A., Johnson, W. N., & Magdziarz, P. 1996, MNRAS, 283, 193
- Zycki et al. (1999) Życki, P. T., Done, C., & Smith, D. A. 1999, MNRAS, 309, 561
| Source name | photon index | distance | orbital period | energy band of | Reference | ||||||
| or State | (kpc) | (h) | ( cm-2) | (erg sec-1) | (keV) | ( km) | (km s-1) | (km s-1) | |||
| XB 1916053 | 9.3 | 0.8 h | 0.6–10 | 9.3 | -llNot constrained. | Díaz Trigo et al. (2006) | |||||
| 4U 1254690 | 10 | 5.8 h | 0.6–10 | 0.62 | -llNot constrained. | Díaz Trigo et al. (2006) | |||||
| MXB 1659298 | 15 | 7.1 h | 0.6–10 | 4.9 | -llNot constrained. | Díaz Trigo et al. (2006) | |||||
| EXO 0748676 | 10 | 3.8 h | 0.6–10 | 34 | -llNot constrained. | Díaz Trigo et al. (2006) | |||||
| XB 1323619 | 10 | 2.9 h | 0.6–10 | 1.8 | -llNot constrained. | Boirin et al. (2005) | |||||
| X 1624490 | 2.25 | h | 1–10 | 1.2 | Xiang et al. (2009) | ||||||
| 190 | |||||||||||
| GX 131 | MCD dominant | 24 dayccSystematic errors due to the installation of the polarizer (3% of the observed magnitude at the maximum) are included in the data of the April observations. | 10–100 | 4.2–4.5 | fulliiBolometric luminosity. | 1–10 | Ueda et al. (2004) | ||||
| IGR J174802446 | 1.26 | 5.5 | 21 hddPapitto et al. (2011). | 3ggEstimated from the Fe XXV absorption line. | 3ggEstimated from the Fe XXV absorption line. | 0.5–10 | 123 | 3100 | mmThe line width when the Gaussian model is applied. | Miller et al. (2011) | |
| 2hhEstimated from the Fe XXVI absorption line. | 4.3hhEstimated from the Fe XXVI absorption line. | 9 | 500 | mmThe line width when the Gaussian model is applied. | |||||||
| Cir X-1 | 6 | 16.6 day | 2–10 | 4.3 | 300 (fixed) | Schulz et al. (2008) | |||||
| 2–10 | 33 | 300 (fixed) | |||||||||
| 4U 163047 | high/soft state | 10 | unknown | 5–19 | 4.38–4.88 | fulliiBolometric luminosity. | 0.1–1 | (120)–1740 | 500 (fixed) | Kubota et al. (2007) | |
| H 174332aaObservation 1 in Miller et al. (2006b). | high/soft state | 8.5 | unknown | 5.7 | 0.5–10 | 0.01–1 | iiBolometric luminosity. | llNot constrained. | Miller et al. (2006b) | ||
| GRO J165540 | high/soft state | 3 | 2.6 day | 30–100 | 3 | 9– | 0.1–0.3 | -llNot constrained. | hhEstimated from the Fe XXVI absorption line. | Ueda et al. (1998) | |
| GRO J165540 | high/soft state | 3.2 | 0.5–200 | 40 | Díaz Trigo et al. (2007) | ||||||
| 130 | |||||||||||
| GRO J165540 | high/soft state | 3.2 | 12–50 | 4.8–5.7 | 0.65–10 | 0.1–0.25 | 300–1600 | 300 (fixed) | Miller et al. (2008) | ||
| GRS 1915105 | “low/hard” state | 12.5 | dayeeGreiner et al. (2001). | 2–10 | 740hhEstimated from the Fe XXVI absorption line. (fixed) | Kotani et al. (2000) | |||||
| GRS 1915105 | “low/hard” state | 12.5 | fulliiBolometric luminosity. | jj. | iiBolometric luminosity. | hhEstimated from the Fe XXVI absorption line. | Lee et al. (2002) | ||||
| GRS 1915105 | high/soft state | 12 | 4.2–4.3 | (6.6–8.3) | 0.01–100 | 2–6 | 90–560 | 70–200 | Ueda et al. (2009) | ||
| GX 3394 | intermediate statebbphabs*xsabs1*simpl*bhspecAll the object frames are added for each night separately to measure the magnitudes. | 5 | 1.76 dayffHynes et al. (2003). | 0.02 | 3 | 0.5–10 | 20kkCalculated by assuming the thickness and number density of the absorber as km and cm-3, respectively. | 510nnThe results of the Ne II line at Å, from which the largest blue shift is obtained. | 410nnThe results of the Ne II line at Å, from which the largest blue shift is obtained. | Miller et al. (2004) | |
| MAXI J1305704 | high/soft state | 6 | h | 0.0136–13.6 | 300 (fixed) | This work | |||||
| MAXI J1305704 | high/soft state | 0 (fixed) | 300 (fixed) | ||||||||
| MAXI J1305704 | low/hard state | ||||||||||
| (non-dip) | 300 (fixed) | This work | |||||||||
| MAXI J1305704 | (deep dip) | 300 (fixed) | |||||||||
| MAXI J1305704 | (shallow dip) | 300 (fixed) |