1–2 \pagerange1–2
Formation and evolution of an active region filament
Abstract
Several scenarios explaining how filaments are formed can be found in literature. In this paper, we analyzed the observations of an active region filament and critically evaluated the observed properties in the context of current filament formation models. This study is based on multi-height spectropolarimetric observations. The inferred vector magnetic field has been extrapolated starting either from the photosphere or from the chromosphere. The line-of-sight motions of the filament, which was located near disk center, have been analyzed inferring the Doppler velocities. We conclude that a part of the magnetic structure emerged from below the photosphere.
keywords:
Sun: filaments, prominences, Sun: photosphere, Sun: chromosphere, Sun: magnetic fields, techniques: polarimetric1 Introduction
Owing to new observations and a continuous improvement of simulations, in the last years the solar community has published several works concerning the formation and evolution of filaments. Active region (AR) filament studies are still scarce in literature, and it is not clear how similar their formation process is to that of the quiescent (QS) ones. Generally speaking, there are two proposed scenarios that try to explain the formation of filaments: (1) the sheared arcade (SA) model and (2) the flux rope emergence (FRE) model. The difference between both models mainly exists in the atmospheric height of filament formation. On the one hand, in the SA model the filament is formed in the corona by shearing motions in addition to converging flows at the polarity inversion line (PIL) and reconnection processes. As a result, the magnetic structure can be a flux rope (e.g., van Ballegooijen & Martens, 1989) or a dipped arcade (e.g., Antiochos et al., 1994). On the other hand, the FRE model assumes that a flux rope emerges from below the photosphere ascending into the corona (e.g., Okamoto et al., 2008). Kuckein et al. (2012a) provide an extensive discussion and references related to these two models. In this work, we present a multi-height study of the magnetic structure of an AR filament observed in July 2005 and investigate whether this filament fits into the SA or FRE model.
2 Observations
The present analysis is mainly based on spectropolarimetric observations acquired with the Tenerife Infrared Polarimeter attached to the Vacuum Tower Telescope (VTT) in Tenerife (TIP-II; Collados et al., 2007). The data sets of an AR filament belonging to NOAA 10781 were taken close to disk center (0.91 and 0.95) on 2005 July 3 and 5. However, H images from Big Bear Solar Observatory (BBSO; Denker et al., 1999) show that the filament was already present a few days before, on July 1. Line-of-sight (LOS) magnetograms from the Michelson Doppler Imager (MDI, Scherrer et al., 1995) show that below the filament an extensive facular region is seen with two polarities clearly separated by the PIL. Between July 1–7 the opposite polarities became more compact, almost touching each other at the PIL, and then broadened again. During this event, with characteristics of the “sliding door” effect (an effect firstly described by Okamoto et al., 2008), new pores and orphan penumbrae emerged at the PIL (see Kuckein et al., 2009, 2012a, for a detailed description and images). Okamoto et al. (2008) related this effect to the emergence of a flux rope below an AR filament.
The spectral region observed with TIP-II comprised the photospheric Si i 10827 Å line, the chromospheric He i 10830 Å triplet, and two telluric lines with a spectral sampling of 11.04 mÅ px-1. Therefore, with this instrument it is possible to simultaneously analyze the vector magnetic field at two different heights in the solar atmosphere. In this work, we will concentrate on the second set of spectropolarimetric data taken on July 5 between 7:36 and 14:51 UT. The observing strategy was to scan the filament with the slit parallel to the PIL with a scanning step size of 0.3′′. The pixel size along the slit was 0.17′′.
The vector magnetic field was inferred by carrying out inversions of the four Stokes parameters with two different inversion codes: (1) for the Si i line we used the SIR code (Stokes Inversion based on Response functions; Ruiz Cobo & del Toro Iniesta, 1992) and (2) for the He i triplet we used a Milne-Eddington-based inversion code (MELANIE; Socas-Navarro, 2001). The 180∘-ambiguity was solved using the AZAM code (Lites et al., 1995). The LOS velocities were determined from the inversions and converted to an absolute scale, i.e., corrections for orbital motions and the gravity shift were made (see Kuckein et al., 2012b, for a full description of the velocity calibration).
3 Results
The inferred magnetic field strength in this AR filament is 600–800 G (Kuckein et al., 2009, 2012a), which was the strongest value detected so far inside AR filaments. Recently, other authors have also reported similar strong magnetic fields inside filaments, (e.g., Guo et al., 2010; Xu et al., 2012). Therefore, it seems to be rather common to find these strong fields inside AR filaments.
The set of inferred chromospheric and photospheric vector magnetograms indicate that the magnetic structure which supports the filament is a flux rope. To substantiate this result, non-linear force-free (NLFF) field extrapolations, starting from the photosphere and chromosphere, were carried out. The extrapolations confirmed the presence of a flux rope structure, which lay surprisingly low in the atmosphere and had its axis located at 1.4 Mm above the solar surface (see Yelles Chaouche et al., 2012, for a complete description of the extrapolations and results).
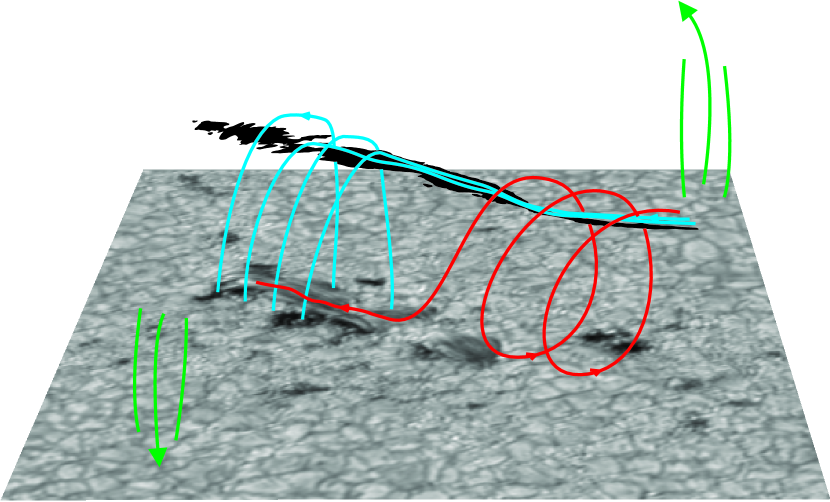
Based on the vector magnetograms, we constructed the sketch presented in Fig. 1. The cartoon shows a gray-scale continuum image from the Dutch Open Telescope (DOT) on 2005 July 5. In the middle of the image, the aforementioned pores and orphan penumbrae that started to appear on July 4 are seen. The reconstruction of the filament is represented as a black structure which was extracted from the corresponding DOT H image. The filament follows the PIL. The positive (negative) polarity is at the right (left) side of the PIL when viewing the figure from the lower right corner. There are three different magnetic field lines represented in the cartoon. (1) The dark red field lines are based on the photospheric vector magnetograms. These field lines are aligned along the PIL where pores and orphan penumbrae are seen. However, outside the orphan-penumbrae region, the field lines have an inverse polarity configuration (pointing from negative to positive polarity). (2) The light blue field lines were derived from the chromospheric vector magnetograms. In this case, the field lines are parallel to the filament axis outside the orphan-penumbrae region, whereas inside, the field lines show a normal configuration (the field lines point from positive to negative polarity). (3) The green field lines, close to the corners of the image, represent the positive (upward pointing arrow) and negative (downward pointing arrow) polarity of the faculae.
To shed light on the formation of the flux rope it was crucial to infer the LOS velocities. Calibrations using two telluric lines and corrections related to orbital motions and the gravity shift were carefully carried out (see Kuckein et al., 2012b).
The motions of the transverse magnetic fields in the photosphere, in the orphan-penumbrae area, show, on a seven-hour average, a slow upward trend. Above, in the chromosphere, the filament moves on average downward. Nevertheless, there are clearly localized upflow areas (see Fig. 3 in Kuckein et al., 2012b). This indicated, when looking at the orphan-penumbrae area in Fig. 1, that the axis of the flux rope is slowly rising. Half of the flux rope is below the surface, which seems to be responsible for the formation of the orphan penumbrae. The upper part of the flux rope reaches the chromosphere where groups of field lines produce the upflow patches detected in the chromosphere. The portion of the filament that does not have orphan penumbrae below behaves differently. Out of seven maps, the first four show on average upward motions of the transverse fields. The other three show on average velocities close to zero. The chromospheric counterpart shows downward motions.
4 Discussion
The initial formation phase of this AR filament cannot be described with the presented data sets because the filament was already present prior to our observations. However, we have shown that AR filaments can have extremely low-lying flux rope structures (even as low as the photosphere) that support the filament. This structure can eventually emerge from below the photosphere, as seen in our data sets, generating pores and orphan penumbrae along the PIL. Therefore, AR filaments can have a photospheric counterpart. In the chromosphere, the filament’s plasma is being pushed upward by the magnetic field that expands from the emerging flux rope structure. At the same time, the emerging flux rope supports the filament material against gravity. Altogether, the present results favor a flux rope emergence scenario.
Acknowledgements.
CK greatly acknowledges the travel support received from the IAU. The VTT is operated by the Kiepenheuer-Institute for Solar Physics in Freiburg, Germany, at the Spanish Observatorio del Teide, Tenerife, Canary Islands. The National Center for Atmospheric Research (NCAR) is sponsored by the National Science Foundation (NSF). The authors would like to thank C. Denker for carefully reading the manuscript.References
- Antiochos et al. (1994) Antiochos, S. K., Dahlburg, R. B., & Klimchuk, J. A. 1994, ApJ 420, L41
- Collados et al. (2007) Collados, M., Lagg, A., Díaz García, J. J., et al. 2007, ASP-CS 368, 611
- Denker et al. (1999) Denker, C., Johannesson, A., Marquette, W., et al. 1999, Solar Phys. 184, 87
- Guo et al. (2010) Guo, Y., Schmieder, B., Démoulin, P., et al. 2010, ApJ 714, 343
- Kuckein (2012) Kuckein, C. 2012, PhD Thesis, Universidad de La Laguna (Tenerife, Spain)
- Kuckein et al. (2012b) Kuckein, C., Martínez Pillet, V., & Centeno, R. 2012b, A&A 542, A112
- Kuckein et al. (2012a) Kuckein, C., Martínez Pillet, V., & Centeno, R. 2012a, A&A 539, A131
- Kuckein et al. (2009) Kuckein, C., Centeno, R., Martínez Pillet, V., et al. 2009, A&A 501, 1113
- Lites et al. (1995) Lites, B. W., Low, B. C., Martinez Pillet, V., et al. 1995, ApJ 446, 877
- Okamoto et al. (2008) Okamoto, T. J., Tsuneta, S., Lites, B. W., et al. 2008, ApJ 673, L215
- Ruiz Cobo & del Toro Iniesta (1992) Ruiz Cobo, B., & del Toro Iniesta, J. C. 1992, ApJ 398, 375
- Scherrer et al. (1995) Scherrer, P. H., Bogart, R. S., Bush, R. I., et al. 1995, Solar Phys. 162, 129
- Socas-Navarro (2001) Socas-Navarro, H. 2001, ASP-CS 236, 487
- van Ballegooijen & Martens (1989) van Ballegooijen, A. A., & Martens, P. C. H. 1989, ApJ 343, 971
- Xu et al. (2012) Xu, Z., Lagg, A., Solanki, S., & Liu, Y. 2012, ApJ 749, 138
- Yelles Chaouche et al. (2012) Yelles Chaouche, L., Kuckein, C., Martínez Pillet, V., & Moreno-Insertis, F. 2012, ApJ 748, 23