Coupled magnetic and ferroelectric excitations in PbFe1/2Nb1/2O3
Abstract
A neutron scattering investigation of the magnetoelectric coupling in PbFe1/2Nb1/2O3 (PFN) has been undertaken. Ferroelectric order occurs below 400 K, as evidenced by the softening with temperature and subsequent recovery of the zone center transverse optic phonon mode energy (). Over the same temperature range, magnetic correlations become resolution limited on a terahertz energy scale. In contrast to the behavior of nonmagnetic disordered ferroelectrics (namely Pb(Mg,Zn)1/3Nb2/3O3), we report the observation of a strong deviation from linearity in the temperature dependence of . This deviation is compensated by a corresponding change in the energy scale of the magnetic excitations, as probed through the first moment of the inelastic response. The coupling between the short-range ferroelectric and antiferromagnetic correlations is consistent with calculations showing that the ferroelectricity is driven by the displacement of the body centered iron site, illustrating the multiferroic nature of magnetic lead based relaxors in the dynamical regime.
Introduction – Creating materials with a strong coupling between ferroelectric and magnetic order has been a central goal of research in transition metal compounds Cheong and Mostovoy (2007); Kimura et al. (2003); J. F. Scott (2012). Fundamentally, this phenomenon is startling, since typically ferroelectricity results from relative shifts of negative and positive ions with closed electronic configurations, while magnetism is related to ordering of spins of electrons in incomplete ionic shells. While multiferroicity has now been reported in a variety of compounds, as typified by compounds like BiFeO3 and BiMnO3, coupling between the magnetic and polar orders is often weak and occurs on widely disparate temperature scales dos Santos et al. (2002). Magnon-phonon interactions are typically also very weak in improper multiferroics like TbMnO3, where only tiny shifts of 0.1 meV in phonon frequencies due to magnetic ordering have been measured Rovillain et al. (2010). By contrast, we demonstrate a strong intrinsic coupling in a disordered ferroelectric between short range ferroelectric and magnetic orders by measuring the magnetic and lattice fluctuations. Recently, the multiferroic nature of disordered systems has attracted considerable attention and the correlation between short range ferroelectric and antiferromagnetic orders has been reported for several different systems Shvartsman et al. (2008); Yamaguchi et al. (2012); Soda et al. (2011). For example, in the magnetic relaxor BiFeO3-BaTiO3, elastic neutron diffraction studies suggest the polar nanoregions are identical to short range magnetic nanodomains Soda et al. (2011).
Some of the most studied nonmagnetic ferroelectric compounds are the lead based relaxors with the chemical form PbBO3, where the B site is a mixture between two different ions Park and Shrout (1997); Ye (1998); Bokov and Ye (2006). PbMg1/3Nb2/3O3 (PMN) and PbZn1/3Nb2/3O3 (PZN) are prototypical relaxors in which the random occupancy of the B site results in a suppression of a classical ferroelectric phase transition, replaced by short range ferroelectric order. These polar nanoregions manifest as a strong temperature dependent neutron and x-ray diffuse scattering cross-section which has a significant dynamic component. The latter component tracks the frequency dependence of the dielectric constant Stock et al. (2010a); Hirota et al. (2002); Xu et al. (2004); Stock et al. (2007); Gehring et al. (2009). A dynamic signature of ferroelectricity in these compounds is a soft and transverse optic phonon mode located at the Brillouin zone center. The dielectric constant is related to the soft phonon energy () via the Lyndane-Sachs-Teller relation- Lyddane et al. (1941). PbTiO3 displays a conventional soft ferroelectric mode, where softens to a minimum energy at the structural transition and then recovers linearly below the phase transition Shirane et al. (1970); Kempa et al. (2006). Even though a long-range ferroelectric ground state is absent in relaxors PMN and PZN, a soft zone center transverse optic mode is present and recovers at the same temperature where static short range polar correlations are onset Wakimoto et al. (2002); Stock et al. (2004); Cowley et al. (2011).
The disordered compound PbFe1/2Nb1/2O3 (PFN) is also based on a perovskite structure with the B site a mixture of nonmagnetic Nb5+ and magnetic Fe3+ (, =5/2) ions. Two structural transitions are reported, the cubic unit cell transforming to tetragonal () at 376 K, followed by a monoclinic structure (=89.94∘) below 355 K Lampis et al. (1999). The dielectric constant is peaked near 375 K, however is broad in temperature as well as frequency dependent, indicative of short range ferroelectric order Majumder et al. (2006). A weak cusp at K and history dependence below K has been observed in measurements of the bulk magnetization Bokov et al. (1962); Blinc et al. (2008); Bhat et al. (2004). Neutron diffraction measurements have observed short-range three dimensional antiferromagnetic correlations peaked at a wave vector =(1/2,1/2,1/2) coexisting with a magnetic Bragg peak indicative of a long-range magnetically ordered component. The presence of two distinct lineshapes for the magnetic diffraction has led to models involving two phases defined by different Fe3+ clustering sizes Kleemann et al. (2010).
Motivated by dielectric measurements suggestive of a coupling between the magnetic and ferroelectric orders (Ref. Yang et al., 2004) we present a neutron scattering study of the lattice and magnetic fluctuations in PFN performed at the PUMA spectrometer (FRM2 reactor) on a 1 cm3 sample. We show that the temperature dependent lattice dynamics are dominated by a soft transverse optic mode measured near the nuclear zone center. Although recovers, it deviates from the linear response observed in other ferroelectrics (namely PbTiO3, PMN, and PZN). An investigation of the first moment of the magnetic inelastic response suggests that this is compensated by a corresponding change in the energy scale of magnetic excitations, indicative of magnetoelectric coupling in the dynamical regime. These measurements are complementary to Raman scattering studies Correa et al. (2011); Garc a-Flores et al. (2011), where the zone center phonon response is also explored, typically at higher characteristic energies. While Correa et al. Correa et al. (2011) report anomalous shifts with sublattice magnetization of the Fe-O phonon mode frequency centered around 87 meV, the shifts are very small ( cm-1 or 0.37 meV). The so called mode associated with Pb localization around 65 cm-1 (8 meV) is completely unaffected by the antiferromagnetic transition observed in their sample. We show that the magnetoelastic effects observed using inelastic neutron scattering in the low energy regime are much more dramatic. More generally, using Raman techniques, the assignment of phonon modes in the cubic state of the relaxor ferroelectric is controversial Correa et al. (2011), making neutron scattering invaluable.
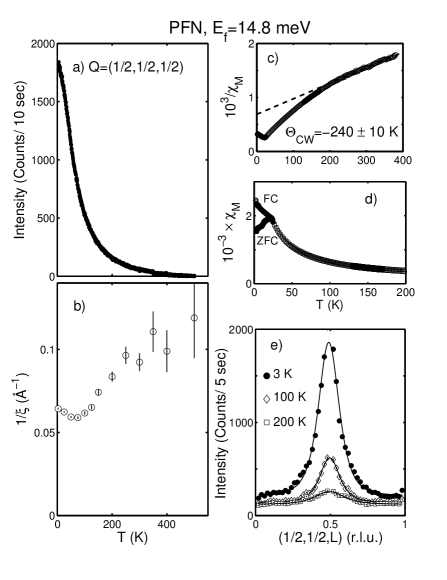
Static magnetic properties – Figure 1 plots the static magnetic properties of PFN measured through the use of elastic neutron scattering (with an energy resolution =1.25 meV=0.30 THz) and static bulk magnetization. Panel shows a plot of the elastic magnetic intensity as a function of temperature at =(1/2,1/2,1/2), located at the peak of the magnetic intensity (see panel ). It shows only a smooth growth of intensity and no anomaly indicative of a well defined phase transition. The increase in elastic magnetic intensity is mimicked by the static magnetization (panel which shows a deviation from Curie-Weiss behavior over a similar temperature range. The combination of the half-integer position in momentum and its broad lineshape indicates the origin of the scattering is from clusters of Fe3+ ions. A Lorentzian squared lineshape was used to model the data, motivated by random fields Birgeneau et al. (1983). Such random fields are thought to be the underlying cause of the avoided long range magnetic ordering, which would be characterized by a Bragg peak. Similar ideas have been proposed to understand the ferroelectric properties of disordered PMN and PZN Westphal et al. (1992); Fisch (2003). Given the large vertical resolution on the PUMA spectrometer (Ref. Link et al., 2000), we integrated over the vertical direction analytically, giving the power to the momentum dependence shown below. The magnetic correlation lengths (panel ) were thus extracted from fits to a resolution convolution of the following lineshape (examples illustrated in ):
where is the calibration constant, is 73 mbarns sr-1, is the Landé factor, is the Fe3+ magnetic form factor, is the magnetic moment size, is the volume of the Brillouin zone, the correlation length, is the Debye-Waller factor, and is the lattice constant. Performing scans along all high symmetry directions ([111], [110], and [001]), the magnetic correlation length is found to be spatially isotropic within error. As demonstrated in Fig. 1 , this quantity never diverges, but saturates at the small value of =17Å with an inflection point around 80 K. The inflection point in the temperature dependent correlation length is mimicked by the static magnetization presented in Fig. 1 , albeit at much lower temperatures of 25 K. The divergence between field-cooled (FC) and zero-field cooled (ZFC) magnetization reflects the development of a spin-glass-like state at low temperatures and is close to the 20 K anomaly observed using muon spin relaxation Rotaru et al. (2009). While there is apparent sample dependence evidenced by the different values quoted in the literature for this divergence in the magnetization (27.6 K Kumar et al. (2008),20 K Rotaru et al. (2009), and 10.6 K Kleemann et al. (2010)), as pointed out in Ref. Falqui et al., 2005, the exact value may be strongly technique and field dependent. The differing onset temperatures of spin glass-like ordering produced by different techniques (neutrons - 80 K compared to static magnetization - 25 K) which probe different timescales is similar to results published on canonical spin glasses and frustrated magnets, where the magnetic correlations are dominated by slow fluctuations over a broad frequency range, sampled with differing energy resolutions Stock et al. (2010b); Murani and Heidemann (1978).
The high temperature fit of the static magnetization yields a Curie constant of =-240 10 K which is a measure of the average Fe3+-Fe3+ exchange coupling. The negative sign indicates antiferromagnetic coupling between the spins. Within the mean-field approximation (with =3 neighbors and ) gives an estimate of the average meV 28 K. This implies a magnetic band width of the order of 10 meV (). The energy scale of the magnetic coupling is consistent with the presence of strong low energy magnetic spectral weight at high temperatures, within the spectrometer resolution (Fig. 1).
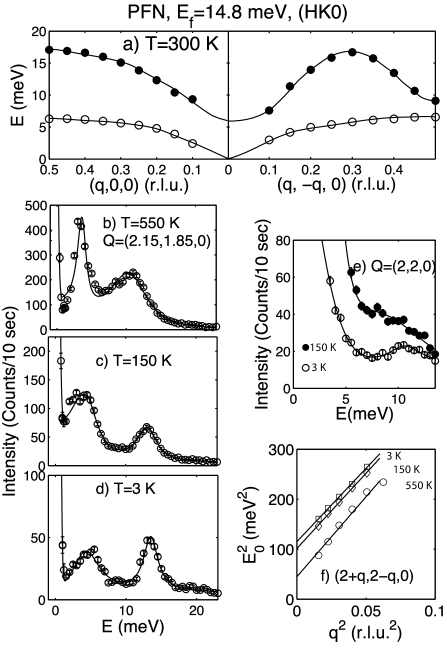
Ferroelectric properties – The lattice dynamics are similar in structure and energy scale to PMN and PbTiO3 Swainson et al. (2009); Tomeno et al. (2006); Hlinka et al. (2006). The phonons are described by a transverse optic mode which is gapped at the nuclear zone center and a lower energy acoustic mode which is gapless. The dispersion near the nuclear zone center is shown in Fig. 2 and illustrative constant- scans are shown in panels . The constant- scans show there is little change in frequency in the low-energy acoustic mode. However, the higher energy optic mode gradually hardens as the temperature is decreased, as expected for the recovery from a structural transition. In a similar manner to the case of PMN, we observed the optic mode is over damped in energy near the nuclear zone center, plotted in panel , where a very broad and unresolvable peak was observed at 150 K. A more well defined peak at 11 meV is observed at 3 K Stock et al. (2012). To extract the zone center soft mode energy, we rely on the optic mode frequencies at finite away from the zone center and fit the results to . and are respectively the optic mode frequency at the zone center and a temperature independent measure of the curvature near the zone center. Representative results from this analysis are plotted in panel and where the zone center frequency could be measured, good agreement was observed. This method has been applied before to the relaxors and found to be in good agreement with zone center scans, as well as Raman data Cao et al. (2008); Shirane et al. (1970).
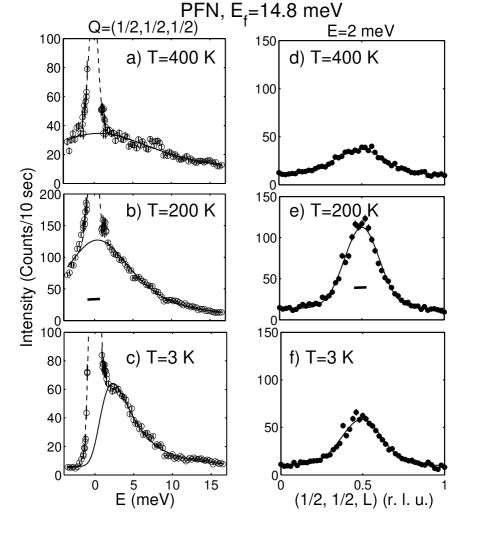
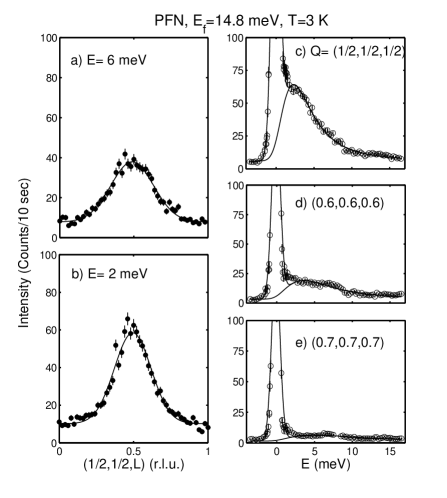
Magnetic dynamics – The temperature dependent magnetic dynamics are illustrated in Fig. 3 through constant =(1/2,1/2,1/2) scans (panels ) and constant = 2 meV scans (panels ). The fluctuations are dominated by a peak at =(1/2, 1/2, 1/2) which is both momentum and energy broadened, characteristic of short range and glass-like dynamics. The dynamic magnetic response is not dispersive and is overdamped for all temperatures investigated. Constant =(1/2,1/2,1/2) scans were fit to a resolution convolved damped harmonic oscillator as described in the supplementary information.
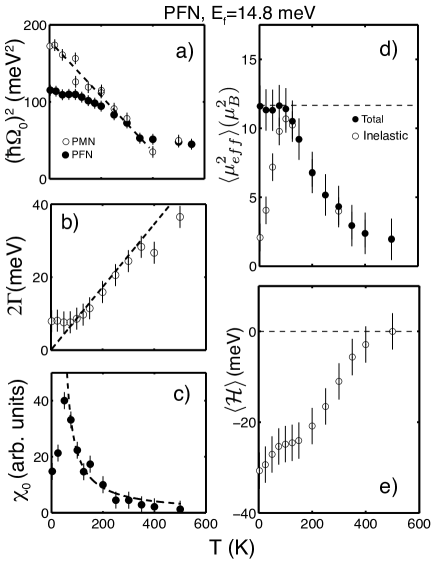
The temperature variation of (proportional to ), the timescale of the magnetic fluctuations (), and the susceptibility () at =(1/2, 1/2, 1/2) are illustrated in Fig. 4 . The energy of the soft optic mode in PMN is also plotted in Fig. 4 , showing a linear recovery down to low temperatures Stock et al. (2005); Wakimoto et al. (2002). For comparison, the data from PMN has been scaled by a factor of 1.4 to agree with PFN at 400 K. While at temperatures above 100 K the zone center energy tracks the measured response in prototypical relaxors (such as PMN), a significant deviation from the linear recovery is observed at low temperatures.
The linewidth of the magnetic fluctuations measured at =(1/2,1/2,1/2) is plotted in Fig. 4 and illustrates a linear decrease towards saturation at 80 K. The dashed line is given by , demonstrating that the energy scale of the magnetic fluctuations at high temperatures is set by . Figure 4 illustrates the susceptibility derived from fits shown in Fig. 3. The dashed line is a high temperature fit to with a deviation at 80 K - the same temperature as the inflection point in the elastic correlation length (Fig. 1 ) and the saturation of the inelastic linewidth (Fig. 4 ).
Given the broad nature of the magnetic response in momentum and energy of our data and the ambiguity over its functional form, it is important to ensure all the spectral weight is accounted for. In general, the total integrated magnetic intensity over all momentum and energy transfers is a conserved quantity satisfying the zeroeth moment sum rule. We calculated the zeroeth moment sum (Fig. 4 ) by integrating the magnetic intensity over the and range presented in Fig.3. The data were normalized against the known cross section of an acoustic phonon. The dashed line is the expected value based on a moment for Fe3+, indicating the experiment indeed probed all of the magnetic scattering. The filled points are the total spectral weight summing over the elastic and inelastic channels, while the open circles represent the inelastic component. The difference at low temperatures corresponds to an estimate of the total spectral weight measured to be static, or within resolution limits (0.3 THz). The decrease of the spectral weight with increasing temperature indicates the magnetic response extends to higher energies not directly probed.
The deviation of from linearity (Fig. 4) differs from nonmagnetic counterparts PMN and PZN and is suggestive of a coupling to another energy scale. Given the magnetic response is strongly damped (Fig. 3 ), we have investigated the magnetic energy scale through a study of the first moment calculated from the Hohenberg Brinkman (Ref. Hohenberg and Brinkman, 1974) sum rule. The sum rule is a general result for isotropic correlations and is applicable to the case where no sharp peak is observed in a constant scan:
The integration was performed at =(1/2,1/2,1/2) and is the distance between nearest neighbors. The change in the first moment with temperature is plotted in Fig. 4 , showing a substantial reduction with decreasing temperature. The change is of order the expected change in energy between the soft optic phonon in PFN and PMN, indicating a coupling between the two orders.
Summary and Conclusions – Our results illustrate that in the presence of short-range magnetic order, the soft phonon dynamics are directly altered from the linear recovery in observed in classic and disordered ferroelectrics. The first moment, a measure of the magnetic energy scale, illustrates the change in energy is taken up by the magnetic spin terms demonstrating coupling between the two orders. Such a coupling may be expected given the local bonding environment in PFN. The ferroelectric order in compounds of the form ABO3 has been found to be determined by the condensation of predominately the Last and Slater phonon modes, with significant contributions from shifts in the A and O sites Harada et al. (1970). In the fully ordered case of PFN, the exchange interaction between two Fe3+ ions would involve orbitals from Pb and also O. Therefore, the hybridization associated with ferroelectric order would be expected to alter the exchange pathways coupling magnetic ions. Such a scenario has been suggested to exist in fully site ordered EuTiO3 Katsufuji and Takagi (2001). An alternate explanation is proposed as a result of calculations (Ref. Wang et al., 2001) which suggest that the ferroelectricity in PFN predominately originates from the displacement of the Fe3+ site, the ratio of the displacement of Fe3+ to Nb5+ being greater than 10. Such a large difference in displacement could provide a route for explaining the strong coupling between the two orders observed here.
Strong magnetoelectric coupling appears to be favored in disordered systems where the symmetry contraints of the lattice are relaxed, as in compounds like pervoskite (Sr,Mn)TiO3 and nonperovskite (Ni,Mn)TiO3 Shvartsman et al. (2008); Yamaguchi et al. (2012). However, enhanced dielectric constants have been reported previously in a number of candidate materials for multiferroicity, which were later shown to arise from nanoscale disorder Zhu et al. (2007); Ruff et al. (2012). Using a microscopic technique robust against such extrinsic effects, we have found evidence of coupling between the short range magnetic and ferroelectric orders in the archetypal ferroelectric PFN. The temperature dependence of associated with the soft transverse optic mode, sensitive to ferroelectric correlations, deviates strongly from the linear recovery observed in classic ferroelectrics as well as prototypical nonmagnetic relaxors Pb(Mg,Zn)1/3Nb2/3O3.
We are grateful for funding from EU-NMI3, the Carnegie Trust for the Universities of Scotland, STFC, and Deutsche Forschungsgemeinschaft Grant TRR 80.
I Appendix
Here we present supplementary information regarding the experimental details, spectrometer calibration, and sum rules used in the main text. Supplementary data regarding the momentum dependence of the magnetic scattering are also presented. The data demonstrate the absence of well-defined spin waves and show that the magnetic excitations are represented by strongly overdamped fluctuations characteristic of the short range magnetic order.
I.1 Experimental details for the neutron scattering and susceptibility measurements
Neutron scattering measurements were performed on the PUMA thermal triple-axis spectrometer located at the FRM2 reactor (Garching, Germany). Two sets of measurements were performed with the 1 cm3 (with lattice constant =4.01 Å) sample to measure both the magnetic and lattice fluctuations. To measure the phonon dispersion curves and temperature dependence, the sample was oriented in the (HK0) scattering plane. The magnetic scattering was investigated with the sample mounted in the (HHL) plane. In both sets of measurements, the sample was cooled in a closed cycle refrigerator. A PG(002) vertically focused monochromator was used to select an incident energy Ei and the final energy was fixed at Ef=14.8 meV using a PG(002) flat analyzer crystal. The energy transfer was then defined as =Ei-Ef. To measure the phonon curves, it was desirable to obtain a high count rate at the expense of momentum resolution and therefore horizontal focusing was used on both the monochromator and the analyser. The horizontal focusing, on both the incident and scattered sides was removed for studies of the static and fluctuating magnetic response. Higher order contamination was reduced through the use of a pyrolytic graphite filter in the scattered beam. The counting time was determined by a low efficiency monitor placed in the incident beam and was corrected for variable contamination by higher order scattering from the monochromator using the same calibration described elsewhere. Stock et al. (2004)
Magnetization measurements were performed using a Quantum Design Materials Properties Measurement System (MPMS) on a small 7.0 mg piece of PFN taken from the same crystal growth batch. A field of 100 Gauss was applied along the axis and measurements under field cooled (FC) and zero-field cooled conditions were performed.
I.2 Spectrometer calibration constant derived from acoustic phonons
To calculate the zeroeth and first moments of the magnetic scattering, we have put the magnetic intensities on an absolute scale. The calibration constant for the experiment was obtained by measuring a low-energy acoustic phonon. In the long-wavelength (low ) limit, it can be assumed that we are in the hydrodynamic regime where only the center of mass is moving and the structure factor for the acoustic phonon will match that of the nearby nuclear Bragg peak. In the setup used on PUMA with an incident beam monitor with an efficiency , the measured energy integrated intensity takes the form
| (1) |
where is the spectrometer calibration constant, is the acoustic phonon frequency, is the Bose factor, the structure factor of the nuclear Bragg peak, the mass of the unit cell, and is the Debye Waller factor. For the measured magnetic scattering in the (HHL) scattering plane, we have used an acoustic phonon measured at =(0.15,0.15,2) and T=300 K as a reference with a horizontally flat monochromator and analyzer.
I.3 Lineshape- inelastic magnetic response
To describe the broad overdamped lineshape characterizing the magnetic dynamics, a relaxational form determined by a single energy scale described by was initially fit to the constant scans shown in Fig. 3 of the main text. Using this form for the magnetic dynamics, is related to the real part of the susceptibility. While this line shape described the data well at high temperatures, it failed to fit the response below 100 K. To correct this, following Ref. Shapiro, 1988, we fit the following damped harmonic oscillator lineshape to all temperatures.
| (2) | |||
where is a measure of the strength of the magnetic scattering, is the thermal population (or Bose) factor, the mode position, and is the half-width. To account for elastic scattering from static (defined by our resolution width) correlations, we have included a Gaussian in the fit centered at the elastic energy position. The parameter E0 was found to be temperature independent with E0=0.5 0.2 meV and can be physically interpreted as a magnetic anisotropy energy scale.
I.4 Zeroeth moment sum rule for magnetic scattering
The total integrated magnetic intensity over all momentum and energy transfers is a conserved quantity satisfying the zeroeth moment sum rule. Accounting for the orientation factor in magnetic neutron scattering and the fact that there is a Fe3+ site per unit cell, the integral over is,
| (3) |
Setting gives a total expected integral of 11.7 . This is in agreement with the total integrated moment discussed in the main text.
I.5 -E dependence
The zeroeth and first moment analysis outlined in the main text relies on a knowledge of the momentum dependence of the magnetic scattering with energy transfer. Fig. 5 illustrates the momentum dependence of the magnetic scattering through both constant energy (panels and also constant-Q scans (panels ). The constant energy scans have been fitted to a Gaussian centered at =() and show only a single central peak. The constant-Q scans also do not display any sign of spin waves or dispersion of the magnetic excitations. The first moment analysis has used the fact that the excitations are peaked only near =() and this is substantiated by the results.
References
- Cheong and Mostovoy (2007) S.-W. Cheong and M. Mostovoy, Nat. Mat. 6, 13 (2007).
- Kimura et al. (2003) T. Kimura, T. Goto, H. Shintani, K. Ishizaka, T. Arima, and T. Tokura, Nature 426, 55 (2003).
- J. F. Scott (2012) J. F. J. F. Scott, J. Mat. Chem. 22, 4567 (2012).
- dos Santos et al. (2002) A. M. dos Santos, S. Parasahr, A. Raju, Y. Zhao, A. Cheetham, and C. Rao, Sol. State. Commun. 49, 122 (2002).
- Rovillain et al. (2010) P. Rovillain, R. de Sousa, Y. Gallais, A. Sacuto, M. A. Measson, D. Colson, A. Forget, M. Bibes, A. Barthelemy, and M. Cazayous, Nat. Mat. 9, 975 (2010).
- Shvartsman et al. (2008) V. V. Shvartsman, S. Bedanta, P. Borisov, W. Kleemann, A. Tkach, and P. M. Vilarinho, Phys. Rev. Lett. 101, 165704 (2008).
- Yamaguchi et al. (2012) Y. Yamaguchi, T. Nakano, Y. Nozue, and T. Kimura, Phys. Rev. Lett. 108, 057203 (2012).
- Soda et al. (2011) M. Soda, M. Matsura, Y. Wakabayashi, and K. Hirota, J. Phys. Soc. Jpn 80, 043705 (2011).
- Park and Shrout (1997) S.-E. Park and T. Shrout, J. Appl. Pys. 82, 1904 (1997).
- Ye (1998) Z. G. Ye, Key Engineering Materials 155-156, 81 (1998).
- Bokov and Ye (2006) A. A. Bokov and Z. G. Ye, J. Mat. Sci. 41, 31 (2006).
- Stock et al. (2010a) C. Stock, L. VanEijck, P. Fouquet, M. Maccarini, P. M. Gehring, G. Xu, H. Luo, X. Zhao, J. F. Li, and D. Viehland, Phys. Rev. B 81, 144127 (2010a).
- Hirota et al. (2002) K. Hirota, Z. G. Ye, S. Wakimoto, P. M. Gehring, and G. Shirane, Phys. Rev. B 65, 104105 (2002).
- Xu et al. (2004) G. Xu, Z. Zhong, Y. Bing, Z. G. Ye, C. Stock, and G. Shirane, Phys. Rev. B 70, 064107 (2004).
- Stock et al. (2007) C. Stock, G. Xu, P. M. Gehring, H. Luo, X. Zhao, H. Cao, J. F. Li, D. Viehland, and G. Shirane, Phys. Rev. B 76, 064122 (2007).
- Gehring et al. (2009) P. M. Gehring, H. Hiraka, C. Stock, S. H. Lee, W. Chen, Z. G. Ye, S. B. Vakhrushev, and Z. Chowdhuri, Phys. Rev. B 79, 224109 (2009).
- Lyddane et al. (1941) R. H. Lyddane, R. G. Sachs, and E. Teller, Phys. Rev. 59, 673 (1941).
- Shirane et al. (1970) G. Shirane, J. D. Axe, J. Harada, and H. P. Remeika, Phys. Rev. B 2, 155 (1970).
- Kempa et al. (2006) M. Kempa, J. Hlinka, J. Kulda, P. Bourges, A. Kania, and J. Petzelt, Phase Transitions 79, 351 (2006).
- Wakimoto et al. (2002) S. Wakimoto, C. Stock, R. J. Birgeneau, Z. G. Ye, W. Chen, W. J. L. Buyers, P. M. Gehring, and G. Shirane, Phys. Rev. B 65, 172105 (2002).
- Stock et al. (2004) C. Stock, R. J. Birgeneau, S. Wakimoto, J. S. Gardner, W. Chen, Z. G. Ye, and G. Shirane, Phys. Rev. B 69, 094104 (2004).
- Cowley et al. (2011) R. A. Cowley, S. N. Gvasaliya, S. G. Lushnikov, B. Roessli, and G. M. Rotaru, Adv. in Phys. 60, 229 (2011).
- Lampis et al. (1999) N. Lampis, P. Sciau, and A. G. Lehmann, J. Phys.: Condens. Mat. 11, 3489 (1999).
- Majumder et al. (2006) S. B. Majumder, S. Bhattacharyya, R. S. Katiyar, A. Mannivannan, P. Dutta, and M. S. Seehra, J. Appl. Phys. , 1 (2006).
- Bokov et al. (1962) V. A. Bokov, I. E. Mylnikova, and G. A. Smolenskii, JETP 15, 447 (1962).
- Blinc et al. (2008) R. Blinc, V. V. Laguta, B. Zalar, B. Zupancic, and M. Itoh, Appl. Phys 104, 084105 (2008).
- Bhat et al. (2004) V. V. Bhat, K. V. Ramanujachary, S. E. Lofland, and A. M. Umarji, J. Magn. Magn. Mater 280, 221 (2004).
- Kleemann et al. (2010) W. Kleemann, V. V. Shvartsman, P. Borisov, and A. Kania, Phys. Rev. Lett. 105, 257202 (2010).
- Yang et al. (2004) Y. Yang, J.-M. Liu, H. B. Huang, W. Q. Zou, P. Bao, and Z. G. Liu, Phys. Rev. B 70, 132101 (2004).
- Correa et al. (2011) M. Correa, A. Kumar, S. Priya, R. S. Katiyar, and J. F. Scott, Phys. Rev. B 83, 014302 (2011).
- Garc a-Flores et al. (2011) A. F. Garc a-Flores, D. A. Tenne, Y. J. Choi, W. J. Ren, X. X. Xi, and S. W. Cheong, J. Phys. Cond. Mat 23, 015401 (2011).
- Birgeneau et al. (1983) R. J. Birgeneau, H. Yoshizawa, R. A. Cowley, G. Shirane, and H. Ikeda, Phys. Rev. B 28, 1438 (1983).
- Westphal et al. (1992) V. Westphal, W. Kleemann, and M. D. Glinchuk, Phys. Rev. Lett. 68, 847 (1992).
- Fisch (2003) R. Fisch, Phys. Rev. B 67, 094110 (2003).
- Link et al. (2000) P. Link, G. Eckold, and J. Neuhaus, Physica B 276-278, 122 (2000).
- Rotaru et al. (2009) G. M. Rotaru, B. Roessli, A. Amato, S. N. Gvasaliya, C. Mudry, S. G. Lushnikov, and T. A. Shaplygina, Phys. Rev. B 79, 184430 (2009).
- Kumar et al. (2008) A. Kumar, R. Katiyar, C. Rinaldi, S. Lushnikov, and T. Shaplygina, App. Phys. Lett. 93, 232902 (2008).
- Falqui et al. (2005) A. Falqui, N. Lampis, A. Geddo-Lehmann, and G. Pinna, J. Phys. Chem. B 109, 22967 (2005).
- Stock et al. (2010b) C. Stock, S. Jonas, C. Broholm, S. Nakatsuji, Y. Nambu, K. Onuma, Y. Maeno, and J.-H. Chung, Phys. Rev. Lett. 105, 037402 (2010b).
- Murani and Heidemann (1978) A. P. Murani and A. Heidemann, Phys. Rev. Lett. 41, 1402 (1978).
- Swainson et al. (2009) I. P. Swainson, C. Stock, P. M. Gehring, G. Xu, K. Hirota, Y. Qiu, H. Luo, X. Zhao, J. F. Li, and D. Viehland, Phys. Rev. B 79, 224301 (2009).
- Tomeno et al. (2006) I. Tomeno, Y. Ishii, Y. Tsunoda, and K. Oka, Phys. Rev. B 73, 064116 (2006).
- Hlinka et al. (2006) J. Hlinka, M. Kempa, J. Kulda, P. Bourges, A. Kania, and J. Petzelt, Phys. Rev. B 73, 140101 (2006).
- Stock et al. (2012) C. Stock, P. M. Gehring, H. Hiraka, I. Swainson, G. Xu, Z. G. Ye, H. Luo, J. F. Li, and D. Viehland, Phys. Rev. B 86, 104108 (2012).
- Cao et al. (2008) H. Cao, C. Stock, G. Xu, P. M. Gehring, J. Li, and D. Viehland, Phys. Rev. B 78, 104103 (2008).
- Stock et al. (2005) C. Stock, H. Luo, D. Viehland, J. F. Li, I. P. Swainson, R. J. Birgeneau, and G. Shirane, J. Phys. Soc. Jpn. 74, 3002 (2005).
- Hohenberg and Brinkman (1974) P. Hohenberg and W. F. Brinkman, Phys. Rev. B 10, 128 (1974).
- Harada et al. (1970) J. Harada, J. Axe, and G. Shirane, Acta Cryst A26, 1 (1970).
- Katsufuji and Takagi (2001) T. Katsufuji and H. Takagi, Phys. Rev. B 64, 054415 (2001).
- Wang et al. (2001) Y. Wang, W. Zhong, C. Wang, and P. Zhang, Phys. Lett. A 288, 45 (2001).
- Zhu et al. (2007) Y. Zhu, J. C. Zheng, L. Wu, A. I. Frenkel, J. Hanson, P. Northrup, and W. Ku, Phys. Rev. Lett. 99, 037602 (2007).
- Ruff et al. (2012) A. Ruff, S. Krohns, F.Schrettle, V.Tsurkan, P. Lunkenheimer, and A. Loidl, Eur. Phys. J. B 85, 290 (2012).
- Shapiro (1988) S. Shapiro, Spin Waves and Magnetic Excitations 22.2, 222 (1988).