Band filling effect on polaron localization in LaCaySr1-y)xMnO3 manganites
Abstract
We report on an a SR and 55Mn NMR investigation of the magnetic order parameter as a function of temperature in the optimally doped La5/8(CaySr1-y)3/8MnO3 and in the underdoped La1-xSrxMnO3 and La1-xCaxMnO3 metallic manganite families. The study is aimed at unraveling the effect of lattice distortions, implicitly controlled by the Ca-Sr isoelectronic substitution, from that of hole doping on the Curie temperature and the order of the magnetic transition.
At optimal doping, the transitions are second order at all values, including the (La5/8Ca3/8MnO3) end member. In contrast, they are first order in the underdoped samples, which show a finite (truncated) order parameter at the Curie point, including La0.75Sr0.25MnO3 whose is much higher than that of La5/8Ca3/8MnO3. The order parameter curves, on the other hand, exhibit a very minor dependence on , if truncation is excepted. This suggests that the effective exchange interaction between Mn ions is essentially governed by local distortions, in agreement with the original double-exchange model, while truncation is primarily, if not entirely, an effect of under- or overdoping. A phase diagram, separating in the plane polaron-driven first order transitions from regular second order transitions governed by critical fluctuations, is proposed for the LaCaySr1-y)xMnO3 system.
pacs:
76.60.-k, 76.75.+i, 75.47.Gk, 75.47.Lx, 74.62.DhI Introduction
Mixed valence manganites with the perovskite structure R1-xAxMnO3 (R=lanthanide, A=alkali-earth metal) have been the subject of renewed interest since the discovery of a colossal magnetoresistance (CMR) at suitable compositions, jin1994 probably the most spectacular manifestation of their half-metallic (i.e. spin-polarized) electronic transport. The interplay between half metallic conduction and ferromagnetism is generally understood on the basis of the spin-conserving transfer of an hole between two neighboring Mn ions, assisted by the ligand orbital, referred to as double exchange (DE). zener Due to the strong Hund-rule coupling between states and core shells, the hole transfer is energetically favored only in the presence of a ferromagnetic (FM) order. In turn, DE can be viewed at as an effective ferromagnetic exchange interactions between manganese ions, mediated by mobile holes. Such an interaction competes with antiferromagnetic (AF) terms (i.e. superexchange) dominant in the undoped or underdoped materials, where they lead to AF insulating phases. Above a critical hole concentration (e.g. in La1-xSrxMnO3), tokura_lsmo ; phadia_lsmo_pcmo double exchange dominates and drives the system into a FM-ordered half-metallic ground state. At finite temperatures, the fluctuating component of the magnetic moment behaves as a spin-flipping scattering term which reduces the polarization of charge carriers. The half-metallic band is disrupted at the Curie point , which also coincides with a metal-insulator (MI) transition.
While the general agreement on the major role of double exchange in the physics of CMR manganites has never been challenged since Zener’s work,zener the relevance of other interactions was stressed after their revival of interest in the nineties. For instance, Millis et al.millis96 pointed out that a detailed description of the MI transition at requires taking into account the electron-lattice coupling of the Mn3+ ion, which is large in view of its Jahn-Teller character. Such a coupling term contributes to the effective mass of holes and favors their localization into Jahn-Teller polarons above .
The critical temperature varies with doping and exhibits, for each manganite family, a maximum at an optimal hole concentration . hwang_cheong ; dagotto_revue It strongly depends, however, also on the A-site cations. For instance, ranges from 370 K in optimally doped La1-xSrxMnO3 (LSMO) down to approx. 268 K in La1-xCaxMnO3 (LCMO), while the Pr-Ca series (PCMO) does not exhibit any metallic FM phase. phadia_lsmo_pcmo ; phadia_lcmo The dependence of on the A-site isoelectronic substitution is understood in terms of the distortions and tilting of the MnO6 octahedra (minimal in LSMO, maximal in PCMO) induced by the size mismatch of the cation.attfield Such distortions reduce the overlap of the Mn an ligand wave functions, either bending the Mn-O-M bond or increasing the Mn-O bonding distance. Within the framework of Zener’s model, this also weakens the DE integral, resulting in a smaller electronic bandwidth and hence a lower .
The nature itself of the magnetic transition apparently depends on the electronic bandwidth. Inelastic neutron scattering,lynn 119Sn Mössbauer spectroscopy, mossbauer and 139La nuclear magnetic resonance (NMR), gubkin revealed a regular second order transition in nearly optimally doped LSMO and, on the other hand, ”truncated” (i.e. first-order) ones in LCMO and other narrow-band manganites. The truncation effect is apparent from the dispersion curve of magnetic neutron scattering, in the form of a spin wave stiffness which does not renormalize to zero at . lynn As seen from microscopic probes of magnetism like Mössbauer and NMR spectroscopies, which detect a hyperfine field directly proportional to the local magnetization, truncation shows up as a finite order parameter and a phase-separated magnetic state at the Curie point, whereby the volume of the ordered phase, rather than the order parameter, vanishes for . The first-order character of the transition indicates that the transition is not governed by critical magnetic fluctuations. The large oxygen isotopic effect on in LCMO isotope_nature demonstrates that lattice excitations, identified with Jahn-Teller polarons, are involved. The spin wave dispersion, hence the exchange coupling, on the other hand, are however unaffected by the oxygen isotope substitution. lynn These observations suggest that the MI transition is driven by the formation of a polaron phase above , which abruptly disrupts both the metallic state and the FM order.
The literature on the character of the magnetic transition, either first or second order, in CMR manganites, is nevertheless sparse. Moreover, each of the microscopic probes employed in such studies is affected by problems and limitations. For instance, neutron scattering can access the nature of the transition only indirectly through the spin wave stiffness, lynn contrary to the local probes of magnetism, which detect directly a hyperfine field proportional to the order parameter. Among the latter, however, Mössbauer spectroscopy requires substituting a non-magnetic ion at the Mn site, which perturbs appreciably the systems even at moderate substitutions, as it is apparent from the reduced .mossbauer On the other hand, zero field (ZF) NMR is not usually applicable in the critical region due to the drop of the resonance frequency and the divergence of the spin-spin relaxation rate as is approached, unless the truncation effect on the transition is severe.gubkin
In this paper we report an investigation of the order parameter in the optimally doped La5/8(CaySr1-y)3/8MnO3 (LCSMO) isoelectronic series as a function of . The Ca-Sr solid solution behaves as a virtual cation interpolating between Ca and Sr, and provides a continuous control over the induced lattice distortions, hence on the electronic bandwidth, at constant hole concentration. The two end members La1-xSrxMnO3 and La1-xCaxMnO3 are also investigated as a function of hole concentration in the underdoping regime, . The comparison of the and dependences is aimed at unraveling the effect of charge on the order parameter and the type of magnetic transition, from those of distortions. For reference, the crystal cell parameters and Mn-O-Mn bond angle are determined by X-ray diffraction.
The order parameter is studied as a function of temperature by combining ZF 55Mn NMR and muon spin rotation (SR). The two techniques effectively complement one another. SR overcomes the aforementioned limits of NMR close to the magnetic transitions, but is afflicted in turn by line broadening and anomalies in the precession frequencies at lower temperature, seemingly related to frozen local disorder at the muon site. The isotropic and essentially on-site hyperfine field at 55Mn, on the contrary, is insensitive to such disorder and exhibits smooth temperature dependencies. The combination of SR close to and NMR well below provides therefore a reliable microscopic determination of the order parameter.
We found second order transitions throughout the optimally doped LCSMO series and, in contrast, first order transitions in underdoped metallic LCMO () and LSMO (), despite the much higher in e.g. La0.75Sr0.25MnO3 than in optimally doped La5/8Ca3/8MnO3. These findings, along with the scaling properties of the order parameter curves, indicate that the effective exchange coupling is primarily governed by distortions and the truncation phenomenon by charge doping.
The paper is organized as follows. Section II provides a brief description of sample preparation and X-ray characterization, as well as of the experimental apparatus and methods. The experimental results achieved by SR, 55Mn NMR, and the combination of the two microscopic probes, are illustrated in distinct subsections of Sec. III. The effects of charge and lattice distortions the order parameter and the nature of the magnetic transition, as they appear from the two local probes of magnetism, are finally discussed in section IV. Two appendices deal with the couplings of the two probes to the local magnetic moments in metallic manganites. The nature of the -dependent hyperfine field at the 55Mn nucleus is dealt with in Appendix A, while the origin of the discrepancies between the internal fields and the relaxations experienced by muons and nuclei is discussed to some extent in Appendix B.
II Experiment
II.1 Sample preparation
The polycrystalline samples were obtained by a standard solid-state reaction from La2O3, CaCO3, SrCO3 and MnO2. Reagents were dehydrated for several hours in a furnace at 150 C for one day. The La2O3 was further heated for several days at 1100 C in order to eliminate any trace of lanthanum hydroxide. Reagents were ground by a Pulverisette 7 machine, weighed in stoichiometric amounts in inert and dry atmosphere, pelletized, fired in air at 1200 C for 12 hours in a furnace, and finally cooled slowly to room temperature. The reaction products were then reground and subject three times to the above thermal treatment - the last one at 1360 C for 20 hours - in order to ensure a complete decomposition of the carbonates.
The final characterization by X-ray powder diffraction revealed in the various samples a crystal structure belonging to the Rc or Pnma space groups, as appropriate of LSMO and LCMO, respectively. La5/8(CaySr1-y)3/8MnO3 with , showing a nanoscale admixture of the two structures, is a special case, discussed below. In any case, no spurious phases was ever detected.
II.2 X-ray characterization
Powder X-ray diffraction data from the LCSMO and LSMO samples were collected at room temperature using Cu-Ka radiation with a Thermo Electron Corporation X’tra® diffractometer equipped with a Si(Li) energy selective detector. Diffraction patterns were acquired in the range with a step of . Structural refinement was carried out for each composition by the Rietveld method implemented in the GSAS package.gsas The refinement was mostly aimed at determining the Mn-O bond lengths and Mn-O-Mn bond angles as a function of composition. In particular, we regard bond angles as the characteristic distortion parameters of the perovskite cell.
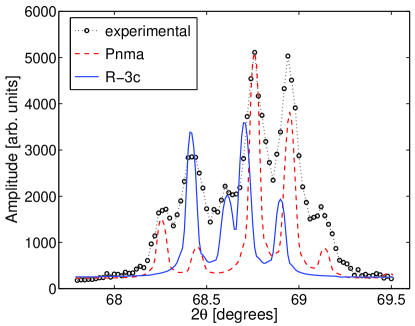
The Rietveld refinements yielded accurate fits of the X-ray powder diffraction patterns of La5/8(CaySr1-y)3/8MnO3 at the Sr-rich () and the Ca-rich () ends of the phase diagram. Low- LCSMO exhibits the rhombohedral symmetry of the Rc space group, while the high- compositions belong to the orthorhombic system (Pnma space group), in agreement with the literature. At intermediate cation substitutions , however, a single crystalline structure could not be refined. Typical diffraction data are shown in Fig. 1 for a representative sample, where a portion of a scan is plotted, overlaid to the diffraction patterns fitted according to the Rc and Pnma space groups. The observed profile qualitatively coincides with the superposition of the Rc and Pnma patterns, which indicates the coexistence of the two structures. The poor quantitative agreement of a two-component fit, as well as the excess linewidth of the observed peaks, however, rule out a macroscopic phase mixture, and rather point to the spontaneous segregation of nanoscopic orthorhombic and rhombohedral clusters. The same nanoscale phase separation, with similar intermiscibility limits of Ca and Sr, was previously reported by Y. P. Lee et al. in La0.7(CaySr1-y)0.3MnO3 thin films. YP_Lee
In the following, we restrict therefore our Rietveld analysis to the single-phase compositions of La5/8(CaySr1-y)3/8MnO3 and to underdoped LSMO, since the near-overlap of reflections from the two coexisting structures in LCSMO , each one with similar unit cell parameters, prevented a reliable quantitative assessment. Soft restraints were applied to the mean Mn-O distance, in order to achieve fit convergence and to account for the weak contribution to X-ray scattering from oxygen atoms. Such restraints were tuned on the basis of the known structural properties of manganese perovskites reported in a vast literature.
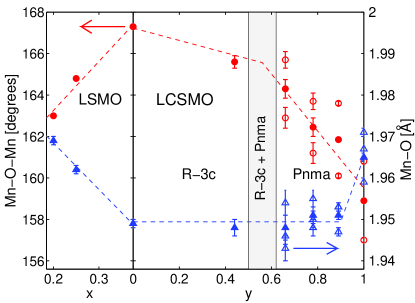
The refined values for the Mn-O-Mn angles and Mn-O distances in LCSMO are plotted in Fig. 2 as a function of . In the orthorhombic phases, exhibiting inequivalent Mn-O bonds in the unit cell, such quantities are split into multiplets (open symbols) by the the lower crystal symmetry. In this case, mean bond angles and lengths are also plotted (filled symbols), in order to allow a comparison of the cell parameters irrespective of the different crystal structures. The figure clearly shows that in the LCSMO system the deviation from the Mn-O-Mn collinearity, i.e. the tilting of the MnO6 octahedra, increases smoothly with increasing , without any apparent singularity at the transition from the Rc to the Pnma structure. Similarly, no clear anomaly is observed in the mean Mn-O bond length vs. , if we except a steep upturn as the LCMO composition is approached. The latter reflects the drop of below room temperature for , hence the crossing of the FM-PM phase boundary in the present scan at room temperature, which is also accompanied by a marked step in the lattice parameters. Radaelli
In the figure, the Mn-O-Mn and Mn-O bond angles and lengths in the La1-xSrxMnO3 samples as well are plotted vs. (left panel). A progressive decrease of the perovskite cell distortion and a contraction of the bond length are observed for increasing from underdoping to optimal doping. This trend agrees with an increased A-site mean cation size, hence a reduced deviation of the Goldschmidt tolerance factor from unit, at higher Sr concentration. cation_size
II.3 Magnetic characterization
The Curie temperature was measured in all samples by the simple radiofrequency (rf) apparatus described in Ref. lpsmo2008, . A precise determination of is also obtained directly from the longitudinal muon spin polarization data (see below), which are however available only for a subset of our samples. The rf method consists in recording the temperature-dependent inductance of a small coil filled with the sample, powdered in order to minimize the diamagnetic shielding by eddy currents. The inductance depends on the volume magnetic rf susceptibility , the demagnetization coefficient ( for approximately spherical grains), and the filling factor of the coil, according to the relation
| (1) |
where is inductance of the empty coil. below , given the soft ferromagnetism of the materials, and saturates to a value , in the order of units. We defined experimentally as the temperature at which equals half the saturation value. Under the hypothesis of a spatial distribution of Curie temperatures, due to the unavoidable chemical disorder, and the approximation of a negligible contribution to from the spatial components whereby , such a definition corresponds to half the sample volume having undergone the magnetic transition. In the compounds subject to SR experiments, the rf and SR determinations of where found to coincide within the absolute accuracy of the thermometer calibrations, on the order of 1 K.
II.4 Zero field 55Mn NMR
The hyperfine field at the 55Mn nucleus, proportional to the thermal average of the Mn electronic moments, was measured vs. temperature by ZF 55Mn NMR. In the magnetically ordered phase, a spontaneous NMR signal is detected at a mean resonance frequency , where MHz/T is the 55Mn gyromagnetic ratio. The experiments were performed in zero field by means of a home-built phase-coherent spectrometer hyrespect and a helium-flow (in the 2-70 K range) or a nitrogen-flow cryostat (above 70 K). Specimens of typical mass 20 mg, finely ground in order to maximize the penetration of the rf field, were placed in an untuned probehead consisting of a small coil ( nH) terminated onto a 50 resistor. The reduced sensitivity and rf field provided by the resistive circuit were overcompensated by the large rf enhancement, of the order of thousands, characteristic of the NMR signals from domain walls in ferromagnets. riedi_eta ; turov The usage of a non-resonant circuit, on the other hand, allowed the automation of unattended frequency scans. A conventional tuned LC circuit was sometimes employed only very close to , in order to improve sensitivity and approach the transition as close as possible.
The inhomogeneously broadened spectra were recorded point by point by exciting spin echoes at discrete frequencies by means of a standard pulse sequence, with delays of 2.5-4 , and equal rf pulses of 0.3-1.4 with intensity optimized for maximum signal. The whole sequence was kept as short as possible compatibly with the dead time of apparatus, especially at high temperature, in view of the very short relaxation times, of the order of 1 close to . The digitized echo signals were analyzed by the fast Fourier transform (FFT), assigning the maximum magnitude of the transformed echo to the spectral amplitude at the working frequency. This criterion is preferred in practice over the textbook method of assigning the zero-shift FFT component, clark as it partly compensates for the possible spectral hole burning at the center of the irradiated band. Such an artifact, due to overdriven spin echoes, is often encountered in the NMR of ferromagnets, where it usually originates from the spatial and/or spectral inhomogeneity of the enhancement factor.
II.5 SR experiments
Zero-field SR experiments on the LCSMO series were performed at the Laboratory for Muon Spin Spectroscopy (LMU) at Paul Scherrer Institut (Villigen, CH) on the GPS spectrometer equipped with a closed cycle refrigerator (5-400 K) as a sample environment. ZF SR data from the underdoped LCMO samples were also recorded on the MUSR instrument at ISIS (Chilton, UK). The observed quantity in a ZF SR experiment is the time evolution of the asymmetry of the muon decay, , recorded in a pair of opposite positron detectors aligned parallel to the initial muon spin direction . Such a quantity is directly proportional to the projection of the muon spin polarization along , while the orthogonal projections vanish identically due to the axial symmetry of the setup. Schenck
In the paramagnetic (PM) phase, implanted muons experience no net magnetic field, and the asymmetry signal exhibits a pure longitudinal decay with a moderate decay rate , , where is the maximum asymmetry characteristic of the instrument setup. In the ordered phase of a magnetic material, on the other hand, a spontaneous field sets in at the muon site, originating from the dipolar and hyperfine coupling of with the electronic moments. The muon may stop in principle at several magnetically inequivalent sites, each of them experiencing distinct internal fields , hence giving rise to distinct muon spin precessions. For an arbitrary orientation of with respect to the initial spin direction , however, also a non-precessing component (referred to as longitudinal), proportional in amplitude to the projection of along , shows up in the asymmetry signal. The muon polarization in the ordered phase is therefore fitted as
| (2) |
where , are the amplitude and relaxation time of the longitudinal components, , , are the frequency, amplitude, and inhomogeneous Gaussian linewidth of the muon precession at the -th site, respectively, and = 135.54 MHz/T is the muon gyromagnetic ratio. Here we account for spatially inhomogeneous longitudinal relaxations by including distinct decay terms (not necessarily related to any of the sites in the magnetic structure).
In a polycrystalline sample, cumulative weights , are predicted from the angular average of the internal fields. The transverse signals, however, may be partly or totally lost in the case of very broad lines, hence experimentally . In particular, they are completely lost at ISIS, due to the small bandwidth of the MUSR spectrometer operating with a pulsed muon beam. Similarly, if a longitudinal component decays with an exceedingly large relaxation rate . The total longitudinal amplitude , on the other hand, may exceed in a phase-separated state with a magnetically ordered and a PM volume fractions, e.g. close to the transition in the presence of a distribution of .
III Experimental results
We report separately the results obtained in the various compounds by the microscopic probes of magnetism: SR, NMR, and the combination of the two techniques.
III.1 SR results
We describe in some detail the SR experiments carried out at LMU-PSI on optimally doped La5/8(CaySr1-y)3/8MnO3, accessing muon spin precessions. The SR spectra are qualitatively very similar in all the investigated samples (, 0.33, 0.44, 0.5, 0.56, 0.67, 1). Their common features are summarized as follows.
III.1.1 Muon spin precessions
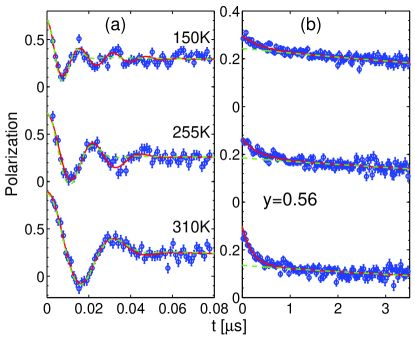
The time-differential muon polarization is plotted at early times in Fig. 3a for a representative sample () at selected temperatures.
The transverse signal in the FM phase is best fitted to a doublet of nearly degenerate precession components, with a frequency difference below the resolution limit (i.e. ). The improvement obtained with a two-component fit is however marginal in an interval of several tens kelvin just below , where a fit to a single damped precession is nearly as accurate. In the same temperature range, the transverse polarization, extrapolated to the initial time , equals within errors the theoretical 2/3 value expected for a polycrystalline sample, i.e. all muon sites and all the sample volume contribute to the transverse signal.
At lower temperatures, however, deviations from a single damped cosine function are appreciable. On further decreasing temperature, a reduction in the total transverse asymmetry is also observed. The missing fraction corresponds to an overdamped precession component, which is not detected due to a decay time shorter than the dead time of the GPS spectrometer (ns). Such a behavior, namely, the appearance of complex precession signals and a missing transverse fraction well below , is somewhat more marked on the low- side of the LCSMO series. In LSMO (), in particular, precession features are only visible above 300 K, while the signals observed at are pure longitudinal decays.
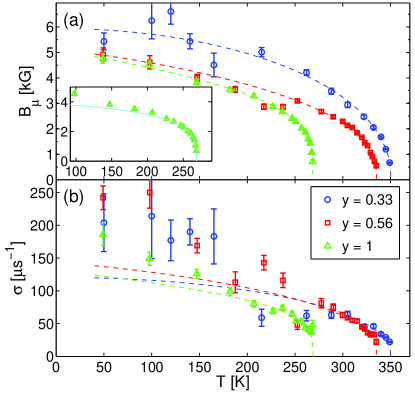
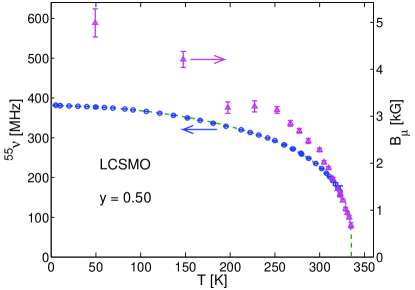
The main quantities extracted from the muon precession spectra, namely, the internal field and the Gaussian precession linewidth , are plotted vs. temperature in Fig. 4 for representative compounds. The data are obtained from a fit to a single transverse component as in Ref. heffner, on LCMO, in spite of its non-perfect accuracy, as it yields smoother temperature dependences. In a two-component fit, the fields at the two sites , are in fact highly correlated, and the resulting values are strongly scattered. Similarly, the precession linewidths and amplitudes are too highly correlated to be fitted independently in the present case of overdamped signals. We therefore fixed amplitudes and took the linewidth as a free-running parameter.
Low-temperature anomalies are observed in . A constrained fit to the empirical law
| (3) |
interpolating between a low-temperature behavior and the critical power-law dependence of the order parameter,blundell with the and exponents forced to take physically meaningful values (see Sec. III.2 and III.3), reveals in fact an upturn in at approximately (inset of Fig. 4a for ). Below the same temperatures, the departure of the precession patterns from a single damped cosine wave are more marked, and a two-component fit becomes significantly more accurate. Such a change in the precession waveforms is also signalled by a steep increase of the effective linewidths on cooling. The dashed lines overlaid to the data in the main panel of Fig. 4a are guides to the eye devoid of any physical significance, which are replicated, multiplied by constant factors, in Fig. 4b to facilitate the comparison of and . It is apparent that the two quantities do not scale with each other over the full temperature range. The relative linewidths tend in fact to asymptotic values of approximately 1/4 for and of 1/2 or higher for . Such an excess linewidth is indicative of extra static disorder at low temperatures.
III.1.2 Critical region
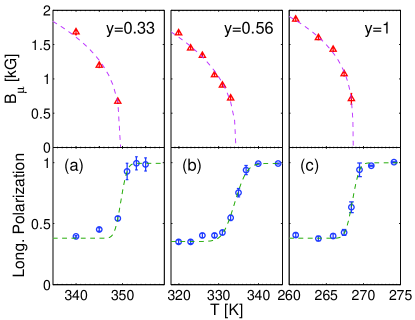
For clarity, we replot on an expanded temperature scale across the critical region in Fig. 5, overlaid to the total muon longitudinal amplitude (see Eq. 2). The transition from the FM phase to a fully PM state is marked by the recovery of the full longitudinal polarization. The rise of to unit takes place over finite temperature intervals, indicating spatially inhomogeneous Curie temperatures in the samples. Fits of to a Gaussian distribution of yield half-widths K in the end members LSMO and LCMO, up to K in La5/8(CaySr1-y)3/8MnO3 with . The larger in the Ca-Sr alloys agree with their expected larger chemical inhomogeneities, due to local deviations of both and the hole doping from the nominal mean values. Relative indeterminacies on this order of magnitude are however standard in non-stoichiometric magnetic oxides. For instance, even larger has been reported for state-of-the-art samples of other doped manganites. lpsmo2008 .
Well-defined precessions (i.e., ) are detected for all values up to temperatures corresponding to reduced frequencies . The precession frequencies extrapolate to zero at , a temperature reasonably well determined independent of the exact functional form of . It is apparent from the figure that lies in the middle of the rising edge of identifying the mean , according to the above discussion. We conclude therefore that all over the La5/8(CaySr1-y)3/8MnO3 series, including the LCMO end member, as in a regular second transition.
III.1.3 Longitudinal signals
We describe here the peculiar non-exponential longitudinal muon spin relaxations for sake of completeness, although of marginal interest to the main subject of this article. These results are discussed briefly at the end of the paper in the context of the muon coupling.
The longitudinal polarization of a representative sample () is plotted vs. time in Fig. 3b at a few temperatures below , with the precession components filtered out for clarity. The presence of two decay components at K, with decay constants of the order of tens and tenths of reciprocal microseconds, respectively, is apparent in the figure. The same two-component behavior was reported in slightly underdoped LCMO by Heffner et al.. heffner2000 Relaxations at K, on the contrary, are single exponential with a very small rate.
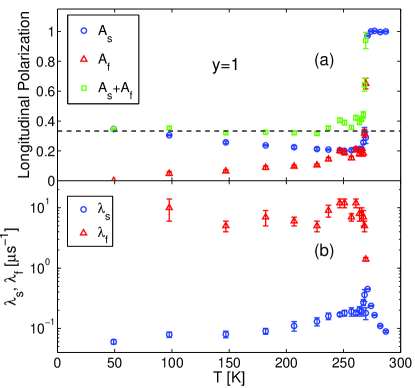
The decay rates and relative weights of the two decay components of another sample () are plotted vs. temperature in Fig. 6. Their temperature dependence is qualitatively identical across the LCSMO series and in underdoped La1-xCaxMnO3 ( = 0.25, 0.3). The amplitude of the fast-relaxing component progressively grows on warming above 100 K, up to a limit value of approximately 1/6 (i.e. half the magnitude of the longitudinal polarization in the ordered phase) for , while the amplitude of the slow-relaxing component follows a complementary behavior . The corresponding relaxation rates , , on the other hand, are nearly independent of over the same temperature interval, if we except for a shallow peak in and a slight decrease, instead of a critical divergence, in for .
III.2 Zero-field 55Mn NMR
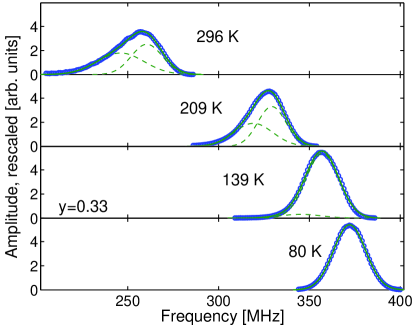
All the compounds, the optimally doped Ca-Sr alloys as well as well as the LSMO and LCMO series, were subject to our 55Mn NMR study. Very intense 55Mn spin echoes were excited in zero external field by applying very low rf power thanks to a sizable enhancement , riedi_eta a value assigning the signals to nuclei in domain walls. 55Mn spectra at several temperatures are plotted in Fig. 7 for a representative sample. They are qualitatively very similar in all compounds.
Well below , the 55Mn spectra are motionally narrowed nearly-Gaussian single peaks characteristic of a DE state of the Mn ion, matsumoto ; savosta1998 ; our_films with low-temperature mean resonance frequencies -390 MHz and half widths -9 MHz. At K, however, the spectra depart from the Gaussian shape, and at higher temperature, they clearly develop a low-frequency shoulder. Perfectly identical features were reported in metallic LCMO and LSMO by Savosta et al.,savosta who interpreted this behavior in terms of a subtle phase segregation on a nanoscopic scale, with slightly different electronic properties in the volume fraction probed by the spectral shoulder. Here, we are not going to rely on such a phase separation model, which is outside the scope of this paper. A reliable spectral decomposition into two or more unresolved peaks, on the other hand, depends critically on on the flatness in the frequency response of the receiver, as well as on an accurate calibration of the optimum excitation power vs. frequency, which are both difficult to attain over very broad spectra. Therefore, we simply calculated a mean resonance frequency as the weighted average of the peak centers in a two-component fit. The so-determined follow smoother temperature dependences than the frequencies of the individual peaks. The indetermination of the order parameter estimate, related to the definition of a mean effective NMR frequency, is anyway unimportant and it does not affect significantly the following analysis. For instance, differs from the the position of the sharper peak (which could be taken as an alternative definition of a mean resonance frequency) by no more the 4% in relative terms, i.e. less than , except very close to . Over the critical temperature interval, on the other hand, our study of the order parameter in LCSMO mostly relies on the SR frequency .
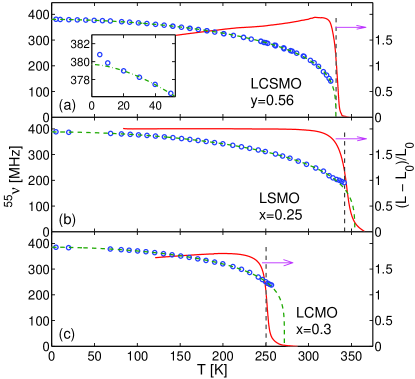
Typical curves (henceforth we drop the bar over ) are plotted in Fig. 8 for a representative optimally doped La5/8(CaySr1-y)3/8MnO3 compound, and in Fig. 8b,c for two underdoped La1-xCaxMnO3 and La1-xSrxMnO3 samples, respectively. In the figures, solid lines are fits to the phenomenological function of Eq. 3. Unlike the SR data, the experimental points follow regular curves without any anomalies at intermediate temperatures, as it is witnessed by the good accuracy of the fits to Eq. 3. The best fit parameters are tabulated in Tab. 1 for the different compounds. Overlaid to , the figure plots for comparison also the rf magnetic response (see Sec. II.3), whose rising edge marks .
The truncated character of the FM transition is apparent in underdoped La1-xSrxMnO3 () and La1-xCaxMnO3 (), which show finite resonance frequencies at and curves extrapolating to zero at temperatures larger than by 11 K (LSMO) or more. These samples also exhibit 55Mn signals up to several kelvin above the nominal , with corresponding mean frequencies clearly exceeding the values extrapolated from Eq. 3. Such a behavior indicates a phase separated state over a wide temperature interval across the transition, the wider the farther from optimal doping, hence governed by chemical inhomogeneities.
In the optimally doped LCSMO sample series, on the other hand, spectra can be recorded up to approximately K, corresponding to reduced temperatures and reduced order parameters . Above such limiting temperatures, the spin-spin relaxation time falls below 1 s, much shorter than the dead time of the NMR apparatus (2.5 s), making spin echoes no longer detectable. The extrapolated curve vanish at temperatures compatible with , in agreement with the behavior of . We defer the analysis of the critical behavior to the next session, combining SR and NMR data.
The inset of Fig. 8a shows a blow-up of the plot at low temperature. The points at K exhibit a clear upturn relative to the best fits to Eq. 3 by approximately 0.5-1 MHz. Similar low-temperature anomalies are systematically observed in the spectra of all our bulk materials, irrespective of the dopant species and doping concentration. They are absent, in contrast, in thin films of CMR manganites. unpublished We have no clear explanation for this behavior, seemingly related to a subtle freezing phenomenon. note_frequencypulling
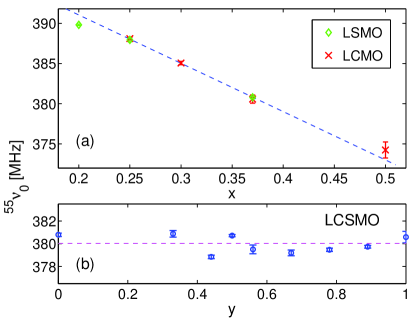
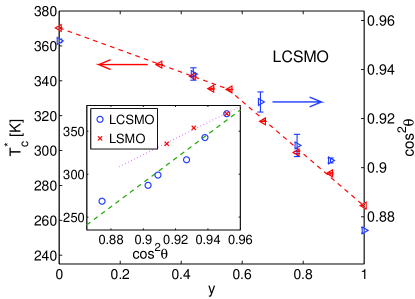
The mean resonance frequencies at , extrapolated from the fits to Eq. 3, are plotted vs. in Fig. 9a for the La1-xCaxMnO3, La1-xSrxMnO3 families, and vs. for the La5/8(CaySr1-y)3/8MnO3 series in Fig. 9b. The datum of the overdoped LCMO sample () is taken from Ref. allodi_ca50, . follows a straight line dependence
| (4) |
with reasonable accuracy (Fig. 9a), with the same best-fit coefficients MHz, MHz for the two dopant ions. The independence of on the doping mechanism is consistent with Fig. 9b, showing MHz approximately constant over the optimally doped Ca-Sr series. Assuming the independence on as exact, the deviation then provides an estimate for the deviation of from its nominal value. Based on the empirical calibration given by the coefficient, we get , in agreement with the known accuracy of the preparation process.
III.3 Order parameter
We combine here the SR and NMR techniques in an analysis of the temperature dependence of the order parameter in the optimally doped La5/8(CaySr1-y)3/8MnO3 series, with the muon and 55Mn precession frequencies constrained to the same temperature dependence. The SR data are restricted to temperatures down to a few tens kelvin below , a range overlapping the one accessed by NMR over an interval of 20-30 K, where the two quantities are in an approximately constant ratio. At lower temperature, the normalized departs from , as pointed out above. In this case, however, 55Mn nuclei probe the local electronic moment more reliably, due to the essentially isotropic and on-site nature of their hyperfine coupling (see Appendix A). Therefore, the SR points at lower temperature are rejected from the fit. The reason for the discrepancy between the two probes is discussed in Appendix B. The merger of with the curve, scaled in frequency by an empirical factor and limited to high temperatures as specified above, represents our best determination of the order parameter by local probes of magnetism.
| Sample | (MHz) | (kG)111Defined as , where is the empirical scaling constant between and in the combined fit to Eq. 3. | (K)222From combined SR-NMR data. | (K)333From NMR data only. | 222From combined SR-NMR data. | 333From NMR data only. | (K)444Mean value, from recovery of the longitudinal muon polarization. | (K)555Mean value, from the rf response . | |
|---|---|---|---|---|---|---|---|---|---|
| La5/8Sr3/8MnO3 | 380.8(2) | 3.5(2) | 370.3(3) | 370(1) | 1.75(2) | 0.309(2) | 0.310(6) | 371(2) | |
| La5/8(Ca0.33Sr0.67)3/8MnO3 | 380.9(3) | 4.3(1) | 349.3(1) | 348.8(4) | 1.73(2) | 0.299(2) | 0.294(3) | 349.7(4) | 350(1) |
| La5/8(Ca0.44Sr0.56)3/8MnO3 | 378.9(2) | 3.8(1) | 342.6(1) | 340.0(4) | 1.80(1) | 0.311(5) | 0.288(3) | 342.1(7) | 342.4(5) |
| La5/8(Ca0.5Sr0.5)3/8MnO3 | 380.7(1) | 3.3(1) | 335.5(3) | 335(1) | 1.85(2) | 0.309(3) | 0.305(6) | 333.4(7) | 333(2) |
| La5/8(Ca0.56Sr0.44)3/8MnO3 | 380.3(2) | 3.6(1) | 335.0(3) | 331.9(4) | 1.79(2) | 0.328(3) | 0.295(4) | 334.1(4) | 332.2(8) |
| La5/8(Ca0.67Sr0.33)3/8MnO3 | 379.6(2) | 3.3(1) | 316.8(2) | 313.6(4) | 1.84(2) | 0.305(4) | 0.278(3) | 317.2(8) | 316.8(8) |
| La5/8(Ca0.78Sr0.22)3/8MnO3 | 379.5(2) | 298.9(2) | 1.79(3) | 0.256(5) | 300.6(4) | ||||
| La5/8(Ca0.89Sr0.11)3/8MnO3 | 379.7(2) | 286.9(2) | 1.85(2) | 0.254(4) | 286.3(5) | ||||
| La5/8Ca3/8MnO3 | 380.1(4) | 3.5(1) | 268.5(1) | 272(2) | 1.84(5) | 0.211(4) | 0.231(8) | 268.5(2) | 270.7(5) |
| La0.75Sr0.25MnO3 | 387.9(3) | 354(1) | 1.90(3) | 0.306(7) | 343(2) | ||||
| La0.8Sr0.2MnO3 | 389.8(1) | 335(2) | 2.00(2) | 0.315(7) | 310(3) | ||||
| La0.7Ca0.3MnO3 | 385.1(3) | 272(1) | 1.82(3) | 0.218(6) | 248(1) | 251(1) | |||
| La0.75Ca0.25MnO3 | 388.1(2) | 252(3) | 2.00(3) | 0.23(1) | 194.3(3) | 198(3) |
A typical fit of and vs. to the phenomenological function of Eq. 3, with a scaling constant as an additional free parameter, is illustrated in Fig. 10 for a representative compound (). Here, the parameters and are essentially determined by the 55Mn frequencies, while the values of and the critical exponent mostly depend on the SR data. The best fit parameters of all the samples are summarized in Tab. 1. For comparison, the table also reports and determined solely by the NMR data. Despite the severe extrapolation of for , the NMR estimate of the critical parameters reasonably agrees with the more precise SR determination. This makes us confident about using the extrapolation of the NMR frequency in the materials where muon precession data are not available (i.e. , 0.89).
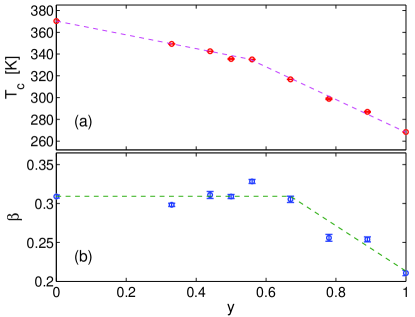
The best fit values of and across the LCSMO series are plotted vs. in Fig. 11. The Curie temperature shows a smooth dependence on , slightly steeper for , but with no singularity at -0.6, where X ray diffraction detects a transition from the () to the space group. The exponent exhibits an approximately constant value with increasing up to , above which it decreases gradually, down to in the compound. The latter is in good agreement with the value reported in the literature for nearly optimally doped LCMO, determined by SR. heffner_prb2001 For reference, the critical exponent in LSMO was determined as by magnetometry. lsmo_MvsT Our smaller absolute value at low is probably due to employing a fit to the empirical law of Eq. 3 over the whole temperature range, instead of a proper analysis of the critical point. However, the relative dependence appears to be significant, also in view of best-fit exponents nearly constant over the LCSMO series (Tab. 1). The reduced value of found in LCMO reflects therefore a steeper temperature dependence of the order parameter close to the magnetic transition, which however retains its continuous character. The relevance of for the nature of the magnetic transition is discussed in some detail in the next section.
IV Discussion and conclusions
In the isoelectronic La5/8(CaySr1-y)3/8MnO3 series at optimum hole doping, the magnetic transitions are second order at all compositions, as it is apparent from the vanishing muon precession frequencies at . In the case of the end member La5/8Ca3/8MnO3, this agrees with a previous finding by SR, heffner2003 but contrasts with Adams et al.,lynn reporting a finite limit value of the spin wave stiffness at as in a first order transition. In Ref. lynn, , however, the truncation effect is small, and the discrepancy in the transition order might be accounted for by a slight underdoping (see below), as indicated by a slightly lower in that sample. The Curie point decreases smoothly from 370 K () down to 268 K (), with a more marked dependence in the orthorhombic phases on the LCMO side, but without any apparent singularity in either or the critical exponent at the - space group transition (Fig. 11). The change in crystal symmetry, nominally occurring at , is accompanied by a interval where the two phases coexist microscopically, and no crystal structure can be refined globally (Fig. 1). The magnetic transition, however, is apparently insensitive to such structural inhomogeneities. This indicates that their spatial scale is much shorter than the coherence length of the conduction holes, so that the electronic motion averages the exchange coupling, which is controlled by the local lattice distortions, into a single effective interaction.
In contrast, the transitions are truncated in all our underdoped samples, including LSMO. Notably, the first order transition of La0.75Sr0.25MnO3 ( K) takes place at a much higher temperature than the continuous transition in optimally doped LCMO (Fig. 8). Our observation of a first order transition in high-Tc LSMO, well beyond the insulator-metal phase boundary ,tokura_lsmo challenges the currently accepted belief that the transition order is essentially controlled by the size mismatch of the dopant cation. lynn ; mossbauer ; tricriticalLCSMO30 Here, we provide evidence that the truncation phenomenon is primarily an effect of underdoping and, possibly, also of overdoping.
Hole doping, on the other hand, seems to play a minor role in the temperature dependence of the order parameter, and hence in the effective exchange coupling. The order parameter curves of LaCaySr1-y)xMnO3 exhibit in fact remarkable scaling properties vs. , exemplified in Fig. 12. The normalized 55Mn spontaneous frequencies of optimally doped and underdoped () LCMO are compared in Fig. 12a. The overlap of the two curves is nearly perfect, if we except the truncation of at K in the underdoped compound. The insensitivity of the order parameter curve and on hole doping in LCMO, in contrast to their strong dependence on the cation substitution in the optimally doped series (Fig. 11), suggests that the strength of the exchange interaction is primarily governed by distortions. Actually, the structural parameters in the sample (not shown) were found coincident within errors with those of LCMO (Fig. 2), in accordance with their common behavior in . The scenario emerging from the and dependence of the order parameter, respectively, in La1-xCaxMnO3 and La5/8(CaySr1-y)3/8MnO3, therefore fits qualitatively into the original DE model, zener ; anderson_hasegawa whereby the exchange coupling constant is determined by the overlap of the Mn with the ligand wave functions via the Mn-O-Mn bond angle.
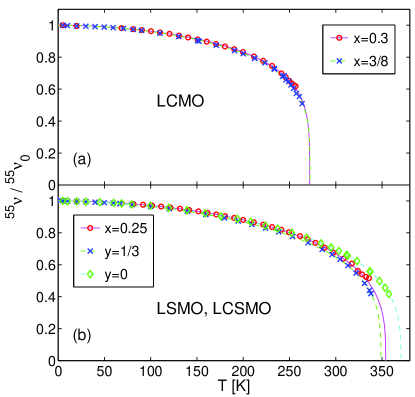
The case of LSMO is slightly more complex. The normalized 55Mn frequencies of the sample (Fig. 12b) significantly deviate from those of the optimally doped LSMO compound, and interpolate between the latter and the one of LCSMO (), as also indicated by the extrapolated Curie temperatures (Tab. 1) of these three materials. The Mn-O-Mn bond in the strongly underdoped La0.75Sr0.25MnO3, however, exhibits a significantly larger distortion than in optimally doped LSMO (Fig. 2). This suggests that the moderate variation of the order parameter curves in these two samples is an indirect effect of doping, and is mostly due to the dependence of lattice distortions on the Sr concentration.
The existing correlation between (hence, ) and the mean Mn-O-Mn bond angle is illustrated in Fig. 13, plotting together, with a linear scale transformation, and data vs. in the La5/8(CaySr1-y)3/8MnO3 series. The latter represents, to leading order, the bond angle dependence of double exchange predicted by theoretical calculations,DE_MnOMn_theory and therefore it should be regarded as proportional to . Seemingly, the two quantities scale reasonably well with each other. Their linear correlation in LCSMO is also apparent in the figure inset, showing as a function of . For reference, the inset also plots data points from the underdoped LSMO samples, showing a qualitatively similar monotonic decrease of with decreasing . However, the latter deviate significantly from the LCSMO points with . The lack of a universal scaling law valid for all compositions possibly indicates that other structural parameters are also at play in determining . For instance, the extra -site cation disorder present in the LCSMO compounds might play a role in lowering their as compared to LSMO, as already proposed by Rodriguez-Martinez et al. for other CMR manganites.attfield ; attfield_98 Nevertheless, we believe that the view of an exchange coupling governed by distortions is substantially correct, although we have not succeeded to single out an effective distortion parameter determining univocally.
The picture sketched above whereby the order of the magnetic transition is determined by charge doping, however, is clearly oversimplified. A truncated curve indicates in fact the disruption of the DE metallic state due to the formation of a polaron phase. lynn More realistically, the relative stability of the two phases must also depend on the single-electron metallic bandwidth. The latter is closely related to the strength of the DE interaction, anderson_hasegawa which in turn is controlled by lattice distortions, according to the above arguments. A tentative boundary in the charge-distortion space, separating first- from second-order Curie transitions, is plotted for the LaCaySr1-y)xMnO3 system in Fig. 14a, with as the implicit distortion parameter. In the figure we also include determinations of the order of the transition by other authors, obtained by SR, heffner ; heffner_prb2001 139La NMR, allodi_ca50 magnetometry, tricriticalLCSMO30 ; tricritical specific heat and thermal expansion measurements. tricritical ; mira The existence of a phase boundary across the whole range in the overdoping regime, where data at are missing (dashed line), is just argued on the basis of the strongly truncated transition observed in La1/2Ca1/2MnO3. allodi_ca50 From the reported continuous transition in slightly overdoped LCMO (), tricritical we also guess a certain asymmetry of the high- and low-doping (solid line) boundaries with respect to optimal doping .
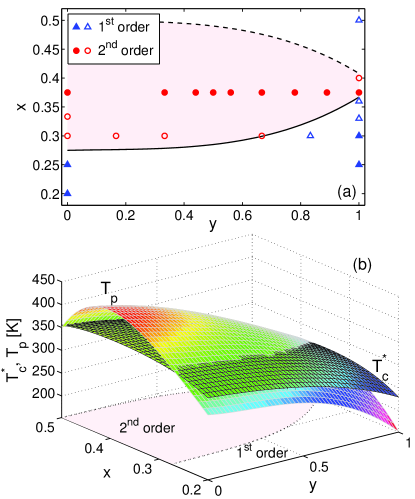
The prominent role of polarons in the truncated transitions of LaCaySr1-y)xMnO3 is indicated, among other evidence, by transport measurements, showing a semiconductive behavior of the electrical resistivity above e.g. in underdoped LCMO, accompanied by a huge magnetoresistance effect in the vicinity of the transition. phadia_lcmo ; rho_LCMO This contrasts with the transport properties of the LSMO compounds showing second order magnetic transitions, which exhibit shallower magnetoresistance peaks at and resistivity maxima well above the Curie point. tomioka The metallic-like conductivity at the magnetic transition in nearly optimally doped LSMO indicates the absence of a polaron phase just above . Indeed, the localization of polarons in La1-xSrxMnO3 (, ) has been detected by soft X ray photoemission spectroscopy at temperatures K, i.e. well above . mannella Combining these findings with data of ours and from the authors cited above, we are led to postulate the existence of a polaron localization temperature at all metallic compositions in LaCaySr1-y)xMnO3, with a dependence similar to the one sketched in Fig. 14b. The magnetic transition is then governed by critical spin fluctuations, as in La5/8Sr3/8MnO3, or driven by polarons, as in La0.7Ca0.3MnO3, depending on whether the condition or is met, respectively. The phase boundary between first and second order transitions (Fig. 14a) corresponds therefore to the intersection of the and surfaces.
Second order transitions occur over hole-doping intervals that apparently narrow at increasing substitution of Sr with Ca. The end member La5/8Ca3/8MnO3, which is very close to the border with truncated transitions, is therefore virtually a singular point in the isoelectronic La5/8(CaySr1-y)3/8MnO3 series. The near-singularity of optimally doped LCMO is also signalled by a critical exponent , from a fit to Eq. 3, in contrast to in LSMO, indicating a steeper drop of the order parameter at in the former (Fig. 11b). Reduced , numerically coincident with the exponent of a second order transition at a tricritical point, huang_book were similarly determined from magnetization measurements note_on_beta in La0.6Ca0.4MnO3 by Kim et al. tricritical and in underdoped La0.7(Ca2/3Sr1/3)0.3MnO3 by Phan et al.tricriticalLCSMO30 Those authors relate the tricritical point value to the crossing of the boundary between continuous and second order transitions in the - phase diagram, and thus they implicitly identify the third phase at close equilibrium with the polaron phase responsible for the truncated transitions. We note however that does not exhibit any reduction in our underdoped LSMO samples showing a first order transition. In the latter, is intended as the fitting parameter to the phenomenological law of Eq. 3, denoting the critical exponent of the virtual FM transition which would take place at , if the transition were not truncated. Although such a determination relies on an extrapolation, the fitted values seem reliable, especially in La0.75Sr0.25MnO3 where the truncation effect is moderate ( K). For reference, the fits to Eq. 3 of sole 55Mn NMR data from optimally doped LCSMO, based on similar extrapolations, yield fitting parameters in good agreement with those determined by combined NMR and SR data, covering temperatures up to (Tab. 1). Conversely, the fits of the truncated curves in underdoped LCMO yield the same reduced as in La5/8Ca3/8MnO3. In summary, we can confidently state that small , close to the appropriate value for a tricritical point, are typical of the most distorted manganites like LCMO, and have no apparent direct relation with the vicinity to a first order transition. The nature of the tricritical transition point remains therefore unclear.
In conclusion, we have shown that the exchange coupling in metallic DE manganites, hence the one electron bandwidth, is primarily controlled by distortions and is nearly insensitive to hole doping. In contrast, the second vs. first order of the Curie transition is determined by the interplay between bandwidth and band filling, where the latter apparently plays a dominant role.
ACKNOWLEDGEMENT
The authors thank A. Amato (PSI) for assistance and helpful discussion, and F. Licci and T. Besagni (IMEM-CNR, Parma) for help and precious suggestions in the sample synthesis. The technical support of the Laboratory for Muon Spectroscopy and of the accelerator staff of the Paul Scherrer Institute are gratefully acknowledged.
Appendix A The hyperfine coupling of 55Mn
We comment here on the dependence of the 55Mn hyperfine field on composition, and its relevance for the electronic state of the Mn ion in CMR manganites.
The hyperfine coupling of the 55Mn nuclei to the Mn electronic moments , of the form (here is the mean hyperfine coupling constant), is known to be negative and isotropic in metallic pseudocubic manganites. allodi_ca50 ; allodi_jmmm The isotropic character of is a manifestation of the so-called orbital liquid state of these systems, orbital_liquid which effectively leads to averaging out all the anisotropic (i.e. pseudodipolar) hyperfine terms typical of non closed-shell ions as Mn3+, due to the fast motion of the delocalized holes. As a result of motional averaging, comparatively sharp single peaks are detected in metallic manganites, in place of the complex and very broad 55Mn spectra typical of underdoped insulating compositions. kapusta The negative sign and the magnitude of demonstrate the dominant origin of the hyperfine coupling of 55Mn from the Fermi contact interaction with the core wave functions, which are spin-polarized by the outer shell. This core polarization mechanism contributes an isotropic and essentially single-ion hyperfine coupling term, yielding a spontaneous field proportional to the on-site total spin. Its coupling coefficient approximately equals a value of -10 T/ in iron-group transition metals, roughly independent of the ionic species within ten percent accuracy. RadoSuhl .
The zero-temperature spontaneous resonance frequency is found to depend only on the hole concentration according to Eq. 4, irrespective of the dopant species. This finding qualitatively agrees with an essentially on-site hyperfine coupling of 55Mn, whereby is proportional to the local spin-only Mn electronic moment , which is controlled in turn by the hole concentration, . Such a dependence is well established experimentally e.g. by neutron diffraction. xiong Nevertheless, the proportionality of to would imply slope and intercept (Eq. 4) in a ratio , which is not verified experimentally. The MHz parameter would correspond to a hyperfine coupling constant in the hypothetical compound, in loose agreement with the known core polarization value. The MHz parameter, though of the correct negative sign, is however smaller than by nearly a factor of two. The reduced magnitude of therefore indicates the presence of extra -dependent isotropic and positive contributions to the 55Mn hyperfine field, which partly cancel the on-site core polarization term.
A well-known positive term, present in both insulating and metallic magnetic oxides, is given by the super-transferred hyperfine coupling via oxygen. owen_taylor_1973 Its leading contribution consists in the polarization of the local core wave functions by a orbital of a neighboring Mn ion, mediated by the ligand wave functions. owen_taylor_PR Oxygen-assisted charge transfer into outer 4 Mn wave functions also contributes with the same sign. orbach In either case, the orbitals participating in the hyperfine field transfer are the singly occupied wave functions overlapping to the ligand orbitals. owen_taylor_PR ; orbach
We can estimate the super-transferred hyperfine coupling in CMR manganites from its experimental determination in the isostructural La(Ni1-xMgx)0.5Mn0.5O3 perovskite. There, each ion ( configuration) contributes 0.63 T to the hyperfine field at the nucleus of a neighboring Mn4+ ion, yielding an overall transferred field of 3.8 T at 55Mn in LaNi0.5Mn0.5O3. sonobe_asai From calculations, similar values were estimated for the transferred hyperfine interaction from Mn2+ () to Mn2+, for instance in MnO. owen_taylor_PR For the supertransferred hyperfine field at 55Mn in CMR manganites, we assume the same value as in LaNi0.5Mn0.5O3, scaled by the populations of the orbitals in the two classes of compounds. In mixed valence LCMO and LSMO, the orbital liquid state implies an occupation probability of for the two Mn wave functions. We predict therefore in the present compounds a transferred hyperfine field , with T . Its actual value might be smaller owing to the non-collinearity of the Mn-O-Mn bond, reducing the overlap between the Mn and the ligand wave functions, in contrast to the La(Ni1-xMgx)0.5Mn0.5O3 case.
Such an estimate for is to be compared with the observed dependence. Following the above arguments, the total hyperfine field at 55Mn is written as
| (5) |
where the second term on the right hand side has the form of a transferred hyperfine field. From Eq. 4 and 5, with , we obtain T/ and T. The latter is larger than the estimated by approximately a factor of 3.
The discrepancy between and may be reconciled by assuming a further positive -dependent hyperfine contribution. To our knowledge, the only isotropic and positive hyperfine term possible in a metal, in addition to supertransfer, is the direct contact interaction with conduction electrons in outer shells, like e.g. in metallic copper. In CMR manganites, a -wave component with metallic character can only arise from a slight hybridization of the valence : wave functions. A similar - wave admixture was actually proposed in superconducting cuprates by Mila and Rice, milarice in order to explain the anomalous Knight shifts and spin-lattice relaxation rates of Cu nuclei. Like the former contribution, this - mixing term must be proportional to the : electronic population, and therefore it must be written as , formally identical to . Eq. 5 is then reformulated into
| (6) |
where the - term is estimated on the order of 4 T.
Appendix B The muon coupling
We comment here on the anomalous coupling of muons to the local Mn moments in metallic manganites, as it appears from the temperature dependence of the spontaneous frequencies and and from the longitudinal relaxations of the two probes of magnetism. The precession frequency and longitudinal relaxation rates of a local probe of magnetism are simply proportional to the thermodynamic expectation value of the electronic spins and to the generalized spin susceptibility at the Larmor frequency , respectively, under the implicit hypothesis of temperature independent hyperfine and dipolar couplings. In most cases, however, such a temperature independence is just postulated. The deviation of from (Fig. 10) actually demonstrates that in metallic manganites the coupling of either probe varies with temperature.
The coupling of 55Mn is given to leading order by the Fermi contact interaction with the inner shells via the core polarization mechanism, RadoSuhl which is both isotropic and virtually independent on the ion surroundings. Transferred contributions from the neighboring spins are isotropic as well and smaller by an order of magnitude (see Appendix A). Although in principle transferred hyperfine terms may be sensitive to the local structure, their residual variance is expected to be a small fraction, at most in the order of 1% of the total hyperfine field . Experimentally, is found to be independent of the dopant ion, in spite of the different degree of distortion in the LSMO, LSCO, and LCSMO families (Fig. 9). Muons, on the other hand, are coupled to the electronic moments by the dipolar interaction plus, possibly, a usually smaller hyperfine contact term. The former is anisotropic and strongly dependent on the muon stopping site, which is determined in turn by the electrostatic potential minima within the crystal cell. Thus, the local field at the muon is sensitive to both spin reorientations and structural changes.
The above arguments demonstrate that coupling variations in the order of several tens percent, as those observed experimentally, may be ascribed solely to SR. Since a spin reorientation below has been ruled out by neutron diffractions data, lynn the anomaly of must then be related to the multiplicity and relative stability of the muon sites. The muon precession patterns well below actually indicate the presence of two stopping sites nearly degenerate in the internal field, plus extra sites whose overdamped precessions are not detected and give rise to missing transverse fractions. The recovery of simple damped cosine waveforms at higher temperature, with the full transverse amplitude and relatively reduced inhomogeneous linewidths, then points to the onset of a thermally activated hopping of the muon across its sites. If hopping takes place at a much faster rate than the precession frequencies, it effectively averages the various precessions into a single motionally narrowed line. In the presence of missing transverse fractions at low temperature and, possibly, temperature dependent branching ratios among the different sites, the transition from a hindered to a free motion of the muon may as well produce the step in its average dipolar coupling witnessed by the anomaly in (inset of Fig. 4).
The mobility of the implanted muon makes questionable its effectiveness as a probe of the dynamics of the electronic spins. In a magnetically ordered phase, muon hopping drives in fact a random time-dependent modulation of the large static dipolar field exerted by the electronic moments at the muon. The spectral component at of such a field modulation contributes to the longitudinal muon spin relaxation. The relative importance of such a mechanism vs. the relaxation channel due to proper spin fluctuations is clarified by the comparison with 55Mn spin lattice relaxations.
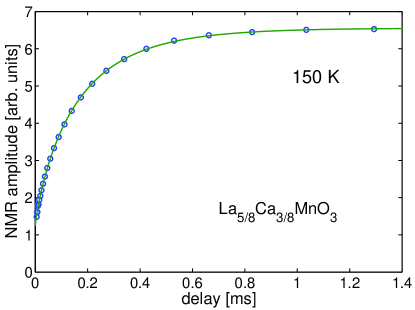
The recovery from saturation of the 55Mn nuclear magnetization is plotted vs. time in Fig. 15 for a typical compound (La5/8Ca3/8MnO3) at an intermediate temperature (150 K, approximately 0.6 ). The recovery curve is fitted to a stretched exponential, , with stretching exponent and mean relaxation rate s-1 (here is a residual unsaturated signal component). In the present case of NMR signal from domain walls, however, the dominant relaxation channel is due to an extrinsic mechanism, namely the mesoscopic fluctuations of the domain walls themselves. weger Their coupling to the nuclei is proportional to the domain wall enhancement , which is strongly inhomogeneous across a wall, whence the non-exponential form of the recovery curves. These magnetic fluctuations are suppressed by an applied field saturating the magnetization, which typically decreases by orders of magnitude. T1inLSMO Therefore, the above experimental value of is a large overestimate of its intrinsic value, arising from the spin excitations in the bulk of the domains. Anyway, we scale the measured relaxation rates of the two probes for their couplings to the electronic spins, in a ratio . From the experimental spin lattice relaxation of 55Mn, we predict an unmeasurably small muon relaxation rate s-1. note_raman_process Such a value is to be compared to the smaller muon rate in this compound, equal to 6 s-1 at this temperature (Fig. 6b). We conclude therefore that the muon relaxation rates and (a fortiori) are both determined by the fluctuations of the local field at the muon induced by its own motion, rather than the fluctuations of the electronic spins.
The dominance of an extrinsic relaxation mechanism for the muon spin perfectly explains the lack of a critical relaxation peak at (Fig. 6b), if one excepts the broad bump in . The comparison between NMR and SR also proves that several conclusions drawn in the literature on SR in CMR manganites should be reconsidered. For instance, the bimodal decay of the longitudinal muon polarization was regarded by Heffner et al. as evidence for two time scales in the spin dynamics of LCMO.heffner2000 Nevertheless, it is now clear that the spatial inhomogeneity revealed by the longitudinal muon relaxation is rather related to a corresponding inhomogeneity in the motion dynamics of the muon. A thermally activated muon hopping in the presence of a broad distribution of potential barriers may be the clue to both the non-exponential decays and their temperature evolution. The outline of such a dynamical model, however, is outside the scope of this article.
References
- (1) S. Jin, T. H. Tiefel, M. Mc Cormack, R. A. Fastnacht, R. Ramesh, and L. H. Chen, Science 264, 413 (1994).
- (2) C. Zener, Phys. Rev. 82, 403 (1951).
- (3) A. Urushibara, Y. Moritomo, T. Arima, A. Asamitsu, G. Kido, and Y. Tokura, Phys. Rev. B 51, 14103 (1995).
- (4) Y. Tomioka, A. Asamitsu, H. Kuwahara, Y. Moritomo, and Y. Tokura, Phys. Rev. B 53, 1689 (1996).
- (5) A. J. Millis, B. I. Shraiman, and R. Mueller, Phys. Rev. Lett. 77, 175 (1996).
- (6) S.-W. Cheong, and H. Y. Hwang, H.Y., in Colossal Magnetoresistance Oxides, Ed. Y. Tokura, Gordon and Breach, New York, (1999).
- (7) E. Dagotto, T. Hotta, and A. Moreo, Phys. Rep. 344, 1 (2001).
- (8) P. Schiffer, A. P. Ramirez, W. Bao, and S-W. Cheong, Phys. Rev. Lett. 75, 3336 (1995).
- (9) Lide M. Rodriguez-Martinez and J. Paul Attfield, Phys. Rev. B 54, R15622 (1996).
- (10) C. P. Adams, J. W. Lynn, V. N. Smolyaninova, A. Biswas, R. L. Greene, W. Ratcliff, S-W. Cheong, Y. M. Mukovskii, and D. A. Shulyatev, Phys. Rev. B 70 134414 (2004).
- (11) E. Assaridis, I. Panagiotopoulos, A. Moukarika, and T. Bakas, Phys. Rev. B 75, 224412 (2007).
- (12) M. K. Gubkin, A. V. Zalesskii, V. G. Krivenko, T. M. Perekalina, K. A. Khimich, and V. A. Chubarenko, JETP Lett. 60, 56 (1994).
- (13) G. Zhao, K. Konder, H. Keller, and K. Mueller, Nature (London) 381, 676 (1996).
- (14) A. C. Larson and R. B. Von Dreele, ”General Structure Analysis System (GSAS)”, Los Alamos National Laboratory Report LAUR 86-748 (1994); B. H. Toby, J. Appl. Cryst. 34, 210 (2001).
- (15) Y. P. Lee, S. Y. Park, J. S. Park, V. G. Prokhorov, V. A. Komashko, V. L. Svetchnikov, and J.-H. Kang, J. Appl. Phys. 101, 053708 (2007).
- (16) P. G. Radaelli, M. Marezio, H. Y. Hwang, S-W. Cheong, and B. Batlogg, Phys. Rev. B 54, 8992 (1996).
- (17) J. L. García-Muñoz, J. Fontcuberta, B. Martínez, A. Seffar, S. Piñol, and X. Obradors, Phys. Rev. B 55, R668 (1997).
- (18) G. Allodi, M. Bimbi, R. De Renzi, C. Baumann, M. Apostu, R. Suryanarayanan, and A. Revcolevschi, Phys. Rev. B 78, 064420 (2008).
- (19) G. Allodi, A. Banderini, R. De Renzi, and C. Vignali, Rev. Sci. Instrum. 76, 083911 (2005).
- (20) P. C. Riedi, Hyperfine Interact. 49, 335 (1989).
- (21) M. A. Turov and M. P. Petrov, Nuclear Magnetic Resonance in Ferro- and Antiferromagnets, Halsted, New York (1972).
- (22) W. G. Clark, M. E. Hanson, F. Lefloch, and P. Ségransan, Rev. Sci. Instrum. 66, 2453 (1995).
- (23) A. Schenck, Muon Spin Rotation: Principles and Applications in Solid State Physics, Adam Hilger, Bristol, 1985.
- (24) R. H. Heffner, L. P. Le, M. F. Hundley, J. J. Neumeier, G. M. Luke, K. Kojima, B. Nachumi, Y. J. Uemura, D. E. MacLaughlin, and S -W. Cheong, Phys. Rev. Lett. 77, 1869 (1996).
- (25) S. J. Blundell, T. Lancaster, F. L. Pratt, P. J. Baker, W. Hayes, J.-P. Ansermet, and A. Comment, Phys. Rev. B 81, 092407 (2010).
- (26) R. H. Heffner, J. E. Sonier, D. E. MacLaughlin, G. J. Nieuwenhuys, G. Ehlers, F. Mezei, S.-W. Cheong, J. S. Gardner, and H. Röder, Phys. Rev. Lett. 85, 3285 (2000).
- (27) M. M. Savosta, V. A. Borodin, P. Novák, Z. Jirák, J. Hejtmánek, and M. Maryško, Phys. Rev. B 57, 13379 (1998).
- (28) G. Matsumoto, J. Phys. Soc. Japan 29, 615 (1970).
- (29) A. A. Sidorenko, G. Allodi, R. De Renzi, G. Balestrino, and M. Angeloni, Phys. Rev. B 73, 054406 (2006).
- (30) M. M. Savosta, and P. Novák, Phys. Rev. Lett. 87, 137204 (2001).
- (31) G. Allodi, and R. De Renzi, unpublished.
- (32) We rule out frequency pulling as the origin of the low temperature anomaly in , as such an effect is usually important only in the kelvin or sub-kelvin range and, moreover, it gives rise to frequency shifts of the opposite sign. See P. De Gennes, P. Pincus, F. Hartmann-Boutron, and J. Winter, Phys. Rev. 129, 1105 (1963).
- (33) G. Allodi, R. De Renzi, F. Licci, and M. W. Pieper, Phys. Rev. Lett. 81, 4736 (1998).
- (34) R. H. Heffner, J. E. Sonier, D. E. MacLaughlin, G. J. Nieuwenhuys, G. M. Luke, Y. J. Uemura, William Ratcliff, S-W. Cheong, and G. Balakrishnan, Phys. Rev. B 63, 094408 (2001).
- (35) K. Ghosh, C. J. Lobb, R. L. Greene, S. G. Karabashev, D. A. Shulyatev, A. A. Arsenov, and Y. Mukovskii, Phys. Rev. Lett. 81, 4740 (1998).
- (36) R. H. Heffner, J. E. Sonier, D. E. MacLaughlin, G. J. Nieuwenhuys, F. Mezei, G. Ehlers, J. F. Mitchell, and S.-W. Cheong, Physica B 326, 494 (2003).
- (37) M. H. Phan, V. Franco, N. S. Bingham, H. Srikanth, N. H. Hur, and S. C. Yu, J. All. Comp. 508, 238 (2010).
- (38) P. W. Anderson, and H. Hasegawa, Phys. Rev. 100, 675 (1955).
- (39) Hakim Meskine, Harald König, and Sashi Satpathy, Phys. Rev. B 64, 094433 (2001).
- (40) Lide M. Rodriguez-Martinez and J. Paul Attfield, Phys. Rev. B 58, 2426 (1998).
- (41) D. Kim, B. Revaz, B. L. Zink, F. Hellman, J. J. Rhyne, and J. F. Mitchell, Phys. Rev. Lett. 89, 227202 (2002).
- (42) J. Mira, J. Rivas, L. E. Hueso, F. Rivadulla, M. A. López Quintela, M. A. Señarís Rodríguez, and C. A. Ramos, Phys. Rev. B 65, 024418 (2001).
- (43) M. F. Hundley, M. Hawley, R. H. Heffner, Q. X. Jia, J. J. Neumeier, J. Tesmer, J. D. Thompson, and X. D. Wu, Appl. Phys. Lett. 67, 860 (1995).
- (44) Y. Tomioka, A. Asamitsu, and Y. Tokura, Phys. Rev. B 63, 024421 (2000).
- (45) N. Mannella, A. Rosenhahn, C. H. Booth, S. Marchesini, B. S. Mun, S.-H. Yang, K. Ibrahim, Y. Tomioka, and C. S. Fadley, Phys. Rev. Lett. 92, 166401 (2004).
- (46) K. Huang, Statistical Mechanics (Wiley, New York, 1987), 2nd ed., Chap. 17.6
- (47) The discrepancy between in e.g. Ref. tricritical, and in our La5/8Ca3/8MnO3 sample is consistent with a similar difference between the determinations of in nearly optimally doped LSMO, respectively, by magnetometry and NMR-SR, where our techniques systematically detect smaller values.
- (48) G. Allodi, M. Cestelli Guidi, R. De Renzi, and M. W. Pieper, J. Mag. Mag. Mater. 242-245, 635 (2002).
- (49) Louis Felix Feiner, and Andrzej M. Oleś, Phys. Rev. B 71, 144422 (2005).
- (50) P. A. Algarabel, J. M. De Teresa, J. Blasco, M. R. Ibarra, Cz. Kapusta, M. Sikora, D. Zajac, P. C. Riedi, and C. Ritter, Phys. Rev. B 67, 134402 (2003).
- (51) A. J. Freeman and R. E. Watson, Hyperfine Interactions in Magnetic Materials, in Magnetism IIA, eds. G. T. Rado, H. Suhl, Academic Press, New York (1965)
- (52) X. Xiong, B. Dabrowski, O. Chmaissem, Z. Bukowski, S. Kolesnik, R. Dybzinski, C. W. Kimball, and J. D. Jorgensen, Phys. Rev. B 60, 10186 (1999).
- (53) D. R. Taylor, J. Owen, and B. M. Wanklyn, J. Phys. C 6, 2592 (1973).
- (54) Nai Li Huang, R. Orbach, E. Šimánek, J. Owen, and D. R. Taylor, Phys. Rev. 156, 383 (1967).
- (55) Nai Li Huang, R. Orbach, and E. Šimánek, Phys. Rev. Lett. 17, 134 (1966).
- (56) M. Sonobe and K. Asai, J. Phys. Soc. Jpn. 61 4193 (1992).
- (57) F. Mila and T. M. Rice, Physica C 157, 561 (1989).
- (58) M. Weger, Phys. Rev. 128, 1505 (1962).
- (59) M. J. R. Hoch, P. L. Kuhns, W. G. Moulton, A. P. Reyes, M. A. Torija, J. F. Mitchell, and C. Leighton, Phys. Rev. B 75, 104421 (2007).
- (60) The two-magnon scattering term, active in the relaxation of muons, is forbidden by spin conservation in the case of nuclei, due to the isotropy of the 55Mn hyperfine coupling, hence the leading term in nuclear relaxations is three-magnon scattering (see D. Beeman and P. Pincus, Phys. Rev. 166, 359 (1968)). At this relatively high temperature, however, the two- and three-magnon terms are of comparable importance. This implies an extra scaling factor for the nuclear in the order of a few units. We maintain therefore that the present prediction for is still an overestimate of the muon relaxation rate by spin fluctuations.