A- and B-type star pulsations in the Kepler and CoRoT era: theoretical considerations
Saio H.
Institute of Astronomy, Graduate School of Science, Tohoku University, email: saio@astr.tohoku.ac.jp
Abstract Among A-type main-sequence variables, pulsations of Sct and Dor variables are driven in the He II ionization zone, while H-ionization zone and strong magnetic fields seem to play roles in the excitation of high-order p-modes in rapidly oscillating Ap (roAp) stars. Pulsations in B-type variables, Cephei and slowly pulsating B (SPB) stars are excited by the -mechanism at the Fe-opacity bump at K. In addition, the strange-mode instability seems responsible for the excitation of pulsations in luminous AB-supergiants ( Cygni variables). We discuss excitation mechanisms for pulsations in A- and B-type variables stars.
1 Introduction
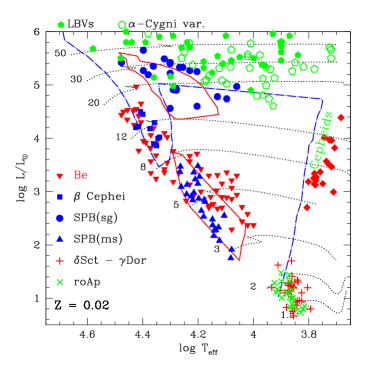
Figure 1 is a HR diagram showing positions of variable A- and B-type stars, and theoretical excitation boundaries for radial (p-) modes and g-modes. Pulsations of these stars are believed to be self excited by thermal processes, in which radiative flux plays a dominant role. (We do not discuss stochastic excitation by turbulent convection in this paper.)
If the energy flux from stellar interior is blocked (released) and matter gains (loses) energy in the compressed (expanded) phase, the next expansion (contraction) will be slightly stronger than the previous one; i.e., amplitude will grow slightly; this is a simplified interpretation of the (or opacity)-mechanism (e.g., Cox[6], Aerts et al.[1] for detail). The -mechanism driving (in weakly nonadiabatic conditions) occurs if
| (1) |
(Unno et al.[24], ch. 5), where , , and with , and being temperature, density, and specific entropy, respectively. The condition is satisfied only in a narrow zone of the hotter side of an opacity peak, and surrounding layers work to damp pulsations. If the driving effect exceeds the damping effect, the pulsation will be excited. The thermal coupling in a layer is most effective if the local thermal time is comparable to the pulsation period. Since the thermal time is shorter if the layer is closer to the surface, the -mechanism is strongest in models having around an optimal value associated with each opacity peak; the optimal is higher if the temperature at the opacity peak is higher. The Fe opacity peak at K is responsible for pulsations of B-type stars, while the peak at He II ionization zone ( K) is responsible for Sct and the classical Cepheids.
If the luminosity to mass ratio is very large; i.e., , the -mechanism is enhanced by the confinement of pulsation energy around an opacity peak, and the strange-mode instability occurs. This corresponds to the nearly horizontal boundary in Fig. 1, which bounds the distribution of Cygni variables.
In the following, we discuss excitations of A- and B-type variables in direction of decreasing luminosity.
2 Cygni variables; AB-type bright supergiants
The Cygni variables show semi-regular light and radial-velocity variations with periods of roughly 10 to days. At least some of the semi-periodic variations are considered to be caused by stellar pulsations. Some of the Cygni variables are LBVs (S Dor variables) showing long-term (a few years to decades) variations, on which -Cygni type micro variations are superposed. As seen in Fig.,1, the distribution boundary of Cygni variables is roughly horizontal (), involving massive stars whose initial masses are larger than about . The horizontal boundary indicates that the strange mode instability (Glatzel[11],Saio et al.[21], Saio[17]) is responsible to excite the pulsations of these stars.
For normal blue to red evolutions of massive stars, however, the instability boundary occurs at ([17]) corresponding a initial mass larger than ; the boundary is far too luminous compared with the observational boundary of the distribution of Cygni variables in the HR diagram. The problem can be solved by assuming that the Cygni variables are evolving bluewards after losing significant mass in the red-supergiant phase (Saio et al.[22]). However, these models predict surface N/C and N/O ratios which are much larger than the results of spectroscopic analyses (e.g., Przybilla et al.[16]). Since the surface chemical compositions depend on the internal mixing, the solution of the problem might constrain the assumptions on internal mixing during the evolution of massive stars.
3 B-type variable stars
3.1 Excitation
Pulsations of B-type stars are excited around the Fe opacity peak at K. P-mode ( Cephei) instability region (dash-dotted line in Fig. 1) is located on the hotter side of the two g-mode (SPB) instability regions (solid lines), although these excitations are caused by the same opacity peak. This difference is interpreted by the relation between the thermal time in the driving zone (i.e., opacity peak) and the pulsation period. As mentioned in §1, -mechanism driving is most effective if the thermal timescale is comparable to the pulsation period, and the thermal timescale at a certain temperature zone is shorter in the hotter model. For this reason, a shorter-period p-mode instability region is hotter than that of g-modes with longer periods.
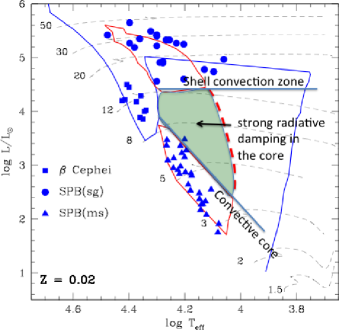
The g-mode instability region itself is separated into two regions. If the instability were determined only by the efficiency of the mechanism, the separation would not occur as indicated by a dashed line in Fig. 2. The interruption arises from a change in the internal structure of the post-main-sequence stars, by which the g-mode property is affected strongly. As a star terminates the main-sequence evolution, a convective core is replaced with a radiative dense core having a very high Brunt-Väisälä frequency , which is defined as
| (2) |
where is the local gravitational acceleration, pressure, density, and distance from the center. The typical wavelength of a g-mode being (e.g., [1, 24]; g-mode frequency) is very short in the radiative core having very high ; the short wavelength enhances radiative damping there. For this reason, g-modes are generally expected to be damped in post main-sequence stars, which generates the instability boundary at the termination of main-sequence phase for stars with initial masses of (Fig. 2). During the post main-sequence phase of a more massive star, however, a shell convection zone appears above a hydrogen burning shell; the shell convection zone can reflect g-modes and prevent g-modes from suffering strong radiative damping in the interior (e.g., Saio et al.[23]). The reflection makes g-mode excitation possible above the luminosity boundary at () in the post-main-sequence stage. This explains periodic light variations in blue supergiants found by Hipparcos and MOST satellites ([23], Lefever et al.[14]). If the luminosity boundary is accurately determined observationally, it will provide a test for evolutionary models. The effects of overshooting and mass loss on the appearance of the shell convection zone is discussed in Godart et al.[12].
The distribution boundary of the main-sequence SPB stars tells us the exact locus of the termination of main-sequence phase which depends on the assumption of core overshooting. The distribution shown in Fig. 2 seems to be consistent with the theoretical prediction by models without core overshooting, indicating that little core-overshooting occurs in the main-sequence SPB stars (they are known to be relatively slow rotators). This contradicts the recent estimate of a 0.2–0.3 ( pressure scale height) core-overshoot from period spacing of the SPB star HD 50230 by Degroote et al.[8]. Furthermore, detailed comparisons with observed frequencies of Cephei stars tend to indicate the presence of substantial () core-overshooting (see discussion in e.g. [19]).
Figure 1 also shows the positions of rapidly rotating Be stars, most of which are known to show short-term light and spectroscopic variations attributed to g-mode pulsations (sometimes called SPBe). The distribution extends well beyond the theoretical main-sequence band for models without core-overshooting. This indicates the presence of considerable internal mixing in these rapidly rotating stars, which prolongs the main-sequence evolution. The required mixing corresponds to a core-overshooting up to (Neiner et al.[15]).
3.2 Observed frequency distributions of g-modes in rapidly rotating stars
In a rapidly rotating star, frequencies in the co-rotating frame, , of intermediate to high order g-modes are much smaller than ( i.e., ), where and are azimuthal order of the nonradial pulsation and the angular frequency of rotation (uniform rotation assumed), respectively. Then, the frequencies in the observer’s frame are ; they form groups associated with azimuthal-order (here we adopt the convention that corresponds to prograde modes). Such frequency groupings have been detected in the Be star HD 163868 by a MOST observation (Walker et al.[25]), in which two frequency groups are identified as prograde sectoral g-modes of order and . This identification is consistent with the theoretical prediction that prograde sectoral modes are least affected by damping due to mode-couplings and likely excited (Aprilia et al.[2]). The property can be used to determine the rotation frequencies of Be stars without relying on the spectroscopic information of rotation velocities (see Cameron et al.[5], Saio[20]). We note that the frequency groupings of g-modes can also occur in rapidly rotating normal B stars as found by Kepler (Balona et al.[4]).
4 Main-sequence A-type variable stars
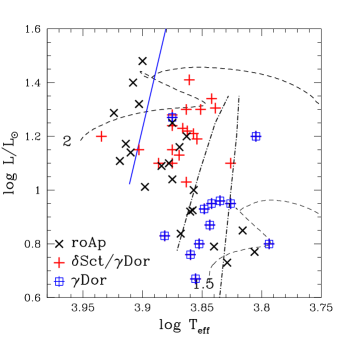
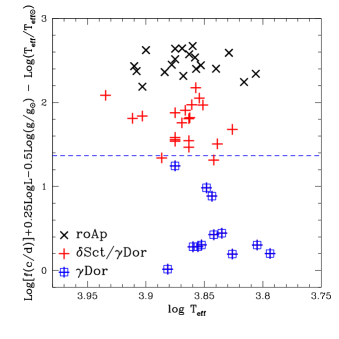
The main-sequence A-type variables; Sct, Dor, and roAp stars are located approximately in the same region of the HRD, where the Cepheid instability strip crosses the main sequence (Figs. 1, 3). These groups pulsate in different ranges of frequencies (or periods) as seen Fig 4, which shows the dominant frequency of each star normalized to the sun (to eliminate the effects of different luminosity and effective temperature). The horizontal dashed line indicates the frequency of radial fundamental mode. As we see in this figure, g-modes, low-order p-modes, and high-order p-modes are excited in Dor stars, Sct stas, and in roAp stars, respectively.
As is well known, the p-mode pulsations of Sct stars are excited by the -mechanism in the He II ionization zone. In a broad sense, the relation between the optimal for the p-mode excitation in Sct stars and the g-mode excitation in Dor stars by the He II opacity peak is similar to the relation between p-modes of Cep stars and g-modes in SPB stars by the Fe opacity peak. The former case, however, is more complicated because in the He II ionization zone of Dor stars efficient convection occurs, while Fe opacity peak region (for the latter case) is radiative in main-sequence SPB stars. Therefore, it is necessary to include convection-pulsation couplings in order to examin the stability of g-modes in Dor stars. The region bounded by the two dash-dotted lines in Fig. 3 is a region predicted for g-modes to be excited (Dupret et al.[9]). The range is roughly consistent with the distribution of Dor stars.
However, recent space photometries by Kepler and CoRoT satellites revealed that many Sct stars show g-mode pulsations as well; i.e., there are many Sct - Dor hybrids (see Grigahcène et al.[13] for detail). Therefore, at present we do not understand the excitation of g-modes in A-type main-sequence stars.
4.1 Excitation of high-order p-modes in roAp stars
As we see in Fig. 4, roAp stars pulsate in high-order p-modes, comparable to the solar 5 min oscillations. Although roAp stars have effective temperatures similar to those of Sct stars, He II ionization zone is ineffective to drive such high order p-modes because the periods are much shorter than the thermal timescale there. Rather, the periods are comparable to the timescale in H-ionization zone, but the driving effect is weakened by the convective flux. Balmforth et al. [3] found that high order p-modes are excited by the -mechanism in the H-ionization zone if a strong magnetic field suppresses convection in the polar region. The excitation region on the HR diagram (Cunha [7]) seems consistent with most of the roAp strs. However, some inconsistency becomes apparent if the frequency ranges of roAp stars are compared.
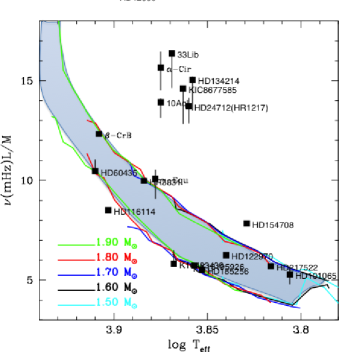
Figure 5 shows the instability region of high-order p-modes (shaded region) in the plane, where is oscillation frequency, and are in solar units. In this diagram, minimum and maximum frequencies of high-order p-modes excited in various models (with suppressed convection) are located along two lines, respectively, forming the instability region. Also plotted are selected roAp stars having relatively well determined parameters. Obviously, some well studied roAp stars are located far from the instability region. They are above the acoustic cut-off frequency. Currently, it is not clear how to excite these modes, the effect of atmospheric temperature inversions considered in Gautschy et al. [10] seems not strong enough.
Acknowledgements. I am grateful to Alfred Gautschy for useful comments.
References
- [1] Aerts C., Christensen-Dalsgaard J., Kurtz D.W. 2010, Asteroseismology (Springer)
- [2] Aprilia, Lee U., Saio H. 2011, MNRAS, 412, 2265
- [3] Balmforth N. J., Cunha M. S., Dolez N., Gough D. O., Vauclair S. 2001, MNRAS, 323, 362
- [4] Balona L. A., Pigulski A., Cat P. De, Handler G., et al. 2011, MNRAS, 413, 2403
- [5] Cameron C., Saio H., Kuschnig R., Walker G. A. H., et al. 2008, ApJ, 685, 489
- [6] Cox J.P. 1974, Rep. Prog. Phys., 37, 563
- [7] Cunha M. S. 2002, 333, 47
- [8] Degroote P., Aerts C., Baglin A., Miglio A., et al. 2010, Nature, 464, 259
- [9] Dupret M.-A., Grigahcène A., Garrido R., Gabriel M., Scuflaire R. 2005, A&A, 435, 927
- [10] Gautschy A., Saio H., Harzenmoser H. 1998, 301, 31
- [11] Glatzel W.1994, MNRAS, 271, 66
- [12] Godart M., Noels A., Dupret M.-A, Lebreton Y. 2009, MNRAS, 396, 1833
- [13] Grigahcène A., Antoci V., Balona L., Catanzaro G., et al. 2010, ApJL, 713, L192
- [14] Lefever K., Puls J., Aerts C. 2007, A&A, 463, 1093
- [15] Neiner C., Mathis S., Saio H., Lovekin C., Eggenberger P., Lee U. 2012, A&A, 539, A90
- [16] Przybilla N., Firnstein M., Nieva M.F., Meynet G., Maeder A. 2010, A&A, 517, A38
- [17] Saio H. 2009, CoAst, 158, 245
- [18] Saio H. 2011, MNRAS, 412, 1814
- [19] Saio H. 2012, in ’Progress in Solar/Stellar Physics with Helio- and Asteroseismology’ eds. Shibahashi et al., ASPC, 462, 455
- [20] Saio H. 2013, in ’Studying Stellar Rotation and Convection’ eds. M. Goupil et al., LNP, 865, 159
- [21] Saio H., Baker N.H., Gautschy A. 1998, MNRAS, 294, 622
- [22] Saio H., Georgy C., Meynet G. 2013, MNRAS, 433, 1246
- [23] Saio H., Kuschnig R., Gautschy A., Cameron C., et al. 2006, ApJ, 650, 1111
- [24] Unno W., Osaki Y., Ando H., Saio H., Shibahashi H. 1989, Nonradial Oscillations of Stars (University of Tokyo Press, Tokyo)
- [25] Walker G. A. H., Kuschnig R., Matthews J. M., Cameron C., et al. 2005, ApJ, 635, 77