Implosion of coronal loops during the impulsive phase of a solar flare
Abstract
We study the relationship between implosive motions in a solar flare, and the energy redistribution in the form of oscillatory structures and particle acceleration. The flare SOL2012-03-09T03:53 (M6.4) shows clear evidence for an irreversible (stepwise) coronal implosion. Extreme-ultraviolet (EUV) images show at least four groups of coronal loops at different heights overlying the flaring core undergoing fast contraction during the impulsive phase of the flare. These contractions start around a minute after the flare onset, and the rate of contraction is closely associated with the intensity of the hard X-ray (HXR) and microwave emissions. They also seem to have a close relationship with the dimming associated with the formation of the Coronal Mass Ejection (CME) and a global EUV wave. Several studies now have detected contracting motions in the corona during solar flares that can be interpreted as the implosion necessary to release energy. Our results confirm this, and tighten the association with the flare impulsive phase. We add to the phenomenology by noting the presence of oscillatory variations revealed by GOES soft X-rays (SXR) and spatially-integrated EUV emission at 94 and 335 Å. We identify pulsations of seconds in SXR and EUV data, which we interpret as persistent, semi-regular compressions of the flaring core region which modulate the plasma temperature and emission measure. The loop oscillations, observed over a large region, also allow us to provide rough estimates of the energy temporarily stored in the eigenmodes of the active-region structure as it approaches its new equilibrium.
Subject headings:
Sun: flares - Sun: magnetic topology - Sun: oscillations - Sun: particle emission - Sun: UV radiation - Sun: X-rays, gamma rays1. Introduction
Understanding the interplay of the magnetic field evolution, both in the corona and in the photosphere, and the time evolution of electromagnetic emissions produced during a flare can provide information about the nature of the energy-release process and its location. The energy for flares and CMEs comes from the coronal magnetic field, stored in regions displaying magnetic stress, and we can observe the evolution of these regions via their emissions. The extraction of the magnetic energy must correspond in a general sense to a reduction in the magnetic pressure, and consequently the magnetic structure must contract so as to achieve a new equilibrium position. This scenario was proposed by Hudson (2000), suggesting that such implosions of the coronal magnetic field could be detected with extreme-ultraviolet (EUV) observations, such as TRACE. We present here an excellent example of this in the flare SOL2012-03-09 (M6.4) observed by the Solar Dynamics Observatory (Pesnell et al., 2012), showing inward motions and oscillations of loops both during and following the implosion. The event has well-resolved hard X-ray (HXR) sources that locate the main regions of energy output, and microwave emission which can sensitively identify the onset of particle acceleration.
Observations of such magnetic contractions in the energy-rich impulsive phase are still rare. We distinguish these from the “shrinkage” observed during the gradual phase of a flare (Forbes and Acton, 1996) and attributed to large-scale magnetic reconnection in a current sheet created by a flare eruption. We review some examples here, highlighting what is known about the relative timing of flare, contraction and CME. Liu et al. (2009) presented observations of contractions of three clusters of EUV coronal loops overlying the flaring region during the early impulsive phase of SOL2005-07-30. The contraction speed measured from TRACE 171 Å data was slow: about 4–7 km s-1 over about 10 minutes during the impulsive phase. This was accompanied by converging motion of the HXR footpoints. The downward motion of coronal HXR sources in the impulsive phase of solar flares, first reported by Sui and Holman (2003), can also be associated with converging footpoint motions (e.g. Liu et al., 2004), making it likely that the HXR source’s downward motion is part of the implosion phenomenon. Slow coronal loop contraction was also observed during the impulsive phase of SOL2003-10-24, with average speed of 6-10 km s-1 (Joshi et al., 2009). Veronig et al. (2006) observed downward motions of hard X-ray sources in SOL2003-11-03, and Ji et al. (2007) describe such motions as contraction resulting from the reduction of sheared field. Liu and Wang (2009) report TRACE 195 Å loop contraction sustained for 12 minutes in flare SOL2001-06-15. In this case the loop contraction occurred after the impulsive phase and was well associated in time with a filament eruption. The authors also argue that the collapsing loops formed a shrinking trap which then accelerated hot electrons to non-thermal energies, producing a new coronal HXR source a few minutes after the onset of the contraction. Liu and Wang (2010) observed a fast (100 km s-1) loop contraction with TRACE 171 Å delayed by about 200 seconds from the impulsive phase of SOL2005-09-08, but preceded by a much slower contraction phase. Liu et al. (2012) reported contracting and erupting (expanding) components in five flares originating from sigmoidal active regions, from GOES classes B to X, all observed with SDO/AIA. Contracting coronal loops overlying the ends of the sigmoid were observed in cooler AIA channels (i.e. 171 and 193 Å) while expanding bubbles were observed in warm/hot AIA channels (i.e. 94, 211, and 335 Å). Contraction speeds varied from 10 km s-1 to over 200 km s-1, with higher speeds corresponding to larger events. The eruption always preceded the contraction though the time delay was smaller for more energetic events, in which eruption was also concurrent with the HXR impulsive phase.
The well-observed flare SOL2011-02-15T01:50 (X2.2) has provided some of the clearest evidence for the implosion. Sun et al. (2012) reported EUV loops collapsing and oscillating during this flare, and made the important identification of this evolution with permanent changes in the photospheric magnetic field. Gosain (2012) identified three distinct phases of coronal loop dynamics in this event: a slow rise phase when the loops expanded prior to the flare; a rapid collapse phase of loop contraction, with the lower loops collapsing before the higher ones; and an oscillation phase when the loops displayed oscillations interpreted as global kink modes. This followed the collapse phase, and the period of oscillation increased with the height of the loop.
There have been many observations of flare-related loop oscillations or pulsations, observed in direct imaging and also in flare lightcurves at different wavelengths. Rather than summarise the literature here (reviews have been given by Nakariakov and Verwichte (2005); De Moortel (2005); Banerjee et al. (2007); De Moortel and Nakariakov (2012)) we highlight a few salient properties, focusing on events which appear to have an abrupt onset clearly related to a flare. From EUV imaging, oscillations appear to be triggered in a number of ways, for example the destabilisation and ejection of a filament which runs into a distant system of loops and excites them (examples given in Schrijver et al., 2002), the displacement of overlying loops as a global shock wave (as represented by a type II burst) impinges on them (Hudson and Warmuth, 2004), the oscillation of loops relaxing post-reconnection (White et al., 2012) or in association with a magnetic implosion (Liu and Wang, 2010; Sun et al., 2012). Our loop oscillations fall in this last category.
The majority of the imaging observations reported have been in the EUV, sampling loops with an estimated temperature of 1-1.5 MK, e.g. from the Transition Region and Coronal Explorer (TRACE; Handy et al., 1999) but UV spectroscopic observations by Wang et al. (2002) and Wang et al. (2003), using the Solar Ultraviolet Measurement of Emitted Radiation instrument (SUMER; Wilhelm et al., 1995) have detected oscillatory Doppler-shift signatures in lines from ions at formation temperatures in excess of 6 MK, identified as standing slow-mode oscillation. High-temperature oscillating loops (9-11 MK) were detected using SDO/AIA by White et al. (2012). The authors described the excitation as a release or relaxation of a loop following large-scale magnetic reconnection, explaining their high temperatures as consistent with a post-flare coronal plasma.
Non-imaging observations, particularly of flare HXR and microwave lightcurves, show oscillatory structure often termed ‘pulsations’ and related to particle dynamics (e. g. Chiu, 1970). Since HXR emission is only weakly directional for steep spectra, pulsations in the HXR flux are probably due to variations either in the electron acceleration rate, or possibly in the precipitation rate in a periodically compressing and expanding loop. Microwave emission from non-thermal electrons, on the other hand, is strongly directional, so microwave pulsations could also be due to a global kink mode, which would generally change the line-of-sight angle, or even due a global sausage mode which would change the field strength in the emitting region (e. g. Nakariakov and Melnikov, 2009). Pulsations in line and continuum emissions in soft X-rays have not been frequently remarked upon (but see Mariska, 2006; Dolla et al., 2012); we discuss here their presence in the GOES data for the event we study. Variations at these wavelengths require changes in plasma temperature, density or volume, so they may also require a compressional mode, or a rapid sequence of heating/cooling events at different locations.
2. Observational data and analysis
The flare SOL2012-03-09 (M6.4) occurred around 03:40UT, in active region NOAA 11429 (N17W12), and it was observed by many observatories: in microwaves by the Nobeyama Radio Heliograph (NoRH, Nakajima et al., 1994) and Nobeyama Radio Polarimeter (NoRP, Nakajima et al., 1985), in HXR by Reuven Ramaty High Energy Solar Spectroscopic Imager (RHESSI, Lin et al., 2002) and Fermi Gamma-ray Burst Monitor (GBM, Meegan et al., 2009), in soft X-rays (SXR) by Geostationary Operational Environmental Satellite (GOES). High resolution images in EUV taken by the Atmospheric Imaging Assembly (AIA), and line-of-sight magnetograms from Helioseismic and Magnetic Imager (HMI), both on board of SDO were also used in our analysis. As described below, these observations produced beautiful examples of large-scale loop contraction, wave excitation, dimming, and complex oscillations of loop structures. Hao et al. (2012) described this event as a white-light flare, underscoring the intensity of its energy release.
2.1. Pre-flare configuration of AR 11429
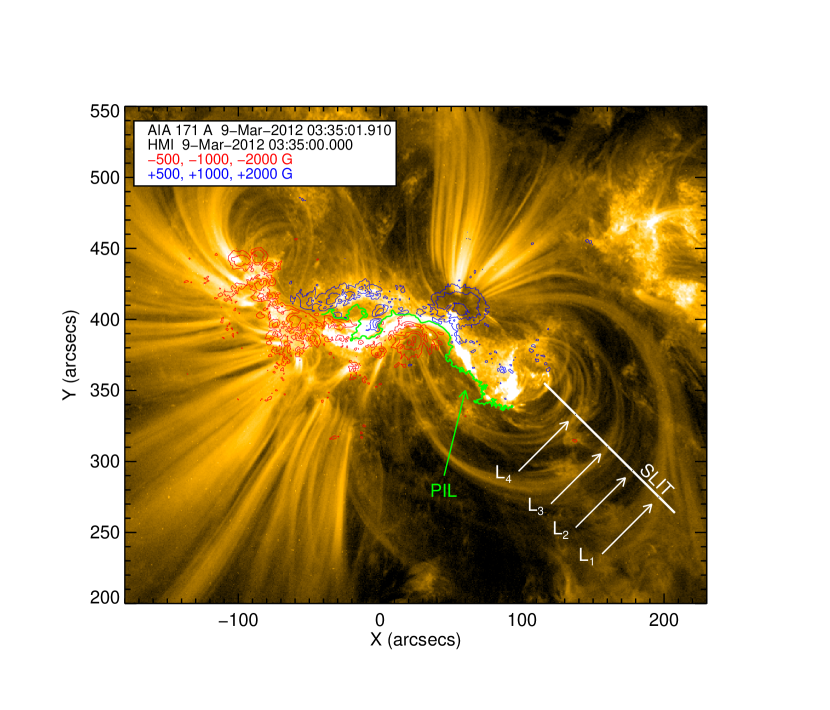
The magnetic configuration of the active region at the photospheric level was classified as . Fig. 1 shows the line-of-sight HMI magnetograms and the polarity inversion line (PIL) in the context of an AIA image at 171 Å. Some of the stronger magnetic kernels are connected by large-scale coronal loops, with their apexes projected as much as 100 Mm to the southwest of the region’s core. Their orientation is not clear, but they appear to arch around rather than over the active-region core, and thus may be very inclined with respect with the local vertical; other strongly magnetic regions appear to link to still larger-scale structures. The southwest loop structures, as labeled in Fig. 1, exhibit the contraction and oscillations discussed below. Prior to any flaring activity we can identify a dark filament in 171 Å following the magnetic polarity inversion line (PIL), which seems to connect the eastward positive polarity and the westward negative polarity. Between 03:0003:25 UT bright kernels appear along the filament. At 03:25 UT, brightenings associated with an M1.8 flare, followed by an M2.1 flare, appear at the east and west roots of the filament and along the filament itself, extending along the PIL. During this early interval prior to the main M6.4 event, the dark filament evolves to become a bright and highly sheared sigmoid structure. The temperature derived from GOES soft X-rays shows that the two smaller flares peak at MK and MK, cooling to MK before the main event; note that this earlier activity does not directly result in the dynamics discussed below.
2.2. Coronal implosion
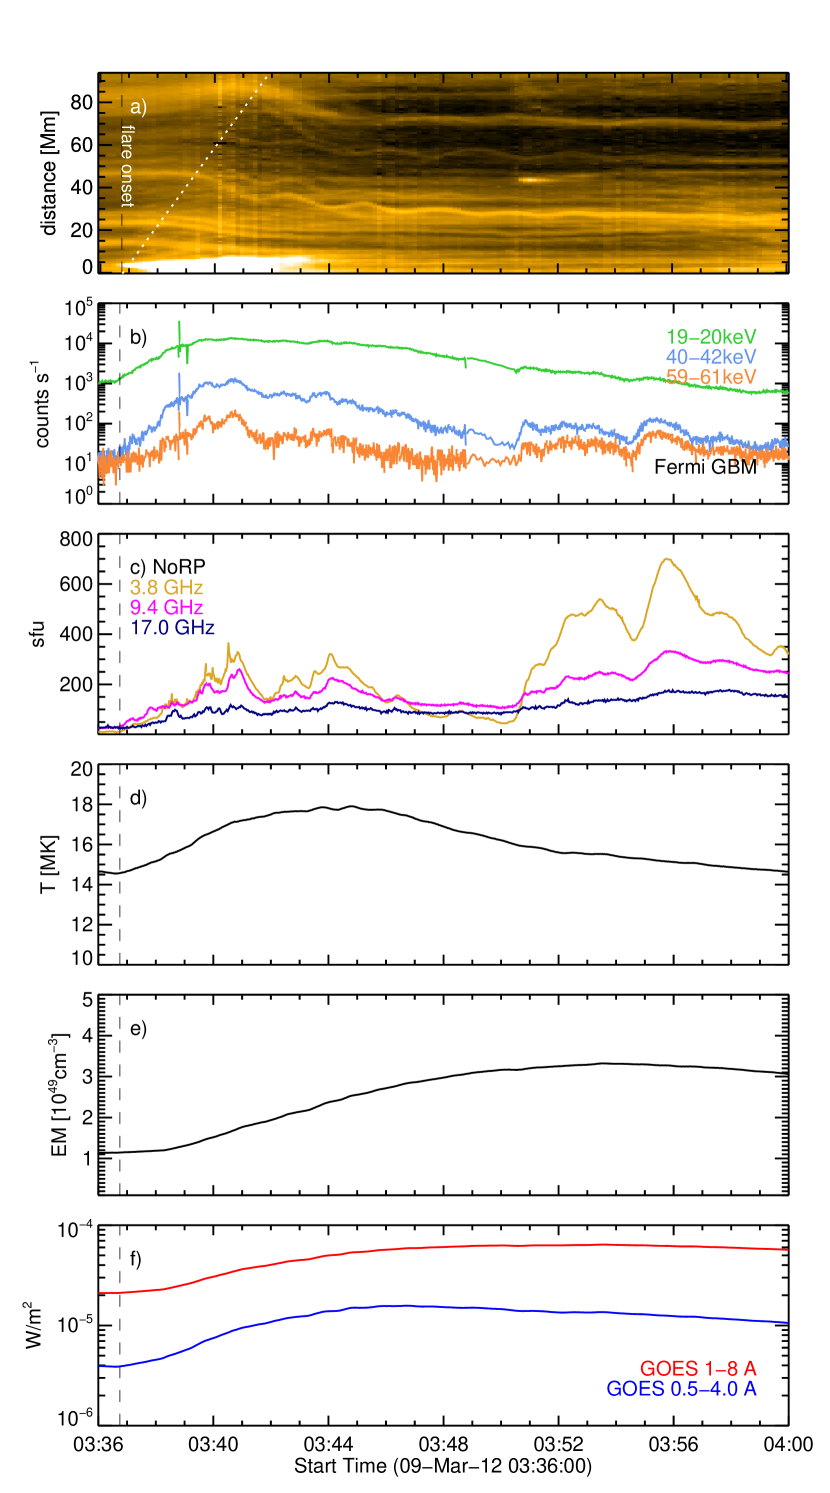
In Fig. 1 we show the position of a visible set of loops before the main impulsive phase of the flare. The group of large-scale loops, as seen at 171 Å (also seen in 131, 193 and 211 Å) and rooted in strong-field parts of the flaring region, rapidly contract during the impulsive phase of the flare. We can identify at least four loops (or narrow bundles of loops) marked to , from greater to smaller distance from the AR core). A slit 153 pixels long () and 3 pixels wide () was taken across the group of contracting coronal loops (see Fig. 1) and the time evolution of the intensity in AIA 171 Å images at the four locations along this slit is plotted in Fig. 2a. This time-position diagram shows the development of the EUV features: a pre-flare quiet period revealing a slow expansion of the EUV features, followed by a faster expansion after the two smaller flares (M1.8 at 03:27 UT and M2.1 at 03:34 UT), and a main contraction phase which includes the beginning of the oscillation phase. The three outer loops show evident oscillations even as they contract, with distinct periods and phases (Fig. 2b). It is not possible to tell from the data if the inner set oscillates after the contraction.
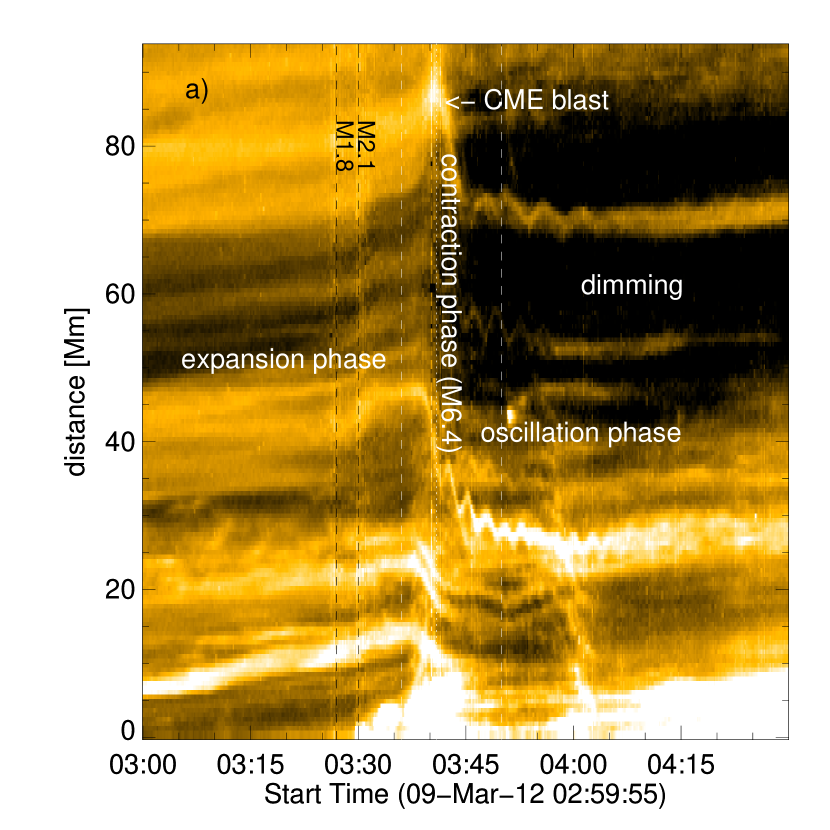
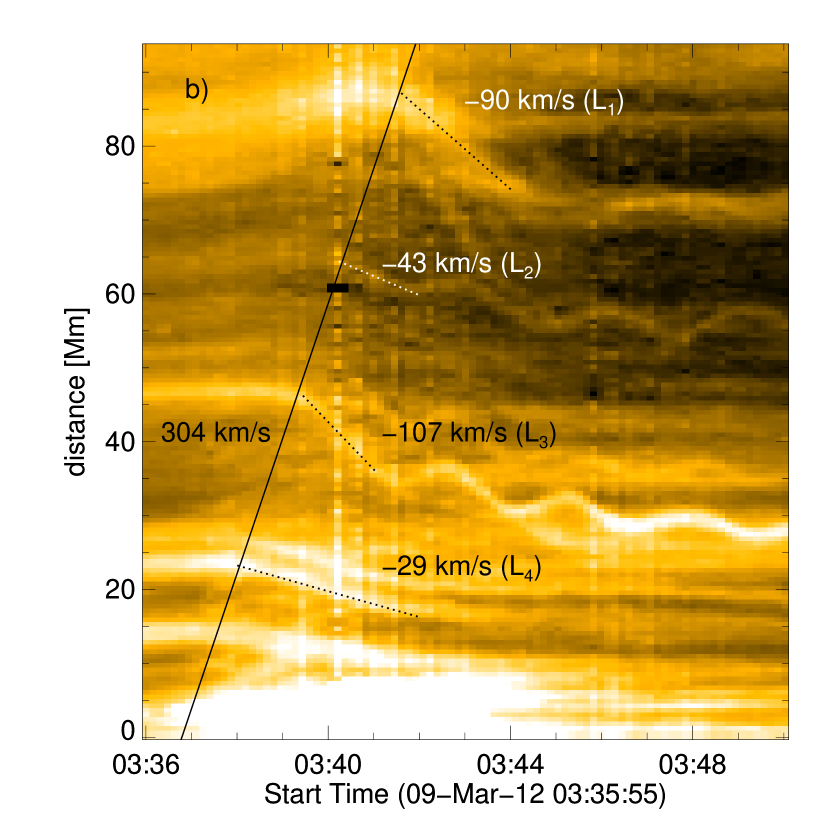
The onset and duration of the intense EUV emission below 10 Mm in Fig. 2b agrees in time with the flare impulsive phase, which continues (as shown by HXR and microwave emission, as discussed later) throughout the main contraction of loops at all heights. Each loop set seems to contract at a different projected speed of approximately , , , and km s-1 (for loops to ) (see Fig. 2b). The motion appears not only to be related to the general contraction, but also to the CME launch: A rapid expansion of the outer loops prior to the time marked “contraction phase” in Fig. 2a is evident and thereafter seemingly try to return to their original positions. Moreover, the coronal dimming coinciding with the passage of the EUV wave and CME launch is also clear.
The loops at different heights do not start to contract at the same time, showing evident delays of 60–80 seconds. The difference between initial and final projected heights of the loop sets are 13, 12, 20 and 6 Mm, from to respectively. Higher/longer loops show longer periods of oscillation, and loops that undergo greater displacements also contract faster, although a relationship between projected height and contracting speeds cannot be identified from these data.
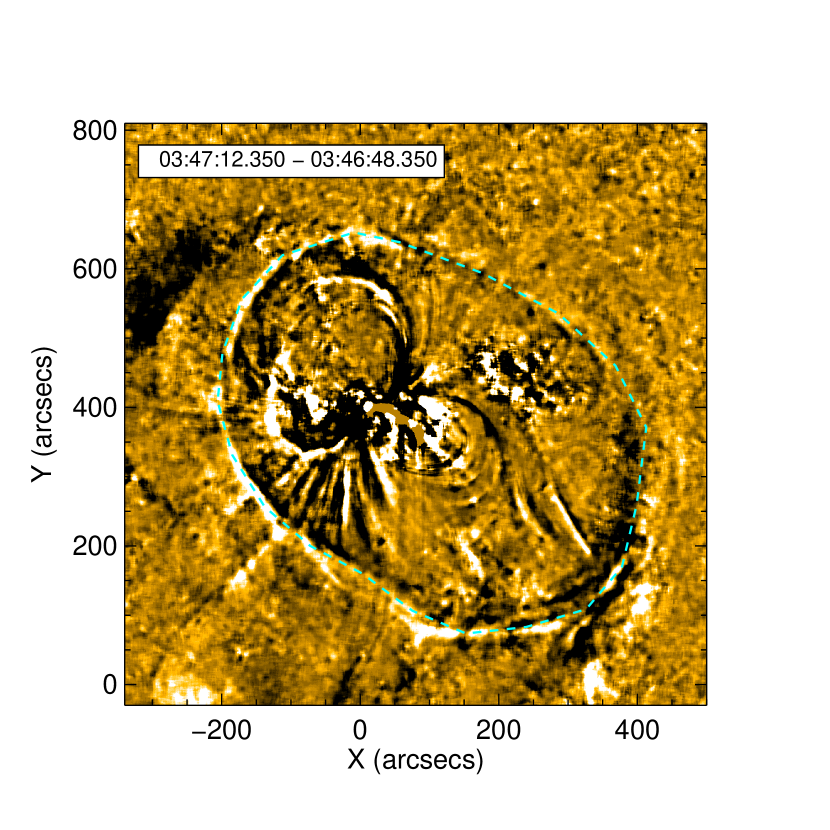
The movie representations of the AIA images show a global wave, roughly concentric with the core of the active region, which we illustrate with the snapshot in Fig. 3 at 171 Å (also seen in 193 and 211 Å). The presence of a large-scale shock disturbance, a reasonable interpretation of the EUV images, is consistent with the reported occurrence of a meter-wave type II burst in this event.
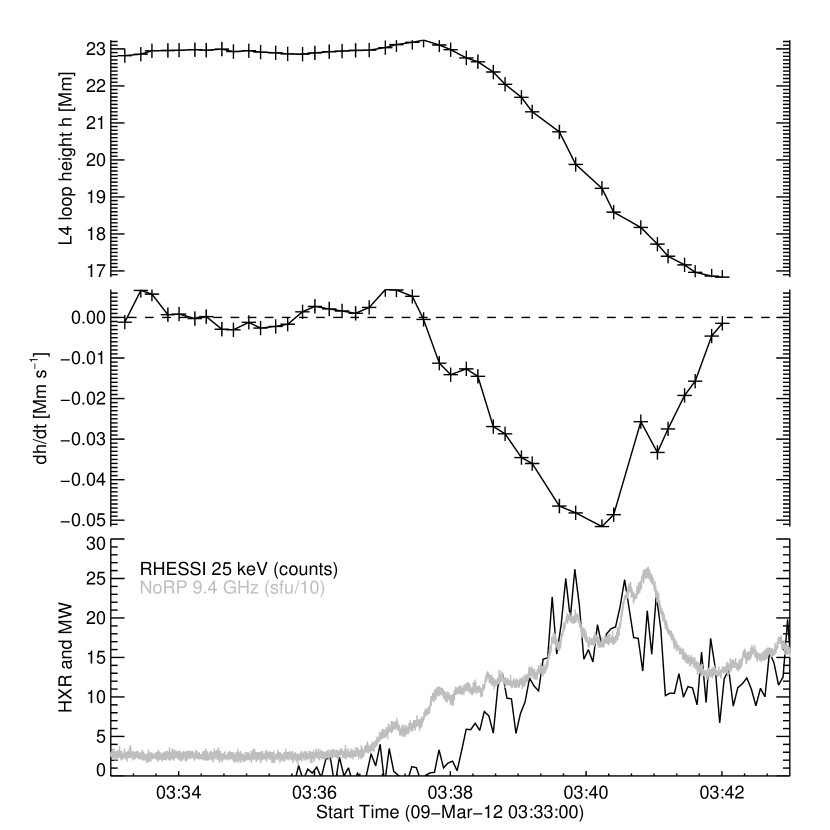
The onset of the contraction for loops L1 to L4 can be reasonably well identified. As shown in Fig. 4, it is clear that the contraction of the loops starts after the flare onset, which can be identified by the almost simultaneous increase in the flare HXR and microwave lightcurves at 03:36:45 UT while the L4 loop starts to collapse close to 03:38 UT. If we track back the contraction onset times to zero distance using a straight line, as shown in the right hand panel of Fig. 2 this gives an intercept also at around 03:36:45 UT. Note that this substantially precedes the time indicated as “contraction phase” in the Figure. Also note that the rate of contraction (middle panel of Fig. 4) is well associated with the non-thermal emission, reaching its maximum at the peak of the flare.
If we assume a common triggering mechanism for the implosion of the entire magnetic structure containing the four loops, the information travels outwards at a projected speed of km s-1 from the core of the active region. This speed, derived from the straight line connecting the onset of contraction of each one of the four loops, is only an order-of-magnitude estimate, due to projection effects of the inclined EUV loops. Nevertheless, it is clear that the contraction of the magnetic structure starts after the flare onset, and successively later at greater projected distances.
The outer EUV loops (, , and ) continue to contract rapidly (and start to oscillate) after the HXR peak (around 03:40 UT). This is all consistent with the association of energy release, into visible forms, with an implosion of the magnetic structure that had contained that energy.
2.3. UV/EUV ribbons and coronal loops
The ribbon/footpoint structures represent the site of the dominant impulsive-phase energy release, and so their association with the development of the coronal implosion provides a guide to the mechanisms of energy transport and dissipation.
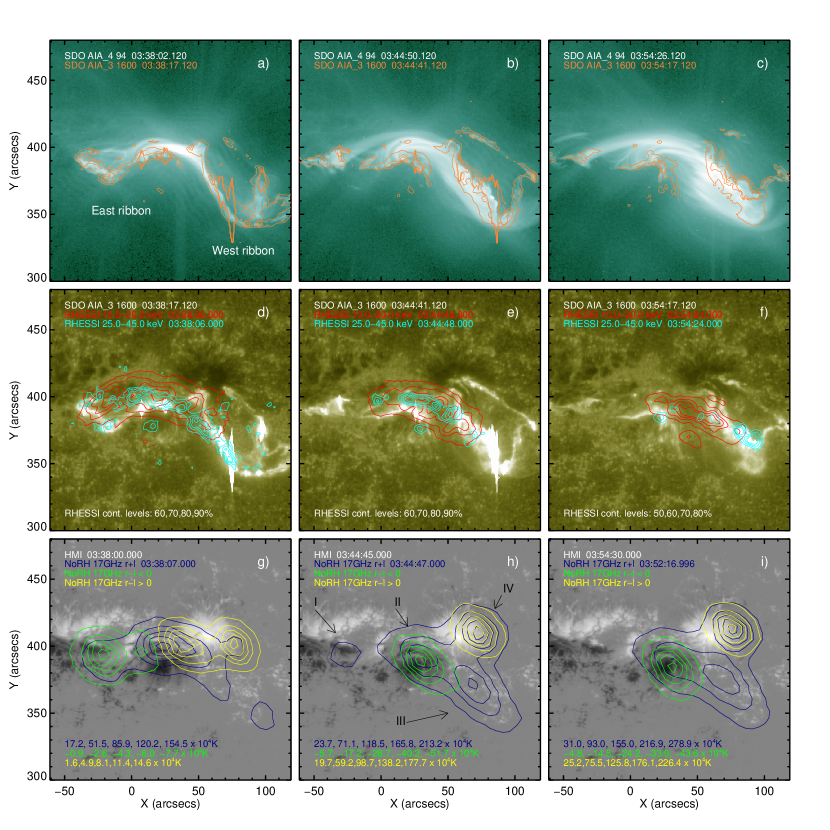
Fig. 5a–c shows the isocontours of EUV images taken by SDO/AIA at 1600 Å that reveal two highly sheared ribbons, almost orthogonal to each other, instead of the more usual quasi-parallel configuration. The ribbons are located on opposite sides of the PIL and extend along it. Several bright kernels flash along the ribbons during the impulsive phase. The ribbons appear to be connected by the coronal magnetic field, as seen in images at the higher-temperature EUV wavelengths (Fig. 5a–c). The chromospheric ribbons (1600 Å) shift in position during the flare, as the hot coronal loops (94 Å) expand, forming post-flare hot loops which decrease somewhat in apparent shear, though their final state is still highly sheared. These flaring coronal loops connecting the two magnetic domains around the flare can also be seen in the 171, 193, 211 and 335 Å images.
2.4. Hard X-rays and microwaves
2.4.1 Time evolution
We have shown the representative lightcurves for SXR, HXR, and microwaves in Fig. 6, along with temperature and emission measure derived from GOES data, and the EUV time-position diagram from Fig. 2. This also provides a convenient reference for the different phases of the flare development. The high-energy HXR and microwave emissions of the main flare started at 03:36:45 UT and peaked around 03:40:50 UT. EUV emission spatially integrated at wavelengths 171, 193, 211, 304, 1600 and 1700 Å also peak around this time, with good correlation with HXR and microwave main peaks, suggesting an association between the non-thermal electrons, the ionisation equilibrium of coronal and chromospheric EUV lines, and UV continuum emission in the chromosphere. At 94, 131, and 335 Å the emissions keep increasing, peaking after the GOES SXR peak and with different delays: 03:59:15 (94 Å), 03:53:11 (131 Å), 04:02:05 (335 Å), evidencing the cooling of the coronal plasma. Moreover, the peak time of the impulsive phase (determined from HXR and microwave data) closely matches the peak of the white-light flare signature reported by Hao et al. (2012), though their data only have one-minute time cadence.
2.4.2 Spatial characteristics
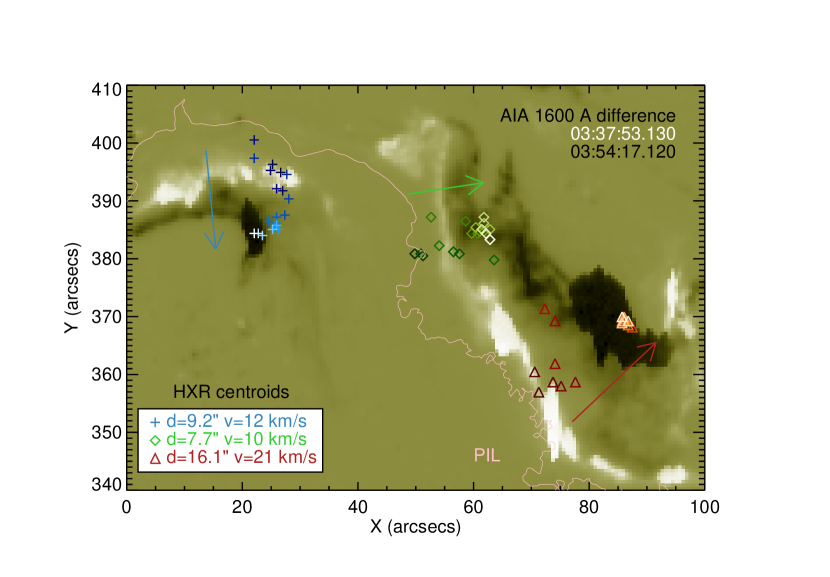
We constructed RHESSI CLEAN images at 10–20 keV and 25–45 keV at selected intervals during the event. The 25–45 keV images reveal the presence of at least three distinct sources, which we identify as chromospheric footpoints localized along the two UV ribbons. They are spatially coincident with the bright kernels seen in EUV images, as shown in Fig. 5d–f. During the flare, there is at least one footpoint source at each ribbon (at each side of the PIL), and these sources move (Fig. 7) along with the ribbons. The east footpoint (centroids indicated by crosses in Fig. 7) moves southwards, the middle footpoint (diamonds) moves westwards, while the west footpoint (triangles) moves northwest. The average distances and speeds are indicated in Fig. 7. The 10–20 keV maps shown in Fig. 5 are well associated with the coronal flaring loop arcade seen in AIA images throughout the entire flare.
Microwave Stokes I emission maps from NoRH at 17 and 34 GHz show an extended source in excellent agreement with the two-ribbon structure connected by low-lying coronal loops seen in EUV images (Fig. 5g–i). Moreover, at least four distinct sources can be identified at 17 and 34 GHz (indicated in Fig. 5h as I-IV), with two of them (II and III) in good association with the HXR 25-45 keV footpoint sources, at each ribbon. The implication is that during the impulsive phase the microwaves could originate mainly at the footpoints, or near the ends of their coronal loops, rather than from the main body of the loops (e.g. Reznikova et al., 2009, 2010). The rather steep spectral index derived from RHESSI HXR data (and further confirmed by Fermi GBM data, see Table LABEL:tab:hxr), indicates a lack of relativistic electrons, and thus strong magnetic fields such as one might find at footpoints are required to produce gyrosynchrotron emission at 17 and 34 GHz (e.g. Simões and Costa, 2006).
2.5. HXR, SXR and EUV pulsations
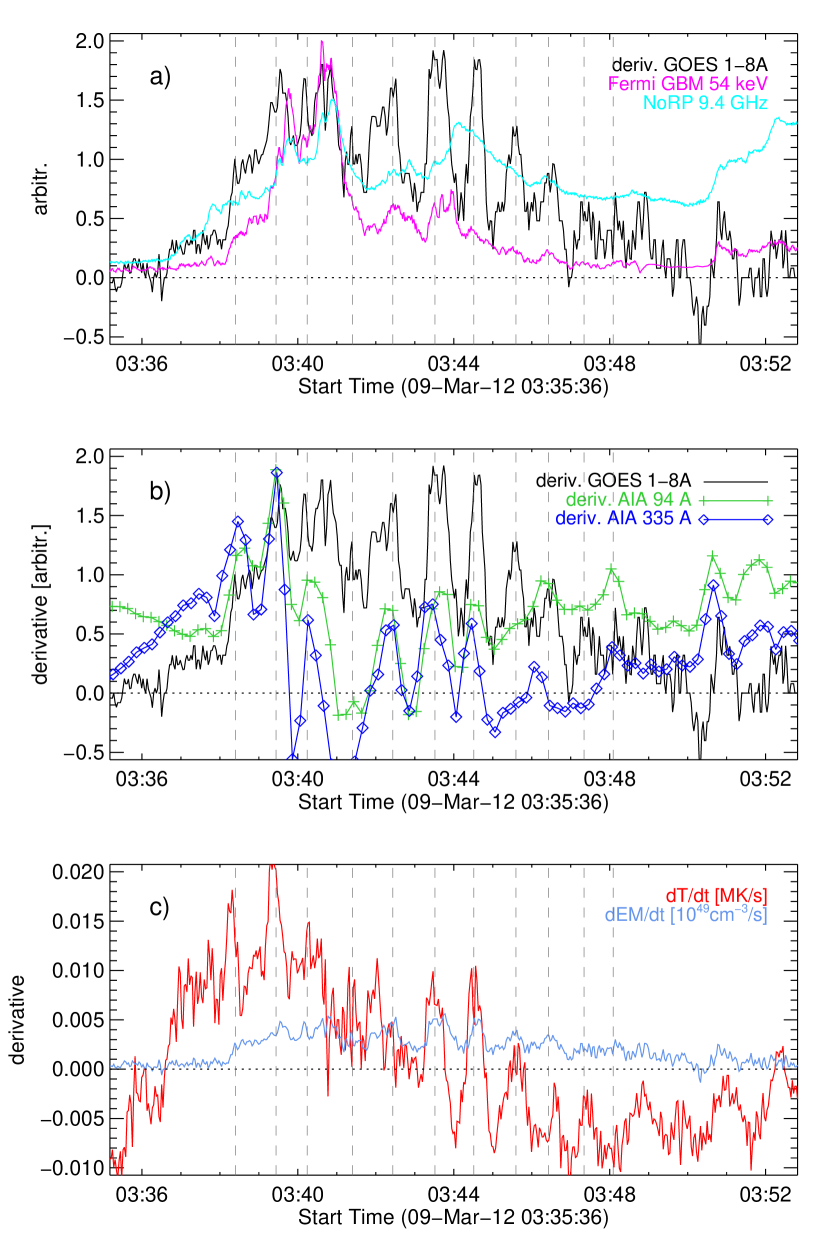
The oscillations of the large-scale EUV loops during and after their contraction is an obvious feature of this event, with oscillation periods around 2–5 min, and a detailed analysis will be presented elsewhere (Russell et al., in preparation). There are also shorter-period pulsations present, originating in hotter plasmas closer to the flare core. These are present in GOES data as well as spatially-integrated AIA data. The GOES time derivatives shown in Fig. 8a reflect the Neupert behavior (Neupert, 1968) in this event, but also enhances the visibility of oscillatory behavior at these soft X-ray temperatures. These become apparent after the end of the HXR impulsive phase, at 03:42 UT, in the form of at least five quasi-periodic pulses about 1 min. These quasi-periodic pulses are not so visible in the RHESSI HXR data, but they are clearly seen in Fermi GBM lightcurves (see Fig. 8a). We believe that this reflects the presence of the RHESSI attenuators, automatically deployed in major flares. This reduces the soft X-ray response relative to that of Fermi, which has no such attenuators. Similar oscillations are observed in the derivative lightcurves of 94 and 335 Å AIA channels (Fig. 8b) (the 131 Å channel saturates during the impulsive phase), and this mass of observational material makes it clear that large portions of the entire active-region volume have been set into persistent and semi-regular motions.
3. Discussion
3.1. Energetics of the event
Using instantaneous values for the EM and T derived from GOES (Fig. 6), we calculated the total thermal energy content111All formulae are quoted in CGS units. given by:
| (1) |
as well as its derivative with respect to time, which is the rate of increase of the thermal energy. The radiative (Eq. 2) and conductive (Eq. 3) loss rates are
| (2) |
and
| (3) |
using standard formulae (e.g. Tandberg-Hanssen and Emslie, 2009).
To estimate the volume in Eq. 1, we obtained the coronal source area at the 50% level of the RHESSI 10-20 keV maps, in 46 intervals during the main impulsive phase, and then took . The average value was determined, giving cm3. We use the radiative loss rate calculation implemented in the SSW GOES routines with parameters derived from the GOES observations. For the conductive loss rate, we have to estimate the loop area and length. The area is obtained done by selecting footpoint sources above 60% of maximum (to resolve individual footpoints) on the RHESSI 25–45 keV map at the peak at 03:40:06 UT. This gives cm2. The lower limit to the loop length is cm, estimated from the AIA 94 Å projected loop lengths. The final values that we arrive at are , and , averaged over the peak (03:39:40–03:41:00 UT). During this interval the average net increase of thermal energy is erg s-1. Using the value of the (dominant) conductive energy loss rate implies that energy input must be erg s-1 during this peak.
Considering now the energy budget of the main burst, the thermal energy from GOES before the flare (set by the smaller M-flares before the main event) is erg (at 03:38 UT) and erg after the HXR peak (at 03:48 UT), giving a net increase of erg. So, integrating the energy losses by radiation and conduction over the 10 minutes of the main burst (03:38–03:48 UT), we have erg and erg respectively, so erg. The value for the conductive loss rate is an upper limit as it must decrease as the lower corona gets hotter. Now, simply considering , the energy input into the thermal plasma during the 10 minute-period should be erg. We have fitted the spatially integrated HXR spectra observed by RHESSI to estimate the energy involved, assuming the standard collisional thick-target model. We assume a low-energy electron cut-off energy of 17 keV. Table LABEL:tab:hxr summarizes the results. Using the RHESSI fitting results to determine the electron energy rate, the energy of the non-thermal electrons (above 17 keV) can be calculated, by integrating over this period, at erg, which is consistent with .
| Temperature | 21 MK |
|---|---|
| Emission measure | cm-3 |
| Electron rate keV | s-1 |
| Spectral index | 5.5 |
| Electron energy | erg |
| Peak electron energy rate | erg s-1 |
3.2. Oscillations in the flaring core
The oscillations are seen in temperature and emission measure derived from GOES data (Fig. 8c), and the estimates in Sect. 3.1 show that the radiative and conductive losses are too slow to track them. Moreover, the time-coincidence of several observables is intriguing: around 03:38 UT, at the onset of the coronal implosion (see Fig. 4), the AIA 94 and 335 Å pulsations start (Fig. 8b) and occur roughly in phase with the GOES oscillations, the GOES EM increases rapidly and there is a peak in the rate of increase of the temperature (Fig. 8c). We interpret these quasi-periodic changes in temperature and emission measure as due to compressive oscillations of the flaring loops, as equilibrium is restored following the magnetic implosion. As kink-mode oscillations are only weakly compressive (Edwin and Roberts, 1983; Nakariakov and Verwichte, 2005; Van Doorsselaere et al., 2008; Goossens et al., 2009), most of the motion may be associated with global sausage modes or longitudinal standing slow waves. Van Doorsselaere et al. (2011), using PROBA2/LYRA data to study the flare SOL2010-02-08, found oscillatory signatures at two distinct periods, s and s, which were interpreted as standing (sausage) slow wave and fast sausage mode, respectively. Following their interpretation, we are tempted to favour the standing slow sausage mode. In any case, we can derive a lower limit on the energy stored in these standing waves from the variation of the thermal energy of the confined plasma, noting that considerably more stored energy may be present in the magnetic field itself. We consider that the average energy associated with the oscillations is the root-mean-square of the amplitude of the thermal energy derived from GOES (Eq. 1), after removing the slow-varying component. For the 10-minute duration of the main flare (03:38–03:48 UT) the average energy is erg. This is a first estimate of energy storage in the form of large-scale standing waves in a flaring active region, and our lower limit puts it at only a small fraction of the thermal energy (Eq. 1).
Compression of the loop magnetic field could be also associated with the HXR pulsations (e. g. Brown and Hoyng, 1975), as a betatron acceleration mechanism can increase the perpendicular momentum of electrons in the loop, via conservation of the first adiabatic invariant, , while the collapse of a loop can further accelerate particles via the first-order Fermi mechanism (e.g. Bogachev and Somov, 2005, 2007). According to Bogachev and Somov (2007) starting from a hot thermal distribution and accelerating by the betatron mechanism as the loop radius changes will result in another thermal distribution; to obtain a non-thermal distribution requires also loop collapse and Fermi acceleration. In this event we have evidence for both. Exact expressions for the spectral evolution are given in Bogachev and Somov (2007), however it was shown by Bogachev and Somov (2005) that the collapse of a field of initial mirror ratio and temperature results in a non-thermal spectrum with ‘effective temperature’ , characterizing the mean kinetic energy of the trapped electrons, of . To develop a value of = 17 keV (the low-energy electron cut-off) from a thermal loop distribution of 1.3 keV (the typical thermal energy of the hot plasma) would require , rather a high value. However, lower values of could result in acceleration of part of the Maxwellian tail, still giving significant non-thermal fluxes, while continuing pulsations with a timescale not too different from the collision timescale can lead to further acceleration even once the collapse has stopped (Kuijpers et al., 1997). Alternatively, or more likely acting along with the mechanisms above, the compression of the loop would alter the magnetic trapping conditions by modulating the mirror ratio and hence the precipitation rate of electrons into the chromosphere (Zaitsev and Stepanov, 1982).
4. Conclusions
Many studies now, as cited above, have detected contracting motions in the corona during solar flares that can be interpreted as the implosion necessary to release energy. Our results confirm this behaviour in a particularly well-observed flare, SOL2012-03-09, noting the close time association between the collapsing coronal loops and impulsive phase of the flare. We have added to the phenomenology by noting the presence of oscillatory variations revealed by GOES soft X-rays (cf. Dolla et al., 2012), and have argued that these result from eigenstates excited by the implosion and containing compressive motions. We speculate that the existence of such persistent large-scale motions in the strong-field core of an active region could play a role in medium-term (minutes) energy storage for a solar flare. Our analysis can be summarised as follows:
1) The EUV observations shows at least four groups of coronal loops at different heights overlying the flaring core undergoing fast contraction during the impulsive phase of the flare. There are clear variations of period with the location of the oscillatory loops within the active region, with higher/longer loops having longer periods. Also there is a clear outward motion through this structure of an exciter with a projected velocity of 300 km s-1. This driver is possibly associated with an EUV wave and/or a CME launch, both identified in this event. After the passage of this driver a large portion of the corona over the AR dims out, suggesting that the coronal plasma was removed by the CME. This sequence (implosion, excitation wave, and oscillation) has been previously reported (e.g. Gosain, 2012), and we do not think that it is uncommon (Liu et al., 2009; Joshi et al., 2009; Liu and Wang, 2009, 2010; Liu et al., 2012). We interpret the coronal implosion as a lack of magnetic support as consequence of the energy release from the magnetic field (e. g. Hudson, 2000). Such changes are entirely consistent with the observed stepwise changes in the photospheric magnetic field (Wang et al., 1994; Sudol and Harvey, 2005), with the overall energy balance of the flaring active region, and with the Alfvénic transport of energy in the impulsive phase (Fletcher and Hudson, 2008; Russell and Fletcher, 2013).
2) The contraction of the magnetic structure starts around a minute after the flare onset, and the rate of contraction is closely associated with the intensity of the HXR and microwave emissions. Highly-sheared chromospheric ribbons shift in position during the flare, with coronal loops connecting the ribbons expanding and reducing their shear state. High-energy HXR footpoints are very well associated with the ribbons, and follow their motions, and a low-energy HXR (thermal) source is in excellent agreement with the flaring coronal loops shown by EUV images. The HXR footpoint sources (seen in this case also in microwave observations) reveal large concentrations of energy release in the lower solar atmosphere, with magnitude (erg) consistent with the thermal energy input (erg) into the flaring core after considering conduction (erg) and radiative (erg) losses, to sustain the net thermal energy derived from observation (erg). These observations are comprehensive, and fully support the accepted hypothesis of large-scale magnetic restructuring powering the several forms of energy release.
3) Pulsations in GOES and spatially integrated AIA data impose changes in temperature and/or density in the flaring loops. We interpret these pulsations basically as signatures of the complicated compressive eigenstates of the active-region magnetic structure, noting that such eigenstates may be excited even outside flare times (Nisticò et al., 2013), and seen both in relatively hot or cold coronal loop systems at thermal energies (White et al., 2012). We have made a first crude estimate of the energy stored in the eigenmodes based on the thermal energy of the hot plasma, but only as a lower limit. We found an average energy of erg over the main flare (03:38–03:48 UT), less than 1% of the thermal energy. Moreover, such oscillations could change/modulate the rate of acceleration, rate of precipitation and/or force new acceleration directly (e.g. Nakariakov and Melnikov, 2009; Kallunki and Pohjolainen, 2012), explaining the HXR pulsations detected at roughly the same period as the SXR and EUV pulsations. We speculate on whether these compressive oscillations could be caused by the force balance after the fast magnetic implosion. However, we do not perform a coronal magnetoseismology analysis as it is beyond the scope of this work.
References
- Banerjee et al. [2007] D. Banerjee, R. Erdélyi, R. Oliver, and E. O’Shea. Present and Future Observing Trends in Atmospheric Magnetoseismology. Sol. Phys., 246:3–29, November 2007. 10.1007/s11207-007-9029-z.
- Bogachev and Somov [2005] S. A. Bogachev and B. V. Somov. Comparison of the Fermi and Betatron Acceleration Efficiencies in Collapsing Magnetic Traps. Astronomy Letters, 31:537–545, August 2005. 10.1134/1.2007030.
- Bogachev and Somov [2007] S. A. Bogachev and B. V. Somov. Formation of power-law electron spectra in collapsing magnetic traps. Astronomy Letters, 33:54–62, January 2007. 10.1134/S1063773707010070.
- Brown and Hoyng [1975] J. C. Brown and P. Hoyng. Betatron acceleration in a large solar hard X-ray burst. ApJ, 200:734–746, September 1975. 10.1086/153845.
- Chiu [1970] Y. T. Chiu. Theory of Solar Radio Pulsation. Sol. Phys., 13:420–443, August 1970. 10.1007/BF00153561.
- De Moortel [2005] I. De Moortel. An overview of coronal seismology. Royal Society of London Philosophical Transactions Series A, 363:2743–2760, December 2005. 10.1098/rsta.2005.1665.
- De Moortel and Nakariakov [2012] I. De Moortel and V. M. Nakariakov. Magnetohydrodynamic waves and coronal seismology: an overview of recent results. Royal Society of London Philosophical Transactions Series A, 370:3193–3216, July 2012. 10.1098/rsta.2011.0640.
- Dolla et al. [2012] L. Dolla, C. Marqué, D. B. Seaton, T. Van Doorsselaere, M. Dominique, D. Berghmans, C. Cabanas, A. De Groof, W. Schmutz, A. Verdini, M. J. West, J. Zender, and A. N. Zhukov. Time Delays in Quasi-periodic Pulsations Observed during the X2.2 Solar Flare on 2011 February 15. ApJ, 749:L16, April 2012. 10.1088/2041-8205/749/1/L16.
- Edwin and Roberts [1983] P. M. Edwin and B. Roberts. Wave propagation in a magnetic cylinder. Sol. Phys., 88:179–191, October 1983. 10.1007/BF00196186.
- Fletcher and Hudson [2008] L. Fletcher and H. S. Hudson. Impulsive Phase Flare Energy Transport by Large-Scale Alfvén Waves and the Electron Acceleration Problem. ApJ, 675:1645–1655, March 2008. 10.1086/527044.
- Forbes and Acton [1996] T. G. Forbes and L. W. Acton. Reconnection and Field Line Shrinkage in Solar Flares. ApJ, 459:330–+, March 1996. 10.1086/176896.
- Goossens et al. [2009] M. Goossens, J. Terradas, J. Andries, I. Arregui, and J. L. Ballester. On the nature of kink MHD waves in magnetic flux tubes. A&A, 503:213–223, August 2009. 10.1051/0004-6361/200912399.
- Gosain [2012] S. Gosain. Evidence for Collapsing Fields in the Corona and Photosphere during the 2011 February 15 X2.2 Flare: SDO/AIA and HMI Observations. ApJ, 749:85, April 2012. 10.1088/0004-637X/749/1/85.
- Handy et al. [1999] B. N. Handy, L. W. Acton, C. C. Kankelborg, C. J. Wolfson, D. J. Akin, M. E. Bruner, R. Caravalho, R. C. Catura, R. Chevalier, D. W. Duncan, C. G. Edwards, C. N. Feinstein, S. L. Freeland, F. M. Friedlaender, C. H. Hoffmann, N. E. Hurlburt, B. K. Jurcevich, N. L. Katz, G. A. Kelly, J. R. Lemen, M. Levay, R. W. Lindgren, D. P. Mathur, S. B. Meyer, S. J. Morrison, M. D. Morrison, R. W. Nightingale, T. P. Pope, R. A. Rehse, C. J. Schrijver, R. A. Shine, L. Shing, K. T. Strong, T. D. Tarbell, A. M. Title, D. D. Torgerson, L. Golub, J. A. Bookbinder, D. Caldwell, P. N. Cheimets, W. N. Davis, E. E. Deluca, R. A. McMullen, H. P. Warren, D. Amato, R. Fisher, H. Maldonado, and C. Parkinson. The transition region and coronal explorer. Sol. Phys., 187:229–260, July 1999. 10.1023/A:1005166902804.
- Hao et al. [2012] Q. Hao, Y. Guo, Y. Dai, M. D. Ding, Z. Li, X. Y. Zhang, and C. Fang. Understanding the white-light flare on 2012 March 9: evidence of a two-step magnetic reconnection. A&A, 544:L17, August 2012. 10.1051/0004-6361/201219941.
- Hudson [2000] H. S. Hudson. Implosions in Coronal Transients. ApJ, 531:L75–L77, March 2000. 10.1086/312516.
- Hudson and Warmuth [2004] H. S. Hudson and A. Warmuth. Coronal Loop Oscillations and Flare Shock Waves. ApJ, 614:L85–L88, October 2004. 10.1086/425314.
- Ji et al. [2007] H. Ji, G. Huang, and H. Wang. The Relaxation of Sheared Magnetic Fields: A Contracting Process. ApJ, 660:893–900, May 2007. 10.1086/513017.
- Joshi et al. [2009] B. Joshi, A. Veronig, K.-S. Cho, S.-C. Bong, B. V. Somov, Y.-J. Moon, J. Lee, P. K. Manoharan, and Y.-H. Kim. Magnetic Reconnection During the Two-phase Evolution of a Solar Eruptive Flare. ApJ, 706:1438–1450, December 2009. 10.1088/0004-637X/706/2/1438.
- Kallunki and Pohjolainen [2012] J. Kallunki and S. Pohjolainen. Radio Pulsating Structures with Coronal Loop Contraction. Sol. Phys., 280:491–507, October 2012. 10.1007/s11207-012-0003-z.
- Kuijpers et al. [1997] J. Kuijpers, L. Fletcher, M. Abada-Simon, K. D. Horne, M. A. Raadu, G. Ramsay, and D. Steeghs. Magnetic pumping in the cataclysmic variable AE Aquarii. A&A, 322:242–255, June 1997.
- Lin et al. [2002] R. P. Lin, B. R. Dennis, G. J. Hurford, et al. The Reuven Ramaty High-Energy Solar Spectroscopic Imager (RHESSI). Sol. Phys., 210:3–32, November 2002. 10.1023/A:1022428818870.
- Liu and Wang [2009] R. Liu and H. Wang. Coronal Implosion and Particle Acceleration in the Wake of a Filament Eruption. ApJ, 703:L23–L28, September 2009. 10.1088/0004-637X/703/1/L23.
- Liu and Wang [2010] R. Liu and H. Wang. Fast Contraction of Coronal Loops at the Flare Peak. ApJ, 714:L41–L46, May 2010. 10.1088/2041-8205/714/1/L41.
- Liu et al. [2009] R. Liu, H. Wang, and D. Alexander. Implosion in a Coronal Eruption. ApJ, 696:121–135, May 2009. 10.1088/0004-637X/696/1/121.
- Liu et al. [2012] R. Liu, C. Liu, T. Török, Y. Wang, and H. Wang. Contracting and Erupting Components of Sigmoidal Active Regions. ApJ, 757:150, October 2012. 10.1088/0004-637X/757/2/150.
- Liu et al. [2004] W. Liu, Y. W. Jiang, S. Liu, and V. Petrosian. RHESSI Observations of a Simple Large X-Ray Flare on 2003 November 3. ApJ, 611:L53–L56, August 2004. 10.1086/423371.
- Mariska [2006] J. T. Mariska. Characteristics of Solar Flare Doppler-Shift Oscillations Observed with the Bragg Crystal Spectrometer on Yohkoh. ApJ, 639:484–494, March 2006. 10.1086/499296.
- Meegan et al. [2009] C. Meegan, G. Lichti, P. N. Bhat, E. Bissaldi, M. S. Briggs, V. Connaughton, R. Diehl, G. Fishman, J. Greiner, A. S. Hoover, A. J. van der Horst, A. von Kienlin, R. M. Kippen, C. Kouveliotou, S. McBreen, W. S. Paciesas, R. Preece, H. Steinle, M. S. Wallace, R. B. Wilson, and C. Wilson-Hodge. The Fermi Gamma-ray Burst Monitor. ApJ, 702:791–804, September 2009. 10.1088/0004-637X/702/1/791.
- Nakajima et al. [1985] H. Nakajima, H. Sekiguchi, M. Sawa, K. Kai, and S. Kawashima. The radiometer and polarimeters at 80, 35, and 17 GHz for solar observations at Nobeyama. PASJ, 37:163–170, 1985.
- Nakajima et al. [1994] H. Nakajima, M. Nishio, S. Enome, K. Shibasaki, T. Takano, Y. Hanaoka, C. Torii, H. Sekiguchi, T. Bushimata, S. Kawashima, N. Shinohara, Y. Irimajiri, H. Koshiishi, T. Kosugi, Y. Shiomi, M. Sawa, and K. Kai. The Nobeyama radioheliograph. IEEE Proceedings, 82:705–713, May 1994.
- Nakariakov and Melnikov [2009] V. M. Nakariakov and V. F. Melnikov. Quasi-Periodic Pulsations in Solar Flares. Space Sci. Rev., 149:119–151, December 2009. 10.1007/s11214-009-9536-3.
- Nakariakov and Verwichte [2005] V. M. Nakariakov and E. Verwichte. Coronal Waves and Oscillations. Living Reviews in Solar Physics, 2:3, July 2005. 10.12942/lrsp-2005-3.
- Neupert [1968] W. M. Neupert. Comparison of Solar X-Ray Line Emission with Microwave Emission during Flares. ApJ, 153:L59, July 1968. 10.1086/180220.
- Nisticò et al. [2013] G. Nisticò, V. M. Nakariakov, and E. Verwichte. Decaying and decayless transverse oscillations of a coronal loop. A&A, 552:A57, April 2013. 10.1051/0004-6361/201220676.
- Pesnell et al. [2012] W. D. Pesnell, B. J. Thompson, and P. C. Chamberlin. The Solar Dynamics Observatory (SDO). Sol. Phys., 275:3–15, January 2012. 10.1007/s11207-011-9841-3.
- Reznikova et al. [2009] V. E. Reznikova, V. F. Melnikov, K. Shibasaki, S. P. Gorbikov, N. P. Pyatakov, I. N. Myagkova, and H. Ji. 2002 August 24 Limb Flare Loop: Dynamics of Microwave Brightness Distribution. ApJ, 697:735–746, May 2009. 10.1088/0004-637X/697/1/735.
- Reznikova et al. [2010] V. E. Reznikova, V. F. Melnikov, H. Ji, and K. Shibasaki. Dynamics of the Flaring Loop System of 2005 August 22 Observed in Microwaves and Hard X-rays. ApJ, 724:171–181, November 2010. 10.1088/0004-637X/724/1/171.
- Russell and Fletcher [2013] A. J. B. Russell and L. Fletcher. Propagation of Alfvénic Waves from Corona to Chromosphere and Consequences for Solar Flares. ApJ, 765:81, March 2013. 10.1088/0004-637X/765/2/81.
- Schrijver et al. [2002] C. J. Schrijver, M. J. Aschwanden, and A. M. Title. Transverse oscillations in coronal loops observed with TRACE I. An Overview of Events, Movies, and a Discussion of Common Properties and Required Conditions. Sol. Phys., 206:69–98, March 2002. 10.1023/A:1014957715396.
- Simões and Costa [2006] P. J. A. Simões and J. E. R. Costa. Solar bursts gyrosynchrotron emission from three-dimensional sources. A&A, 453:729–736, July 2006. 10.1051/0004-6361:20054665.
- Sudol and Harvey [2005] J. J. Sudol and J. W. Harvey. Longitudinal Magnetic Field Changes Accompanying Solar Flares. ApJ, 635:647–658, December 2005. 10.1086/497361.
- Sui and Holman [2003] L. Sui and G. D. Holman. Evidence for the Formation of a Large-Scale Current Sheet in a Solar Flare. ApJ, 596:L251–L254, October 2003. 10.1086/379343.
- Sun et al. [2012] X. Sun, J. T. Hoeksema, Y. Liu, T. Wiegelmann, K. Hayashi, Q. Chen, and J. Thalmann. Evolution of Magnetic Field and Energy in a Major Eruptive Active Region Based on SDO/HMI Observation. ApJ, 748:77, April 2012. 10.1088/0004-637X/748/2/77.
- Tandberg-Hanssen and Emslie [2009] E. Tandberg-Hanssen and A. G. Emslie. The Physics of Solar Flares. July 2009.
- Van Doorsselaere et al. [2008] T. Van Doorsselaere, V. M. Nakariakov, and E. Verwichte. Detection of Waves in the Solar Corona: Kink or Alfvén? ApJ, 676:L73–L75, March 2008. 10.1086/587029.
- Van Doorsselaere et al. [2011] T. Van Doorsselaere, A. De Groof, J. Zender, D. Berghmans, and M. Goossens. LYRA Observations of Two Oscillation Modes in a Single Flare. ApJ, 740:90, October 2011. 10.1088/0004-637X/740/2/90.
- Veronig et al. [2006] A. M. Veronig, M. Karlický, B. Vršnak, M. Temmer, J. Magdalenić, B. R. Dennis, W. Otruba, and W. Pötzi. X-ray sources and magnetic reconnection in the X3.9 flare of 2003 November 3. A&A, 446:675–690, February 2006. 10.1051/0004-6361:20053112.
- Wang et al. [1994] H. Wang, M. W. Ewell, Jr., H. Zirin, and G. Ai. Vector magnetic field changes associated with X-class flares. ApJ, 424:436–443, March 1994. 10.1086/173901.
- Wang et al. [2002] T. Wang, S. K. Solanki, W. Curdt, D. E. Innes, and I. E. Dammasch. Doppler Shift Oscillations of Hot Solar Coronal Plasma Seen by SUMER: A Signature of Loop Oscillations? ApJ, 574:L101–L104, July 2002. 10.1086/342189.
- Wang et al. [2003] T. J. Wang, S. K. Solanki, W. Curdt, D. E. Innes, I. E. Dammasch, and B. Kliem. Hot coronal loop oscillations observed with SUMER: Examples and statistics. A&A, 406:1105–1121, August 2003. 10.1051/0004-6361:20030858.
- White et al. [2012] R. S. White, E. Verwichte, and C. Foullon. First observation of a transverse vertical oscillation during the formation of a hot post-flare loop. A&A, 545:A129, September 2012. 10.1051/0004-6361/201219856.
- Wilhelm et al. [1995] K. Wilhelm, W. Curdt, E. Marsch, U. Schühle, P. Lemaire, A. Gabriel, J.-C. Vial, M. Grewing, M. C. E. Huber, S. D. Jordan, A. I. Poland, R. J. Thomas, M. Kühne, J. G. Timothy, D. M. Hassler, and O. H. W. Siegmund. SUMER - Solar Ultraviolet Measurements of Emitted Radiation. Sol. Phys., 162:189–231, December 1995. 10.1007/BF00733430.
- Zaitsev and Stepanov [1982] V. V. Zaitsev and A. V. Stepanov. On the Origin of the Hard X-Ray Pulsations during Solar Flares. Soviet Astronomy Letters, 8:132–134, April 1982.