The state of globular clusters at birth: emergence from the gas-embedded phase
Abstract
In this paper, we discuss the origin of the observed correlation between cluster concentration c and present-day mass function (PDMF) slope reported by De Marchi, Paresce & Pulone. This relation can either be reproduced from universal initial conditions combined with some dynamical mechanism(s) that alter(s) the cluster structure and mass function over time, or it must arise early on in the cluster lifetime, such as during the gas-embedded phase of cluster formation. Using a combination of Monte Carlo and -body models for globular cluster evolution performed with the MOCCA and NBODY6 codes, respectively, we explore a number of dynamical mechanisms that could affect the observed relation.
For the range of initial conditions considered here, our results are consistent with an universal initial binary fraction 10% (which does not, however, preclude 100%) and an universal initial stellar mass function resembling the standard Kroupa distribution. Most of the dispersion observed in the c- relation can be attributed to two-body relaxation and Galactic tides. However, dynamical processes alone could not have reproduced the dispersion in concentration, and we require at least some correlation between the initial concentration and the total cluster mass. We argue that the origin of this trend could be connected to the gas-embedded phase of cluster evolution.
keywords:
globular clusters: general – celestial mechanics – stars: formation – methods: numerical – methods: N-body simulations – Galaxy: kinematics and dynamics.1 Introduction
De Marchi, Paresce & Pulone (2007) showed that Milky Way (MW) globular clusters (GCs) exhibit a correlation between the logarithmic ratio of their tidal and core radii, called the concentration parameter log(), and the slope of the low-mass stellar global mass function (MF) . That is, high concentration clusters tend to have steep MFs, while low concentration clusters tend to have flat MFs. The authors posited that this goes against the naive expectation that it is solely two-body relaxation that drives the evolution of both the concentration and the MF slope. In particular, two-body relaxation causes the preferential evaporation of low-mass stars across the tidal boundary, while at the same time driving clusters toward a state of higher central density (e.g. Spitzer, 1987; Heggie & Hut, 2003). It follows that more concentrated clusters should be more severely depleted of preferentially low-mass stars and have a shallower MF than low-concentration clusters. This is precisely the opposite of what was found by De Marchi, Paresce & Pulone (2007) for a sample of 20 MW GCs. Clearly, the observed correlation between concentration and MF slope is puzzling.
Several authors have suggested mechanisms to explain this curious trend. De Marchi, Paresce & Pulone (2007) offered that GCs severely depleted of their low-mass stars underwent core collapse some time in the past, and have since recovered a normal radial density profile. However, this cannot explain the high concentrations observed in very massive clusters. Alternatively, Marks, Kroupa & Baumgardt (2008) suggested that the observed correlation could be due to residual gas explusion from initially mass segregated clusters, combined with the effects of unresolved binaries. The authors argued that extreme gas expulsion could produce clusters with low central densities, and hence low concentrations, and flat PDMFs at the low-mass end. Studying the interplay between the stellar initial mass function (IMF), concentration, and gas retention plays a crucial role in understanding the origins of star clusters in the Milky Way. For example, this approach leads to constraints on the sequence of events during the early evolution of the proto-Galaxy (Marks & Kroupa, 2010), on the variation of the IMF in star bursts (Marks et al., 2012) and on the initial mass-radius relation of star clusters (Murray, 2009; Marks & Kroupa, 2012), and on the observed distribution of GC metallicities (Marks & Kroupa, 2010).
Leigh et al. (2012) showed that the cluster-to-cluster variations observed in the PDMFs of MW GCs are consistent with what is expected if GCs were born with a universal initial mass function (IMF), and two-body relaxation is the dominant physical process driving the evolution of the MF. In other words, the power-law index of the central MF increases (i.e. the MF flattens) smoothly with decreasing cluster mass. This is what is expected from two-body relaxation, since it segregates low-mass stars to the outskirts where they escape from the cluster across the tidal boundary, and it operates with a rate that increases with decreasing cluster mass. This suggests that whatever mechanism is responsible for the observed correlation between and , it should have primarily affected the cluster concentration relative to what is expected from two-body relaxation alone, as opposed to the slope of the MF . Said another way, if two-body relaxation is the only mechanism driving the internal evolution of clusters, then the expected dependence of on the total cluster mass is roughly consistent with what is observed.111This assumes that all clusters were born with similar initial mass functions, and is based on the central stellar MF, which is relatively insensitive to the effects of Galactic tides. This is not the case for the cluster concentration, however.
Other observational correlations have been reported for MW GCs, some of which are arguably also consistent with the general picture that GCs were born with approximately universal initial conditions and evolved via dynamics to their present-day forms. For example, Milone et al. (2012) recently performed a detailed study of the properties of main-sequence binaries in a sample of 59 GCs. The authors confirmed a previously reported (Sollima et al., 2007) anti-correlation between the binary fraction and the total cluster mass. Sollima (2008) showed via analytic methods that such an anti-correlation can arise naturally assuming an universal initial binary fraction that is independent of cluster mass. This can be explained by the disruption of binaries in the cluster core, combined with the evaporation of single stars from the cluster outskirts (e.g. Fregeau, Ivanova & Rasio, 2009). The efficiency of the former should increase with increasing cluster density (Marks, Kroupa & Oh, 2011) and hence mass, whereas the efficiency of the latter is driven by two-body relaxation and should increase with decreasing cluster mass. This contributes to high binary fractions in low-mass clusters, and low binary fractions in high-mass clusters. Notwithstanding, Sollima (2008) cautioned that, based on existing observations of binary fractions in Galactic GCs, the data is also consistent with significant variations among the initial binary properties. This would, however, contradict the well-motivated universality hypothesis (Kroupa, 2011).
In this paper, we argue that the origin of the observed distribution of concentration parameters in GCs must be connected to the gas-embedded phase of cluster formation. The alternative is that globular clusters emerged from the embedded phase with universal initial conditions, and evolved via dynamics to their presently observed MFs and structural parameters. We perform a suite of numerical simulations for comparison to the observed c- relation, varying the initial conditions in each model in order to identify those that yield the best agreement with the observations at the present-day cluster age. We also compare the simulated distribution of binary fractions as a function of the total cluster luminosity to the observed relation of Milone et al. (2012) in an effort to constrain to first-order the universality of the initial binary fraction in GCs.
We begin by considering in Section 2 different initial conditions that could affect the evolution of the MF slope and/or the concentration parameter. In Section 3, we describe the specific initial conditions we consider, as well as the Monte Carlo and -body models used to simulate the cluster evolution. We present our results in Section 4 and, based on these results, we argue in Section 5 that dynamics alone could not have reproduced the observed relation. This implies that the observed relation must have originated very early on in the cluster lifetime, when gas was still present in significant quantities. Hence, we discuss the various mechanisms that could have contributed to the observed distribution of concentration parameters during the gas-embedded phase, and constrain the necessary conditions. We conclude in Section 6.
2 Dynamical mechanisms affecting the - relation
In this section, we consider several different dynamical mechanisms that could affect the evolution of the MF slope and/or the cluster concentration. We further describe the initial conditions for which each of these mechanisms should contribute to the observed c- relation.
2.1 Binary stars
2.1.1 Soft binaries
Soft binaries are characterized by their orbital energy, which must have an absolute value that is less than the average single star kinetic energy. This inequality gives (Heggie, 1975):
| (1) |
where asoft denotes the semi-major axis of a soft binary, is the average stellar mass, and is the velocity dispersion. If a soft binary experiences a direct encounter with a single star, the total energy of such an encounter is positive, and the binary will likely be disrupted. Thus, on average, the disruption of a soft binary by a single star serves to reduce the interloper’s speed, and hence kinetic energy.
If enough soft binaries are disrupted, this could affect the distribution of stellar velocities in a cluster. The cooling of a cluster through binary star disruption was first demonstrated by Kroupa, Petr & McCaughrean (1999). More recently, Fregeau, Ivanova & Rasio (2009) showed that the initial energy in soft binaries can be up to 10% of the total mechanical energy of a cluster. The authors argued that this is a sufficiently significant energy sink to drive a typical MW GC to core collapse. The disruption of soft binaries also causes a decrease in the binary fraction, not only due to the destruction of binaries but also due to the increase in single stars. This sudden increase in the number of single stars further contributes to increasing the relaxation time by increasing the total number of objects and decreasing the average object mass. Having said that, most soft binaries are disrupted very early on in the cluster lifetime, when massive stars are still present. The stellar evolution-driven mass loss from massive stars contributes to heating the core, causing the core radius to expand. The question is: does this tend to outweigh the energy sink provided by soft binaries, so that their disruption only serves to slow the expansion of the core?
The semi-major axis corresponding to the hard-soft boundary decreases with increasing cluster mass, since the velocity dispersion increases with increasing cluster mass (see Equation 1). Thus, assuming an universal initial binary fraction that is independent of the cluster mass, more massive clusters have more soft binaries initially (Kroupa, 1995; Marks, Kroupa & Oh, 2011). It follows that the efficiency of soft binary disruption as an energy sink should increase with increasing cluster mass. In other words, for a universal initial binary fraction and orbital parameter distributions, the disruption of soft binaries should contribute to a correlation between the total cluster mass and the concentration parameter, as observed.
2.1.2 Hard binaries
Hard binaries, for which the absolute value of the orbital energy exceeds the average kinetic energy of a single star, can also influence the central concentration via “binary burning” (e.g. Fregeau, Ivanova & Rasio, 2009). In this case, the central density is sufficiently high that even very close binaries, for which the collisional cross-section is small, frequently undergo dynamical interactions with single stars. Here, the binary imparts additional kinetic energy to the escaping single star, becoming even harder in the process (Heggie, 1975). Thus, hard binaries can act as heat sources in clusters with sufficiently high central densities, slowing and even reversing the tendency toward core collapse (e.g. Heggie & Hut, 2003).
For a given binary fraction, low-mass clusters should contain the largest number of hard binaries, since the hard-soft boundaries in these clusters correspond to large orbital separations. Hence, core expansion driven by hard binary burning should also contribute to a correlation between the cluster mass and concentration. Fregeau, Ivanova & Rasio (2009) argued that most Milky Way GCs have not yet reached sufficiently high central densities to enter the binary burning phase of evolution, although the authors assumed that the concentration was lower in the past and that it has been increasing steadily over time. Clusters with very high initial concentrations, on the other hand, are more likely to undergo binary burning early on, and this can contribute to decreasing the concentration parameter (Heggie & Giersz, 2008, 2009).
2.2 Cluster expansion in a tidal field
Star clusters expand self-similarly in a tidal field (Gieles, Heggie & Zhao, 2011). This contributes to decreasing the concentration parameter or, more accurately, reducing the rate at which the concentration increases due to two-body relaxation. This effect occurs in clusters that are initially tidally under-filling, since they have room to expand and experience a long delay before losing mass across the tidal boundary. Once a cluster fills its tidal radius, it experiences a steady increase in its concentration as the core radius shrinks due to two-body relaxation.
Assuming a universal distribution of initial cluster sizes, it is the most massive clusters that should expand the most in an under-filled tidal field, since they have the largest tidal radii. A useful, albeit simplistic (Webb, Sills & Harris, 2012; Webb et al., 2013), approximation for the tidal radius is (von Hoerner, 1957):
| (2) |
where is the Galactocentric distance of the cluster assuming a circular orbit, is the cluster mass, and is the mass of the Galaxy, which here we assume to be a point mass.
Two-body relaxation acts to move lower mass stars outward to the cluster outskirts, where they preferentially escape across the tidal boundary. A cluster that experiences a stronger tidal field will undergo a more rapid stripping of its low-mass stars, due to the deeper potential in which the cluster sits and also the fact that a stronger tidal field translates into a smaller tidal radius. As the cluster loses mass, the process is accelerated, since the tidal radius decreases and the rate of two-body relaxation increases. For clusters with small Galactocentric distances, this can even result in an inversion of the mass function, so that its slope changes sign (Vesperini & Heggie, 1997; Baumgardt & Makino, 2003).
Tidal heating acts only on clusters with eccentric orbits, since a non-static tidal field implies that the depth of the gravitational potential is periodic, and additional energy is deposited within the stellar population with each perigalactic pass. This accelerates the rate of escape of preferentially low-mass stars across the tidal boundary. This is because low-mass stars in the outskirts have the lowest binding energies, so the additional energy accelerates these stars to speeds that exceed the escape velocity, at which point they have a positive total energy and become unbound. Overall, the net effect of tidal heating is to accelerate stars, causing an expansion of the cluster and its more rapid dissolution. Importantly, the mean mass loss per unit time due to external perturbations from the Galaxy are independent of cluster mass (Gieles et al., 2006; Gieles, Athanassoula & Portegies Zwart, 2007). Thus, tidal heating should contribute to the observed dependence of mass function slope on concentration, since, for a given orbit, it should produce more extended clusters with shallower MF slopes for smaller initial cluster masses, in agreement with the observations.
2.3 Initial stellar and remnant mass functions
The initial mass function can affect the evolution of the cluster structure in a number of ways. For example, for a given cluster mass, the initial mass function determines both the total number of stars and the average stellar mass, and hence the rate of two-body relaxation. Mass loss due to stellar evolution tends to cause clusters to expand (e.g. Chernoff & Weinberg, 1990). Thus, clusters with a top-heavy initial mass function should expand more due to stellar evolution than clusters with a bottom-heavy initial mass function, since the former includes a larger fraction of massive stars. A top-heavy IMF should also generate more stellar remnants early on in the cluster lifetime, since the stellar lifetime decreases with increasing stellar mass.
Stellar remnants, including white dwarfs, neutron stars and black holes, represent an unseen component of globular clusters. Assuming a standard initial mass function (Kroupa, 2002), they could constitute a substantial fraction of the total cluster mass at an age of Gyr (e.g. Leigh et al., 2013). More importantly, remnants make up a much larger fraction of the core mass, since they are primarily confined to the central cluster region. This is because, at the time of their formation, stellar remnants descend from the most massive stars in the cluster, which have typically migrated into the core via mass segregation by the time of their death, if they did not form their in the first place. Even in very massive clusters for which the rate of two-body relaxation and hence mass segregation is slower, remnants that do not form in the core will still quickly migrate there via two-body relaxation since, after a few hundred Myr, they are the most massive objects in the cluster.
Given that they represent a significant, but unseen, mass component within the core, stellar remnants can have an important bearing on the concentration parameter. In particular, remnants should act as an additional heat source within the core, and we expect this to contribute to an increase in the core radius, and hence a decrease in the concentration parameter (e.g. Mackey et al., 2007, 2008; Sippel & Hurley, 2013).
Stellar remnants could contribute (weakly) to the observed c- relation. This is because, for a larger cluster mass, more massive stars are more likely to be selected from random sampling, and there is evidence that the maximum IMF mass increases with increasing cluster mass (Kroupa et al., 2013). More massive stars implies more massive remnants, which are more effective at heating the core, and hence lowering the concentration. It follows that, for a given IMF, stellar remnants could be more effective heat sources in more massive clusters, contributing to an anti-correlation between the cluster mass and concentration. Thus, although the data are consistent with a universal IMF in Milky Way globular clusters (e.g. De Marchi, Paresce & Portegies Zwart, 2010; Paust et al., 2010; Kroupa et al., 2013; Leigh et al., 2012), the stellar IMF could compete against the observed c- relation indirectly via stellar remnants. We do not expect this effect to typically be significant, however, given its stochastic nature, as reflected in the construction of the IMF via random sampling.
One interesting example that depends sensitively on the initial stellar and remnant mass functions involves the formation of an intermediate-mass black hole (IMBH). An IMBH can form from the runaway collisions of massive stars very early on in the cluster lifetime (Portegies Zwart et al., 2004). The IMBH can then continue to grow via subsequent mergers, and even gas accretion mediated by binary star evolution. If an IMBH forms, its presence should contribute to increasing the core radius, and hence decreasing the concentration parameter, by accelerating stars in its immediate vicinity (e.g. Lützgendorf et al., 2011). If IMBHs in GCs follow a similar scaling law as super-massive black holes (SMBHs) in galactic nuclei (Lützgendorf et al., 2013; Kruijssen & Lützgendorf, 2013), then we would expect more massive clusters to harbour more massive IMBHs. In this case, IMBHs would contribute to a trend in which the concentration parameter decreases with increasing cluster mass, in clear disagreement with the observations.
3 Models
In this section, we describe the Monte Carlo and -body codes used to simulate the cluster evolution, and list the initial conditions we consider. We use the Monte Carlo code MOCCA to simulate the majority of our model clusters, given its fast and robust coverage of the relevant parameter space. The agreement between MOCCA and -body models is excellent for the case of static Galactic tides (Giersz et al., 2013), however MOCCA cannot treat non-static tides. Thus, we use the -body code NBODY6 to quantify the impact of Galactic tides on the observed relation, since it incorporates a realistic treatment of the Galactic potential.
3.1 Monte Carlo models: MOCCA
We use the MOCCA code to produce the majority of our simulated clusters. It combines the Monte Carlo technique for cluster evolution with the Fewbody code (Fregeau et al., 2004) to perform numerical scattering experiments of small-number gravitational interactions, and relies on the Binary Stellar Evolution (BSE) code to track both stellar and binary evolution (Hurley, Pols & Tout, 2000, 2002).
The MOCCA code offers several advantages, in particular the fast computation times required to run the simulations to completion. It also allows us to simulate clusters in regions of parameter space that are intractable with -body codes. Specifically, since it relies on Monte Carlo methods, it can simulate realistic globular clusters composed of more than a million stars, and it can do so for 12+ Gyr of cluster evolution on time-scales of hours in real-time.222The MOCCA simulations are performed on a PSK2 cluster at the Nicolaus Copernicus Astronomical Centre in Poland. Each simulation is run on one CPU. The cluster is based on AMD (Advanced Micro Devices, Inc.) Opteron processors with 64-bit architecture (2-2.4 GHz). For 12+ Gyr of GC evolution, simulations with 5 104 stars typically take 1 hour to complete, those with 3 105 stars take 10-16 hours, and those with 1.8 106 stars take 120-160 hours. The precise simulation run-time depends on the choice of initial conditions. For more detailed information about the MOCCA code, see Hypki & Giersz (2013) and Giersz et al. (2013).
3.1.1 Initial conditions
We assume a King density profile with initial concentration W. Our clusters are not mass segregated to begin with, and all models are initially tidally under-filling. The degree of under-filling is set by the parameter f rt/rh, where rt and rh are the tidal and half-mass radii, respectively. To put this parameter into context, a King model (King, 1966) with W has a ratio between the tidal and half-mass radii of f. We adopt a metallicity of for all models.
The initial conditions we consider are shown in Table 1. We vary the initial mass function, binary fraction, kick velocities for NSs and BHs upon formation, the initial-final mass relation for BHs, the total number of stars, the ratio rt/rh, and the cluster age. We run models having a total of 5 104, 105, 2 105, 3 105 or 1.8 106 stars initially. For the and cases, we also re-run identical models with the same initial conditions but different random number seeds to assess fluctuations in the final cluster state that are intrinsic to the Monte Carlo method adopted by MOCCA. Snapshots are taken at 10, 11 and 12 Gyr for all models (unless indicated otherwise).
We adopt two different IMFs, both in the form:
| (3) |
The first IMF we refer to as a standard Kroupa IMF (labeled imf1 in Table 1), as taken from Kroupa, Tout & Gilmore (1993) in the mass range 0.08 - 100 M⊙. The second IMF is a two-segment Kroupa IMF (imf2), as taken from Kroupa (2008) with a single break mass at 0.5 M⊙, and low- and high-mass slopes of +1.3 and +2.3, respectively. In addition, we consider a modified IMF (imf3; instead of the two-segment Kroupa IMF) for the and cases, with a break mass at 0.85 M⊙ and low- and high-mass slopes of +1.1 and +2.5, respectively.
For our standard model, the initial mass function adopted for the binaries is taken from Equation 1 of Kroupa, Gilmore & Tout (1991) in the mass range 0.08 to 100 M⊙, sampled with random pairing. We assume different initial binary fractions of 10%, 30%, 70% and 95%, along with different maximum orbital separations of 100 AU, 200 AU and 400 AU. The binary semi-major axis distribution is uniform in the logarithmic scale from 2(R1+R2) to 100 AU (for the standard model). The binary eccentricities follow a modified thermal distribution taken from Equation 1 of Hurley et al. (2005). We also perform simulations with the initial binary orbital parameter distributions provided in Equation 4.46 of Kroupa et al. (2013), which are derived from empirical data (labeled Kroupa13 in Table 1), in order to quantify the degree to which our assumptions for the initial binary orbital parameter distributions could affect our results.
Analytic formulae for stellar evolution are taken from Hurley, Pols & Tout (2000), and binary evolution is performed with the BSE code (Hurley, Pols & Tout, 2002). We adopt two different inital-final mass relations for BHs. The first uses the initial-final mass relation from Hurley, Pols & Tout (2000) assuming no mass fallback, and the second is the same but with mass fallback switched on (Belczynski, Kalogera & Bulik, 2002). With mass fallback switched off, we adopt either a kick velocity of 265 km/s for both NSs and BHs (kick1), or we adopt 0 km/s for BHs and 265 km/s for NSs (kick2). With mass fallback switched on, both the BH mass and kick velocity depend on the progenitor mass.
| Total Number | Time | rt | fund | Binary | amax | Model | Symbol |
|---|---|---|---|---|---|---|---|
| of Stars | (in Gyr) | (in pc) | Fraction | (in AU) | |||
| 1800000 | 10, 11, 12 | 125.33 | 60 | 10 | 100 | standard (imf1 + kick1 + fallback) | 5 pt. solid black triangle |
| no fallback | 5 pt. solid blue triangle | ||||||
| imf2 | 5 pt. solid red triangle | ||||||
| 75 | standard | 5 pt. solid black square | |||||
| no fallback | 5 pt. solid blue square | ||||||
| imf2 | 5 pt. solid red square | ||||||
| kick2 | 5 pt. solid green square | ||||||
| no fallback + imf2 | 5 pt. solid magenta square | ||||||
| kick2 + imf2 | 5 pt. solid cyan square | ||||||
| 75 | Kroupa13 | 5 pt. blue cross | |||||
| 300000 | 10, 11, 12 | 69.0 | 35 | 10 | 100 | standard | 4 pt. solid black triangle |
| no fallback | 4 pt. solid blue triangle | ||||||
| imf2 | 4 pt. solid red triangle | ||||||
| binary mass segregation | 5 pt. black cross | ||||||
| 30 | 100 | standard | 1 pt. open black square | ||||
| 200 | standard | 3 pt. open black square | |||||
| 400 | standard | 5 pt. open black square | |||||
| 38.0 | 35 | 70 | 100 | standard | 1 pt. open blue triangle | ||
| 69.0 | 35 | 70 | 100 | standard | 1 pt. open blue square | ||
| 400 | standard | 5 pt. open blue square | |||||
| 95 | 100 | standard | 1 pt. open green square | ||||
| 200 | standard | 3 pt. open green square | |||||
| 400 | standard | 5 pt. open green square | |||||
| 69.0 | 50 | 10 | 100 | standard | 4 pt. solid black square | ||
| no fallback | 4 pt. solid blue square | ||||||
| imf2 | 4 pt. solid red square | ||||||
| kick2 | 4 pt. solid green square | ||||||
| no fallback + imf2 | 4 pt. solid magenta square | ||||||
| kick2 + imf2 | 4 pt. solid green square | ||||||
| 65 | standard | 4 pt. solid black pentagon | |||||
| no fallback | 4 pt. solid blue pentagon | ||||||
| imf2 | 4 pt. solid red pentagon | ||||||
| 100 | standard | 4 pt. solid black hexagon | |||||
| no fallback | 4 pt. solid blue hexagon | ||||||
| imf2 | 4 pt. solid red hexagon | ||||||
| 135 | standard | 4 pt. solid black heptagon | |||||
| no fallback | 4 pt. solid blue heptagon | ||||||
| imf2 | 4 pt. solid red heptagon | ||||||
| 50 | Kroupa13 | 4 pt. blue cross | |||||
| 200000 | 10, 11, 12 | 69.0 | 10 | 10 | 100 | standard | 3 pt. solid black triangle |
| no fallback | 3 pt. solid blue triangle | ||||||
| imf3 | 3 pt. solid red triangle | ||||||
| 20 | standard | 3 pt. solid black square | |||||
| no fallback | 3 pt. solid blue square | ||||||
| imf3 | 3 pt. solid red square | ||||||
| 10 | Kroupa13 | 3 pt. blue cross | |||||
| 100000 | 10, 11, 12 | 69.0 | 10 | 10 | 100 | standard | 2 pt. solid black triangle |
| no fallback | 2 pt. solid blue triangle | ||||||
| imf3 | 2 pt. solid red triangle | ||||||
| 20 | standard | 2 pt. solid black square | |||||
| no fallback | 2 pt. solid blue square | ||||||
| imf3 | 2 pt. solid red square | ||||||
| 50000 | 10, 11, 12 | 37.96 | 20 | 10 | 100 | standard | 1 pt. solid black triangle |
| no fallback | 1 pt. solid blue triangle | ||||||
| imf2 | 1 pt. solid red triangle | ||||||
| 25 | standard | 1 pt. solid black square | |||||
| no fallback | 1 pt. solid blue square | ||||||
| imf2 | 1 pt. solid red square | ||||||
| kick2 | 1 pt. solid green square | ||||||
| no fallback + imf2 | 1 pt. solid magenta square | ||||||
| kick2 + imf2 | 1 pt. solid cyan square | ||||||
| 30 | standard | 1 pt. solid black pentagon | |||||
| no fallback | 1 pt. solid blue pentagon | ||||||
| imf2 | 1 pt. solid red triangle | ||||||
| 25 | Kroupa13 | 1 pt. blue cross |
3.2 -body models: NBODY6
We use the NBODY6 direct -body code (Aarseth, 2003) to evolve a series of model clusters to an age of 12 Gyr. We list here only those model assumptions directly relevant to the tidal field, and refer the reader to Webb et al. (2013) for more specific details regarding the input parameters (e.g. metallicity, binary orbital distributions, etc.). Every -body model begins with 96000 stars and 4000 binaries (i.e. an initial binary fraction of 4%)333We use the -body models to quantify the effects of Galactic tides only. Hence, for our purposes, the results are approximately insensitive to the initial binary fraction, which is the same in all models., a total initial mass of M⊙ and a half-mass radius of 6 pc, but follows a different orbit through the Galaxy. In particular, only the initial velocity changes between models, giving rise to different orbits within the Galactic potential.
To study the effect of a non-static tidal field, we simulate model clusters with orbital eccentricities of 0.5 and 0.9, each with a perigalactic distance of 6 kpc. To help quantify any differences between static and non-static tidal fields, we also simulate clusters with circular orbits at the perigalacticon and apogalacticon of each eccentric model. This produces models with circular orbits at 6 kpc, 18 kpc, and 104 kpc. Note that model names are based on orbital eccentricity (e.g. e09), and the distance at apogalacticon (e.g. r104).
The initial conditions for our -body models have been summarized in Table 2. In the column labeled ”Model”, we distinguish between simulations corresponding to different orbits by providing the eccentricity (e), and either the orbital semi-major axis (Rc) if the orbit is circular or the perigalacticon distance (Rp) if the orbit is eccentric.
| Total Number of Stars | Time (in Gyrs) | rt (in pc) | Model | Symbol | |
|---|---|---|---|---|---|
| 100000 | 12 | 40 | 6.7 | e = 0 + = 6 | solid black line |
| 100000 | 12 | 40 | 6.7 | e = 0.5 + = 6 | solid blue line |
| 100000 | 12 | 90 | 15.0 | e = 0 + = 18 | solid red line |
| 100000 | 12 | 40 | 6.7 | e = 0.9 + = 6 | solid green line |
| 100000 | 12 | 120 | 20.0 | e = 0 + = 104 | solid magenta line |
The clusters follow orbits within a Galactic potential modeled by a point-mass bulge, a Miyamoto & Nagai (1975) disk (with kpc and kpc), and a logarithmic halo potential (Xue et al., 2008), as described in Aarseth (2003) and Praagman, Hurley & Power (2010). The combined mass profiles of all three components give rise to a circular velocity of 220 km/s at a galactocentric distance of kpc. All clusters are made to orbit within the plane of the disk to eliminate the effects of tidal heating due to a non-spherically symmetric field and disc shocking.
4 Results
In this section, we present the results of our simulations for globular cluster evolution. We begin by comparing the results of all simulations to the observed distributions of concentration, MF slope, binary fraction, and integrated V-band cluster magnitude. This is done to assess the overall agreement between our models and the observations. Next, we quantify the degree to which each of the dynamical mechanisms listed in the previous section could have contributed to the observed c- relation.
In order for the comparisons to be meaningful, it is crucially important that the simulated cluster properties are calculated analogously to the observed values. In other words, it is necessary to “observe” the simulated clusters in the same way as was done for the observations. For the remainder of this paper, we calculate the concentration parameter using the cluster half-light radius instead of the tidal radius, since the latter can be ambiguous, particularly in the models, resulting in an ambiguous definition of the concentration parameter (e.g. De Marchi, Paresce & Portegies Zwart, 2010). We call this the half-light concentration parameter, denoted by . Both the core and half-light radii are calculated from the 2-D surface brightness profiles of the models, and the core radius is defined as the distance from the cluster centre at which the surface brightness falls to half its central value.
We further ensure that the mass function slope and binary fraction are consistently calculated over the range of stellar masses (0.3 - 0.8 M⊙) and binary mass ratios (q 0.5) used to derive the observed values. All fb values refer to the core binary fractions. Finally, in analogy with the observed MFs, we consider binaries as unresolved single stars in the models when calculating the MF slope, with luminosities and colours determined by the combined light of the binary components (Kroupa, Gilmore & Tout, 1991).
All models presented in this section were performed using the MOCCA code, with the exception of Section 4.2.2 for which only models performed using the NBODY6 code are presented.
4.1 Comparisons to the observed distributions
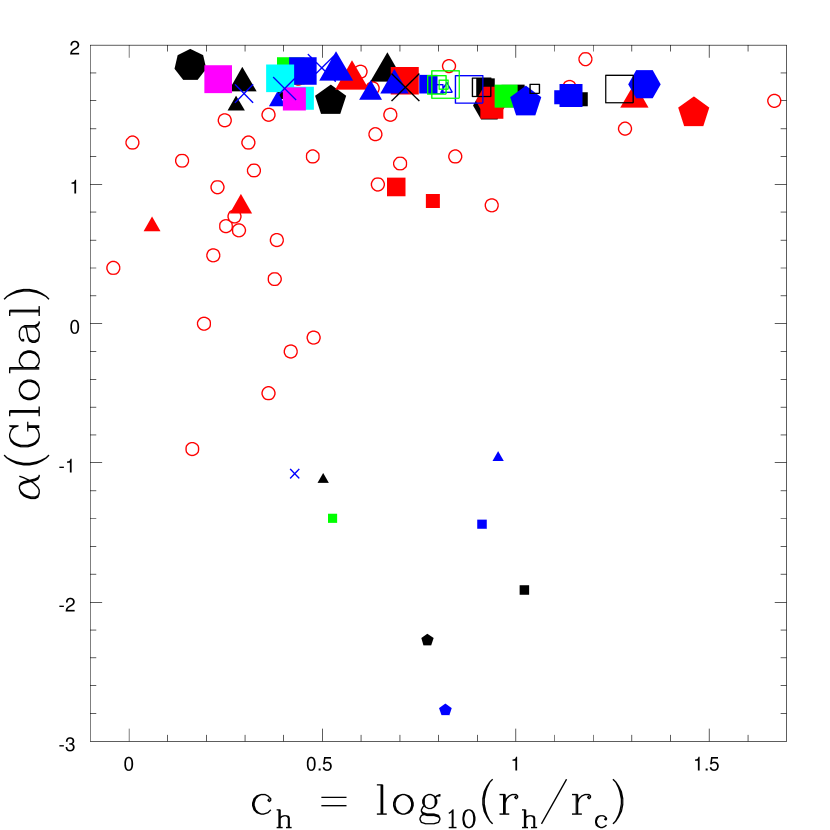
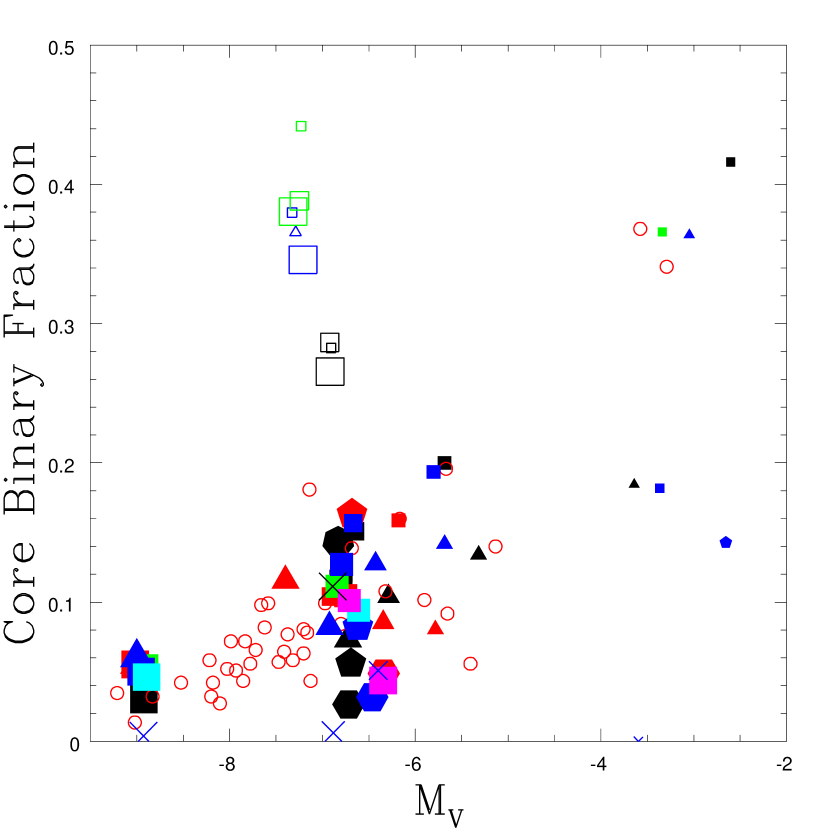
We show the results for all Monte Carlo models in Figures 1 and 2 after 12 Gyr of cluster evolution, along with the observed values for comparison. Specifically, the open red circles show the observed values taken from De Marchi, Paresce & Pulone (2007), supplemented with additional global MF slopes taken from Paust et al. (2010) for those clusters not included in the study of De Marchi, Paresce & Pulone (2007). We do not show our model results after 10 and 11 Gyr of cluster evolution to avoid over-populating Figures 2 and 1. However, if all snapshots at 10, 11 and 12 Gyr are included, which somewhat reproduces the age spread in the Milky Way GC population, the agreement with the observed distributions is slightly better, and our over-arching conclusions are unaffected.
The first plot shows in the c plane the observed values of De Marchi, Paresce & Pulone (2007) with our simulated values, whereas the second shows in the MV-fb plane the observed values of Milone et al. (2012) with our simulated values. Binary fractions apply only to the cluster core, and only to mass ratios q . Integrated V-band magnitudes MV are calculated from the final total cluster luminosity assuming M.
For the filled symbols, the different colours correspond to different assumptions pertaining to the IMF and stellar remnants. In particular, the black, red, green, blue, cyan and magenta colours correspond to the standard IMF (imf1), modified Kroupa IMF (imf2), zero BH kick velocity (kick2), no BH fallback (no fallback), modified Kroupa IMF with zero BH kick (imf2+kick2) and modified Kroupa IMF with no BH fallback (imf2+no fallback) models, respectively.
In an effort to better communicate to the reader the results presented in Figures 1 and 2, we also systematically vary the size and shape of each symbol. For the filled points and crosses, the increasing point sizes correspond to increasing initial numbers of stars, with , , , and . The initial ratio f rt/rh also increases with increasing number of sides (i.e. triangle, square, pentagon, hexagon, etc.) for symbols of a given colour (see Table 1 for the exact fund values).
The filled points correspond to models with an initial binary fraction of 10%. All open symbols (neglecting the red open circles) correspond to models with larger initial binary fractions. Specifically, the black, blue, and green open symbols correspond to initial binary fractions of 30%, 70% and 95%, respectively. All models corresponding to these open symbols adopt stars initially and a standard Kroupa IMF (imf1). For these open symbols, the increasing point sizes correspond to increasing maximum binary orbital separations, where we consider the values a 100, 200 and 400 AU. The black cross corresponds to a standard model with an initial binary fraction of 10%, but with initial binary mass segregation imposed. Finally, the blue crosses (labeled Kroupa13 in Table 1) correspond to our standard model (imf1) with an initial binary fraction of 10%, but adopting the initial binary orbital parameter distributions of Kroupa et al. (2013).
4.1.1 The observed c relation
Figure 1 shows that the simulated ranges in the concentration parameter and do not completely agree with the observations. Specifically, the models struggle to reproduce both low-concentration low- clusters and high-concentration high- clusters. Hence, if we increase (decrease) the initial concentration in all models, we will struggle to reproduce clusters with sufficiently low (high) concentrations without imposing additional assumptions (e.g. the formation of an IMBH). We struggle to reproduce sufficiently low- values in low-concentration clusters in models that assume a standard Kroupa IMF (imf1), which is the case for most of our models. As illustrated by the solid red triangles and squares in Figure 1, the agreement appears better in models that assume a two-segment Kroupa IMF (imf2), and would be better still assuming an even more bottom-heavy IMF than considered in this paper.
As shown by the smallest points in Figure 1, there is a large gap in between the models and the rest, with the models also under-predicting . This can be corrected by adopting a slightly younger age for these clusters. However, most of the models are approaching disruption at 12 Gyr, since they have lost a considerable fraction of their initial mass. Hence, the rate of escape of stars across the tidal boundary is high, as is the internal rate of two-body relaxation. At 11 Gyr, some of the clusters have low- values and low concentrations, in rough agreement with the observations. However, at 12 Gyr, all of these clusters have fully dissolved. Hence, this is a short-lived phase of the cluster evolution, lasting less than 1 Gyr. Consequently, it seems unlikely that all of the low- low-concentration clusters observed in De Marchi, Paresce & Pulone (2007) are in the process of fully dissolving.
4.1.2 The observed MV-fb relation
As is clear from Figure 2, the simulated ranges in both MV and fb are in excellent agreement with the observations for the majority of our models. This suggests that our assumed range in the distribution of initial cluster masses is in reasonable agreement with that of the initial cluster mass function for the sample of Milone et al. (2012). Additionally, for the assumed binary orbital parameter distributions adopted in this paper, the data are well-reproduced assuming an universal initial binary fraction of 10% in all clusters, independent of the cluster mass. This is supported by the fact that models with initial binary fractions 30, 70 and 95%, shown by the open squares in Figure 2, all over-predict the final binary fraction at the present cluster age. We obtain good agreement with the observations independent of whether or not we assume initial binary mass segregation (shown by the black cross in Figure 2).
Models that assume the initial binary orbital parameters distributions of Kroupa et al. (2013) and an initial binary fraction of 10%, shown by the blue crosses in Figure 2, yield final binary fractions that are lower than, but still comparable to, our other models and the observed values. This is because, for the initial cluster densities adopted in our models, a very large fraction of the initial binaries are soft, and are hence rapidly destroyed. This can be corrected by truncating the initial period distribution closer to the hard-soft boundary, so that a larger fraction of the initial binaries are hard, and hence more resilient to dynamical disruption. In this case, the distributions in Kroupa et al. (2013) would also yield good agreement to the observed binary fractions. Alternatively, the same result could be achieved by increasing the initial binary fraction, so that it is higher in denser clusters with hard-soft boundaries corresponding to very short orbital periods. In general, we are unable to rule out the possibility that other combinations of the initial binary fraction and orbital parameter distributions could also be consistent with the observations, such as the binary universality hypothesis described in Kroupa (2011). This will be the focus of a forthcoming paper.
4.2 The initial conditions
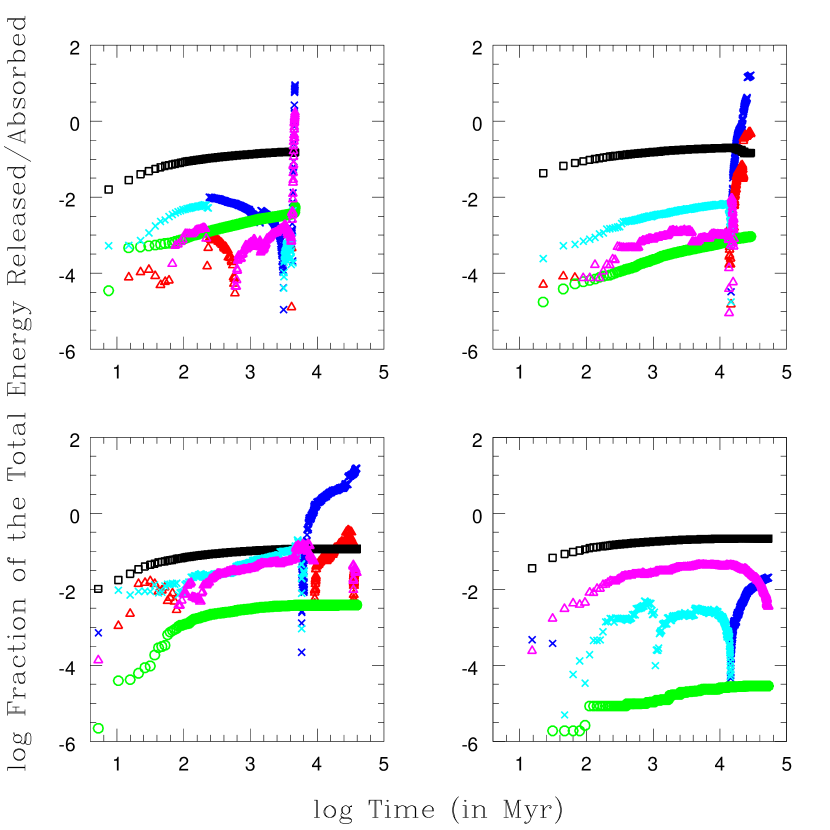
In this section, we describe how our results depend on each of the key assumptions that go into defining the initial conditions for our simulated clusters. We begin by quantifying in Figure 3 the efficiency of the various energy equipartition-driven mechanisms for cluster heating and cooling over the course of the cluster lifetime. We will refer to Figure 3 throughout the subsequent sub-sections, in which we consider these mechanisms individually in more detail, and how they affect the final half-light concentration parameter ch and MF slope .
Figure 3 shows as a function of time the degree of cluster heating due to single-binary encounters (blue crosses), binary-binary encounters (red triangles) and stellar evolution-driven mass loss (black circles), as well as the degree of cooling due to single-binary encounters (cyan crosses), binary-binary encounters (magenta triangles) and direct stellar collisions (green circles). The MOCCA code divides model clusters into radial bins. Hence, the energy released/absorbed due to heating/coolng is calculated in each bin at each time-step, summed over the entire cluster, and divided by the total initial binding energy of the cluster (excluding the internal binding energy of binaries). Time-steps are taken at Myr intervals. The energy released/absorbed due to stellar evolution-driven mass loss is calculated from the change in potential energy, whereas the energy released/absorbed due to dynamical interactions is calculated directly from the Fewbody output.
As an example, consider the cyan crosses in Figure 3, which show the degree of cooling due to single-binary encounters. In the lower right panel, cooling due to single-binary interactions initially amount to of the total initial binding energy of the cluster. This increases with time to a level of of the initial cluster binding energy at Gyr. The fractional energy absorbed due to single-binary encounters remains roughly constant (apart from a temporary dip at Gyr) at for the next Gyr. During this time, the long-period binary fraction is reduced due to disruption. It finally reduces to zero at Gyr when all soft binaries have been disrupted. After this, single-binary encounters primarily serve to further harden close binaries, acting as a heat source by imparting energy to single stars (shown by the dark blue crosses in Figure 3).
In all models, stellar evolution (black squares) is the dominant heating mechanism early on in the cluster lifetime, when massive stars are still present in significant numbers. After several Gyr of cluster evolution, single-binary (dark blue crosses) and, to a lesser extent, binary-binary (red triangles) encounters take over as the dominant heating source. Early on in the cluster lifetime, however, both single-binary (cyan crosses) and binary-binary (magenta triangles) encounters act as an important source of cooling, since soft binaries are still present in significant numbers. Finally, direct stellar collisions (green circles) are never the dominant source of cooling, and tend to absorb energy at a much lower rate than the other heating/cooling mechanisms.
4.2.1 Binaries
The disruption of soft binaries is only effective as a cooling mechanism for the first few Gyr of cluster evolution. However, during this time, the cooling due to soft binary disruption is outweighed by heating due to stellar evolution-induced mass loss, since massive stars are still present in significant numbers. The heating caused by the mass loss from these massive stars contributes to an expansion of the core, and the energy sink provided by the disruption of soft binaries only serves to slow the mass loss-driven expansion of the core. This is shown in Figure 3. Cooling due to the disruption of soft binaries is shown by the cyan crosses and magenta triangles, whereas heating caused by stellar evolution-driven mass loss is shown by the black squares.
Clusters that begin with high initial binary fractions do not necessarily end up with high concentrations, independent of our assumption for the maximum orbital separation, and hence the fraction of soft binaries. The open squares in Figures 1 and 2 correspond to model clusters with high initial binary fractions. As is clear from Figure 1, all of these models end up with final core binary fractions that are much higher than observed. At the same time, Figure 1 shows that these same clusters end up with final concentrations that are approximately independent of the initial binary fraction.
It seems unlikely that the disruption of soft binaries contributed significantly to the observed distribution of concentration parameters. In order for the disruption of soft binaries to have a significant effect on the core radius, and hence concentration, our results suggest that the period distribution would need to be heavily peaked just beyond the hard-soft boundary. In this case, most binaries would be soft, with orbital energies slightly larger than that corresponding to the hard-soft boundary. This would maximize the effectiveness of soft binary disruption as an energy sink, and would help to create massive clusters with high concentrations. However, we are unaware of a theoretical reason for why the period distribution should be heavily peaked near the hard-soft boundary, and this would conflict heavily with empirically-derived period distributions (Kroupa, 1995; Kroupa & Petr-Gotzens, 2011).
Binary burning becomes an effective heat source much later in the cluster lifetime, typically only after Gyr of evolution (with the exception of the model shown in the upper left panel in Figure 3, which evolved to a high central density on a shorter time-scale than the other models). This is because, for most of the lifetime of a cluster, the concentration is increasing, and sufficiently high central densities are required in order for interactions between (primarily) single stars and binaries to occur at a fast enough rate for binary burning to become effective. In our models, binary burning mainly serves to slow the contraction of the core, as opposed to completely reversing the collapse and driving a re-expansion of the core. The effectiveness of binary burning is shown by the blue crosses and red triangles in Figure 3, which correspond to heating due to single-binary and binary-binary encounters, respectively.
4.2.2 Galactic tides
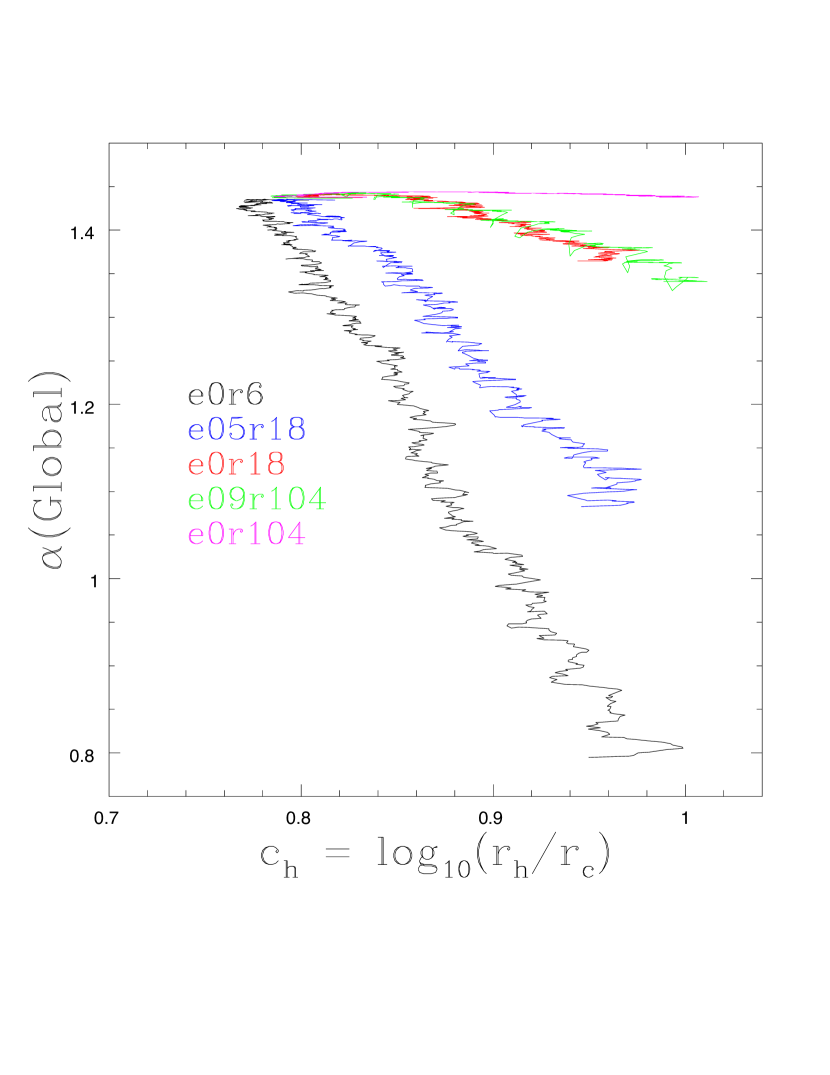
In this section, we rely almost exclusively on the results of our -body models to quantify the effects of Galactic tides on the observed ch- relation. These are presented in Figure 4, which shows the evolution in the ch--plane for models with different orbits through the Galaxy but identical initial conditions (see Section 3.2 for the specific initial conditions). The black, blue, red, green, and magenta lines, in that order, correspond to orbits with decreasing average tidal fields. The main conclusion to be drawn from Figure 4 is that Galactic tides typically have only a small effect on the evolution of the ratio c rh/rc, but a large effect on the evolution of the global stellar MF. Below, we explain the origin of this important result. We will refer back to Figure 4 throughout this section to help illustrate our results.
Galactic tides affect the evolution of the stellar MF in the following way. For a given cluster mass, clusters that experience the strongest tidal fields undergo the most rapid mass loss due to the fact that the tidal radius decreases with decreasing Galactocentric distance. Consequently, clusters exposed to stronger tidal fields undergo the most rapid flattening of their MFs (i.e. the greatest rate of decrease in ), since low-mass stars are preferentially accelerated to wider orbits within the cluster potential. This mass loss translates into a reduction in the time-scale for two-body relaxation. The shorter relaxation time exacerbates the trend, so that more mass is lost from the cluster at an ever-increasing rate, shortening the relaxation time even further. Thus, on average, we expect clusters that experience the strongest tidal fields to undergo the most rapid flattening of their stellar MFs.
Galactic tides affect the evolution of the cluster concentration in the following way. There is an overall trend for clusters that experience the strongest tidal fields to have the smallest radii (Webb et al., 2013).444In this section, we always refer to the 3-D radii, instead of the observational values calculated from the surface brightness profiles. This trend sets in within roughly the first Gyr of evolution, and becomes exacerbated as the clusters continue to evolve. This is because clusters with small Galactocentric distances (and hence small tidal radii) have the least room to expand before filling their tidal radii. Once these clusters are tidally-filling, their core and half-mass radii begin to contract due to two-body relaxation (e.g. Spitzer, 1987; Heggie & Hut, 2003).
Despite the fact that all radii change considerably over the cluster evolution, the net effect of these changes is that the evolution in the concentration parameter is small when calculated using rh instead of rt, changing by a factor only slightly greater than unity. Although rc and rh themselves change significantly, the ratio rh/rc remains roughly the same for all clusters. This is clearly illustrated in Figure 4 for all simulated clusters, almost independent of their orbit through the Galaxy. That is, for model clusters with the same initial size and concentration the evolution in ch appears to be orbit-independent in Figure 4, with ch increasing from 0.8 to almost 1 after a Hubble time. Any differences are within the observational uncertainties. The only exception to this is initially tidally under-filling clusters on relatively circular orbits at large Galactocentric distances. In these clusters, the core radius decreases due to two-body relaxation at a noticeably faster rate than does the half-mass radius. This contributes to an increase in the concentration over time while remains more or less constant, albeit the effect remains small in our models, even for the most distant orbits (see below).
To better explore the effect that initially tidally under-filling clusters may have on the results of Figure 4, we make use of lower mass versions of our -body models. These lower mass models contain 48000 single stars and 2000 binaries initially, and are described in detail in Webb et al. (2013). Due to their smaller masses, these models are less computationally expensive, which allows us to explore a range of initial half-mass radii. For clusters with initial half-mass radii of 2 pc and 4 pc, the central concentration increases while the cluster expands to fill its tidal radius (see Figure 7 in Webb et al. (2013)), and remains roughly constant. This results in tidally under-filling clusters evolving towards the high-ch, high- region of Figure 1. Once the tidal radius is filled, decreases at a rate similar to that in the models shown in Figure 4, while maintaining a near constant half-mass concentration ch. However, in very tidally under-filling clusters at large Galactocentric distances, 12 Gyr may not be enough time to enter this phase of evolution. Thus, although we are unable to reproduce the highest concentrations observed by De Marchi, Paresce & Pulone (2007), initially very tidally under-filling clusters tend to produce the highest final concentrations.
These results suggest that Galactic tides should contribute to, and likely even dominate, the dispersion in the observed c relation. Most of this dispersion should appear at the low-concentration (and typically low-mass) end of the distribution, since these include both initially massive, heavily stripped clusters at small Galactocentric distances and initially low-mass clusters at large Galactocentric distances that have lost only a small fraction of their mass. This can help to account for some of the dispersion in at the low-ch end not reproduced in our models, as seen in Figure 1.
More quantitatively, the smallest Galactocentric distance in the sample of De Marchi, Paresce & Pulone (2007) is kpc and does not evolve significantly at Galactocentric distances beyond kpc. Hence, at the low-concentration end of the distribution, we estimate from Figure 4 that tides should contribute to a dispersion in of for a given initial cluster mass. This value of is a minimum, since the clusters plotted in Figure 4 all began with the same initial total mass. Hence, should be larger for a range of initial total cluster masses, as expected in the proto-Milky Way (e.g. Marks et al., 2012; Kroupa et al., 2013). For comparison, the presently observed range is (from -1.0 up to 2.0). Given the range of initial cluster masses and Galactocentric distances that should apply to the sample of De Marchi, Paresce & Pulone (2007), we conclude that Galactic tides dominate the dispersion in the observed distribution of present-day MF slopes.
We note that tides contribute significantly to altering the global mass function, however the effect is much less pronounced for the central MF evaluated near the core (see Webb et al., in preparation). This is because the central MF is primarily altered via two-body relaxation-driven mass segregation, and is relatively insensitive to the escape of stars across the tidal boundary. This explains why the results presented in Leigh et al. (2012), which focused on the annulus immediately outside the core (between one and two core radii from the cluster centre), are consistent with the general picture that the cluster-to-cluster differences observed in the PDMFs of GCs arise from an universal IMF modified primarily by two-body relaxation-driven dynamical evolution. This general picture is also consistent with the results presented in this paper.
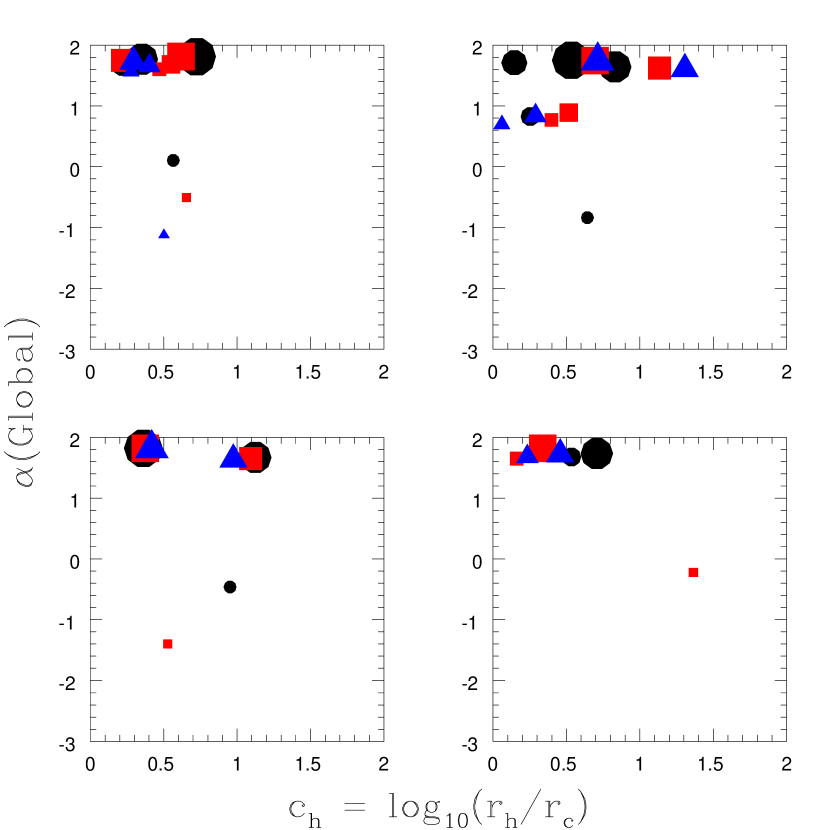
4.2.3 The initial stellar and remnant mass functions
In Figure 5, we show how our results change upon varying both the initial stellar mass function and the initial-final mass relation for BHs. The black circles, red squares, and blue triangles correspond to snapshots at 10, 11 and 12 Gyr, respectively. In order of increasing size, the size of the points correspond to clusters with 50000, 100000, 200000, 300000 and 1800000 stars initially.
As illustrated by the black (10 Gyr), red (11 Gyr) and blue (12 Gyr) squares in Figure 5, the slope of the MF tends to decrease over time. Clusters with the lowest masses (i.e. ; shown by the smallest point-size in Figure 5) end up with the smallest MF slopes, in qualitative agreement with the observations (e.g. Paust et al., 2010; Leigh et al., 2012). More quantitatively, Figure 1 shows that models that assume a standard Kroupa IMF struggle to reproduce clusters with sufficiently low- and low-concentration, as was found by Zonoozi et al. (2011) for the GC Palomar 14. The agreement is slightly better in models that assume a non-standard IMF, as shown by the solid red triangles and squares in Figure 1. However, this is only because the non-standard IMF has more massive stars, which lose the most mass due to stellar evolution, and this contributes to an expansion of the core. Thus, the final concentration is smaller for a non-standard IMF due to the additional mass loss from massive stars very early on in the cluster evolution.
As mentioned, we confirm that the half-light concentration tends to increase over time, however this need not always be the case. For example, stellar evolution causes an expansion of the core very early on in the cluster lifetime, and the concentration can change from increasing to decreasing during the final stages of cluster dissolution. More importantly, there is a stochasticity in the simulations such that nearly identical initial conditions can produce significantly different final evolutionary states for our model clusters.
As illustrated in Figure 5, most of the stochasticity observed in our Monte Carlo simulations seems to be tied to the dynamical evolution of the remnant sub-population within the cluster. For example, in some of our models, an IMBH forms through a new pathway not yet discussed in the literature (for more details, see Giersz, Leigh & Hypki 2013, in preparation). In this scenario, an IMBH forms from a single originally stellar-mass black hole that grows in mass due to dynamical interactions that induce mergers between the growing BH and (typically) other stellar remnants, combined with binary evolution-driven mass-transfer events. To initiate this process, one BH must be left in the system after all BH-forming supernovae have ceased, or a single BH must be formed via NS-NS or NS-WD mergers. The presence of additional BHs tends to prevent the formation of a single very massive BH due to competitive merging and accretion, followed by their dynamical ejection from the cluster. The process is facilitated by the fact that the growing BH is rarely isolated, since the time-scale for it to capture another object and form a binary is very short. The presence of such a binary companion is crucial, since it reduces the time-scale for dynamical interactions and hence mergers. In our standard models, the mass growth of the BH is typically slow and requires a few Gyr of cluster evolution before an IMBH forms. The final core radius is typically higher in these models than in those for which no IMBH forms.
Therefore, our results show that remnants can also contribute to the dispersion in the observed c- relation. Based on the results shown in Figure 5, we estimate that remnants can contribute to a dispersion in of up to , and possibly more in a few rare cases.
5 Discussion
In this section, we argue that stellar dynamics alone is not enough to reproduce the observed c relation. While the effects of two-body relaxation combined with Galactic tides can reproduce the observed dispersion in (Leigh et al., 2012), we do not find a strong increase in the concentration parameter with increasing cluster mass, and hence increasing (e.g. De Marchi, Paresce & Portegies Zwart, 2010; Leigh et al., 2012), in our models, regardless of the initial (universal) conditions and assumptions adopted. This implies that some other non-dynamical mechanism is also required to reproduce the observed distribution of concentration parameters. That is, the initial distribution of cluster concentrations cannot be universal when clusters begin evolving in relative isolation due solely to energy equipartition-driven dynamical evolution. Some other mechanism that is independent of the internal dynamical evolution of clusters is also required. We go on to explore the possibility that the origin of the observed c relation is tied to the gas-embedded phase of cluster evolution.
5.1 Energy equipartition-driven dynamical evolution alone cannot reproduce the observed c relation
Based on our results, two-body relaxation-driven dynamical evolution alone cannot reproduce the observed c relation. This is because our simulated clusters struggle to simultaneously produce both high-concentration high- and low-concentration low- clusters, provided we adopt the same empirically-motivated universal IMF for every cluster (Kroupa, 2011; Kroupa et al., 2013). The problem is that, unlike the IMF, we do not have a reasonable empirically- or theoretically-motivated guess at what the initial concentration should be, as a function of any cluster parameter.
Shifting the initial mass function slope and/or distribution of concentrations in either direction will only worsen the agreement at the opposite end. For example, if we begin with clusters that are initially more concentrated, we will struggle even more to produce sufficiently low concentration clusters with flat MFs, and vice versa. However, in principle, it is possible to match the observed c relation at the high-ch high- end by assuming a higher initial concentration. Similarly, a lower initial concentration combined with a lower value for would improve the agreement at the low-ch low- end.
For these reasons, it is difficult to constrain the exact spread in the initial distribution of concentration parameters required to explain the observed distribution. Instead, we re-iterate that the observed spread in can be reproduced from an universal IMF combined with energy equipartition-driven dynamical evolution (Leigh et al., 2012).555Although we have shown consistency with the universality hypothesis for the IMF, our results do not serve as a proof that the universality hypothesis is correct. Although variations in the IMF with the initial cluster mass (or other cluster properties) have not been ruled out in this study, any such dependences explored in future studies should be firmly rooted in star formation theory given that the observations are also in general consistent with the universality hypothesis for the IMF (e.g. Kroupa et al., 2013). This quantitatively reproduces the general trend that lower mass clusters tend to have shallower PDMFs (De Marchi, Paresce & Pulone, 2007; De Marchi, Paresce & Portegies Zwart, 2010; Paust et al., 2010). Meanwhile, the observed spread in ch cannot be reproduced from an universal distribution of initial concentrations. Thus, some other mechanism that is independent of the internal dynamical evolution of clusters must also be operating in order to reproduce the (weak) trend that higher mass clusters (with, on average, steeper MFs) tend to have higher present-day concentrations (Harris, 1996, 2010 update). In the subsequent sections, we explore different possibilites that could contribute to this observational trend, with a focus on the gas-embedded phase of cluster evolution.
5.1.1 Caveat: stellar collisions and tidal interactions
Milgrom & Shapiro (1978) argued that tidal dissipation during close fly-bys between single stars can reduce the stars’ kinetic energies, and contribute to a contraction of the core on a shorter time-scale than is achieved by two-body relaxation alone. Similarly, direct collisions between single stars should also dissipate kinetic energy (Lightman & Shapiro, 1977). The single-single collision rate increases with increasing cluster mass (Leonard, 1989), so that the most massive clusters should experience the most efficient tidal dissipation due to close fly-bys and direct collisions between single stars. Thus, tidal interactions and collisions may both contribute to the observed relation, since they both contribute to a correlation between cluster mass and concentration.
A detailed treatment of the effects of collisions and tidal interactions is beyond the scope of this paper, however our results suggest that these effects can likely be ignored in future studies. As illustrated in Figure 3, the energy sink provided by collisions is never the dominant heating/cooling mechanism affecting the concentration. In fact, the effect is typically negligible, and remains approximately constant over the cluster lifetime for the central densities reached in our models. It follows that the energy sink offered by tidal interactions is also unlikely to ever be the dominant heating/cooling mechanism. This is because the rate of tidal capture events should be comparable to the rate of direct collisions, since the efficiency of tidal capture decreases rapidly with increasing distance of closest approach. Also, tidal interaction events that do not result in binary formation typically remove significantly less energy than tidal captures, since the energy dissipated due to tides quickly becomes negligible with increasing distance of closest approach.
5.2 The gas-embedded phase of cluster formation
In the previous section, we argued that it is unlikely that the observed c relation has a purely energy equipartition-driven origin. It follows from this, and the assumption that the observed (central) MF distribution alone can be accounted for purely by two-body relaxation-driven dynamical evolution (e.g. Paust et al., 2010; Leigh et al., 2012), that the origin of the observed distribution of cluster concentrations must be tied to some other physical process(es). For example, hierarchical merging of clusters early on in their lifetimes could perhaps contribute. Alternatively, external perturbations from the Galaxy may also play a role, such as disc shocking due to passages through the plane of the Galaxy or interactions with nearby giant molecular clouds or other star clusters. In this section we focus on the gas-embedded phase of cluster formation, and discuss some of the various mechanisms that could have operated when gas was still present in significant quantities.
5.2.1 Cluster expansion due to rapid gas expulsion
Marks, Kroupa & Baumgardt (2008) argue that rapid gas expulsion combined with primordial mass segregation can produce the observed low-concentration clusters with flat MFs. Clusters expand in response to the sudden removal of their gas. Although the tidal radius also increases due to the loss of mass, the central cluster regions expand more significantly, causing the concentration to decrease. At the same time, preferentially low-mass stars in the outskirts become unbound, and escape from the cluster. This simultaneously lowers the concentration and decreases the mass function slope, improving the agreement at the low-ch low- end of the observed relation. The results presented in this paper suggest that an even more bottom-heavy IMF in the mass range 0.3 - 0.8 M⊙ than assumed in our standard model (imf1), combined with a lower initial half-light concentration, could reproduce the observed c relation at the low-ch end. Importantly, this would approximately reproduce the post-gas expulsion MF and cluster concentration described in Marks, Kroupa & Baumgardt (2008) and Marks et al. (2012). Disc shocking and external perturbations from other massive bodies on nearby orbits within the Galaxy could also contribute to this general trend. This is because these mechanisms should typically desposit additional energy within clusters, causing them to expand and accelerating the rate of escape of preferentially low-mass stars across the tidal boundary (e.g. Vesperini & Heggie, 1997).
Marks, Kroupa & Baumgardt (2008) also caution that unresolved binaries can contribute to making the MF index appear smaller than it actually is. This is because each binary causes two single stars to disappear from the mass function, and an additional star with a derived mass higher than either binary component to be included. Hence, on average, binaries artificially deplete the low-mass end of the MF while simultaneously over-populating the high-mass end. Unresolved binaries should have at most a small effect on our results, however. This is because the simulated mass functions are derived by treating binaries as unresolved objects, in analogy with the observed mass functions. Additionally, in all but the lowest mass clusters considered here, the number of binaries is so few that they do not significantly affect the derived power-law index of the MF (e.g. Milone et al., 2012).
5.2.2 Cluster contraction due to prolonged gas retention
There now exists evidence that the most massive MW GCs underwent multiple episodes of star formation (e.g. Piotto et al., 2007). This trend does not appear in much lower mass open clusters, and even the lowest mass globulars (e.g. Gratton, Carretta & Bragaglia, 2012). The currently favoured scenario to explain these multiple populations suggests that either star formation was on-going for 108 years (e.g. Conroy & Spergel, 2011), or massive clusters re-accreted gas from which new stars were formed (e.g. Pflamm-Altenburg & Kroupa, 2009). This additional star formation indirectly implies that gas was present in these clusters for a prolonged period of time relative to their lower mass counterparts.
Several mechanisms could contribute to increasing the concentration during the gas-embedded phase. For example, the occurrence of star formation suggests relatively high gas accretion rates for the stars. Independent of whether or not the gas actually remains bound to the accretor, this could act to reduce the accretor velocities due to conservation of momentum. For this to be the case, all that is required is that the “accreted” gas be accelerated by the accretor such that the two are co-moving relative to the background medium (Hoyle & Lyttleton, 1939; Bondi & Hoyle, 1944; Bondi, 1952). In general, accretion from the interstellar medium should both increase the central stellar density and accelerate the mass segregation process (Leigh et al., 2013), since the accretion rate typically increases with increasing accretor mass.
Active star formation also suggests high gas densities. Consequently, gas dynamical friction could be very efficient, since the gas dynamical friction force scales linearly with the gas density. The net effect of gas dynamical friction is to transfer kinetic energy from the stars to the surrounding gas, causing the central stellar density to increase but the central gas density to decrease. We note that the gas dynamical friction force also depends critically on whether or not the motion of the perturber relative to the gas is subsonic or supersonic. Given that stars are actively forming during much of the gas-embedded phase, this suggests that the gas must have been relatively cold. It follows that the sound-speed should have been small compared to the stellar velocity dispersion, and hence that the motion was predominantly supersonic. The most efficient gas drag occurs when the relative velocity is slightly less than the sound speed (Lee & Stahler, 2011) (i.e. when the stellar and gas velocity dispersions are roughly equal), however previous work has also shown it to be effective in the supersonic regime (Dokuchaev, 1964; Ruderman & Spiegel, 1971; Rephaeli & Salpeter, 1980; Ostriker, 1999).
The increase in stellar density due to the presence of gas could result in positive feedback, and help to prolong the gas-embedded phase. This is because a higher stellar density translates into a deeper potential well, and hence a larger escape velocity. This could in turn imply a larger gas retention fraction and/or a longer gas expulsion time (e.g. Heggie & Giersz, 2009).
If more massive clusters tend to have higher gas densities primordially, retain their gas for longer or re-accrete more gas from the surrounding intra-cluster medium than do low-mass clusters, this could contribute to a correlation between cluster mass and concentration. This is because, in this case, the efficiencies of both accretion from the ISM (onto stars) and gas dynamical friction should increase with increasing cluster mass.
We conclude that the gas-embedded phase of cluster evolution could be crucially important for the origin of the observed c relation. This is not only due to the fact that the results presented in this paper suggest that two-body relaxation-driven dynamical evolution alone cannot explain the observed distribution of concentrations, but also because the gas damping mechanisms we have considered should all contribute to the observed trend of increasing concentration with increasing cluster mass. More work will be needed to better isolate the origin of the observed c relation and, in particular, the degree to which it was present at the end of the gas-embedded phase. Future studies with this goal should aim to constrain the gas-embedded phase of cluster evolution (e.g. central gas density, gas retention time, etc.) as a function of the total cluster mass.
6 Summary
In this paper, we consider the origin of the correlation between cluster concentration and present-day mass function slope observed in the Milky Way globular cluster population. To this end, we generate a suite of Monte Carlo and -body models using the MOCCA and NBODY6 codes, respectively, for star cluster evolution. We compare the results to the observed correlation between cluster concentration and mass function slope, as well as to the observed anti-correlation between cluster mass and binary fraction. These relations can either be reproduced from universal initial conditions combined with some dynamical mechanism(s) that alter(s) the distributions over time, or they must arise very early on in the cluster lifetime, such as during the gas-embedded phase of cluster formation. We explore a number of dynamical mechanisms that could contribute to, or even reproduce, the observed trends. Our key conclusions are:
-
*
Galactic tides combined with energy equipartition-driven dynamical evolution can account for most, if not all, of the observed dispersion in the present-day MF slope , but not all of the dispersion in the concentration parameter ch.
-
*
Dynamical effects induced by stellar remnants should also contribute non-negligibly to the dispersion observed in ch.
-
*
Some other mechanism that is independent of the internal dynamical evolution of clusters must also operate in order to reproduce the observed dispersion in ch.
-
*
Whatever the mechanism(s) responsible, it should operate by preferentially increasing ch in more massive clusters in order to reproduce the observed trend that clusters with steep MFs (and typically large total cluster masses) tend to have the highest concentrations.
Thus, we conclude that energy equipartition-driven dynamical evolution alone could not have reproduced the observed relation between concentration and mass function slope. Consequently, we suggest that this trend could be connected to the gas-embedded phase of cluster evolution. Specifically, we argue that cluster contraction due to prolonged gas retention could account for the most concentrated clusters with the steepest mass functions, and cluster expansion due to rapid gas expulsion could account for the least concentrated clusters with the flattest mass functions.
Acknowledgments
We would like to thank Michael Marks and Hagai Perets for useful discussions, as well as an anonymous referee whose suggestions helped to improve this manuscript. This work was partly supported by the Polish Ministry of Science and Higher Education through the grant N N203 38036 and by the National Science Centre through the grants DEC-2012/07/B/ST9/04412 and DEC-2011/01/N/ST9/06000.
References
- Aarseth (1974) Aarseth S., Hénon M., Wielen R. 1974, A&A, 37, 183
- Aarseth (2003) Aarseth, S.J. 2003, Gravitational -body Simulations: Tools and Algorithms (Cambridge Monographs on Mathematical Physics). Cambridge University Press, Cambridge
- Baumgardt & Makino (2003) Baumgardt H., Makino J. 2003, MNRAS, 340, 227
- Baumgardt, De Marchi & Kroupa (2008) Baumgardt H., De Marchi G., Kroupa P. 2008, MNRAS, ApJ, 685, 247
- Belczynski, Kalogera & Bulik (2002) Belczynski K., Kalogera V., Bulik T. 2002, ApJ, 572, 407
- Binney & Tremaine (1987) Binney J., Tremaine S., 1987, Galactic Dynamics (Princeton: Princeton University Press)
- Bondi & Hoyle (1944) Bondi H., Hoyle F. 1944, MNRAS, 104, 273
- Bondi (1952) Bondi H. 1952, MNRAS, 112, 195
- Brodie & Strader (2006) Brodie J. P., Strader J. 2006, ARA&A, 44, 193
- Chernoff & Weinberg (1990) Chernoff D. F., Weinberg M. D. 1990, ApJ, 351, 121
- Conroy & Spergel (2011) Conroy C., Spergel D. N. 2011, ApJ, 726, 36
- De Marchi, Paresce & Pulone (2007) De Marchi G., Paresce F., Pulone L. 2007, ApJL, 665, 65
- De Marchi, Paresce & Portegies Zwart (2010) De Marchi G., Paresce F., Portegies Zwart S. 2010, ApJ, 715, 1 De Marchi G., Paresce F., Pulone L. 2007, ApJL, 665, 65
- Dokuchaev (1964) Dokuchaev V. P. 1964, Sovet Astron., 8, 23
- Duquennoy & Mayor (1991) Duquennoy A., MAyor M. 1991, A&A, 248, 485
- Fall & Zhang (2001) Fall S. M., Zhang Q. 2001, ApJ, 561, 751
- Fregeau et al. (2004) Fregeau J. M., Cheung P., Portegies Zwart S. F., Rasio F. A. 2004, MNRAS, 352, 1
- Fregeau, Ivanova & Rasio (2009) Fregeau J. M., Ivanova N., Rasio F. A. 2009, ApJ, 707, 1533
- Gieles et al. (2006) Gieles M., Portegies Zwart S. F., Baumgardt H., Athanassoula E., Lamers H. J. G. L. M., Sipior M., Leenaarts J. 2006, MNRAS, 371, 793
- Gieles, Athanassoula & Portegies Zwart (2007) Gieles M., Athanassoula E., Portegies Zwart S. F. 2007, MNRAS, 376, 809
- Gieles, Heggie & Zhao (2011) Gieles M., Heggie D. C., Zhao H. 2011, MNRAS, 413, 2509
- Giersz et al. (2013) Giersz M., Heggie D. C., Hurley J. R., Hypki A. 2013, MNRAS, 431, 2148
- Gratton, Carretta & Bragaglia (2012) Gratton R., Carretta E., Bragaglia A. 2012, Astronomy & Astrophysics Review, in press (arXiv:1201.6526)
- Harris (1996, 2010 update) Harris, W. E. 1996, AJ, 112, 1487 (2010 update)
- Harris & Harris (2011) Harris G. L. H., Harris W. E. 2011, MNRAS, 410, 2347
- Heggie & Hut (2003) Heggie D. C., Hut P. 2003, The Gravitational Million-Body Problem: A Multidisciplinary Approach to Star Cluster Dynamics (Cambridge: Cambridge University Press)
- Heggie (1975) Heggie D. C. 1975, MNRAS, 173, 729
- Heggie & Giersz (2008) Heggie D. C., Giersz M. 2008, MNRAS, 389, 1858
- Heggie & Giersz (2009) Heggie D. C., Giersz M. 2009, MNRAS, 397, 46
- Hoyle & Lyttleton (1939) Hoyle F., Lyttleton R. A. 1939, in Proceedings of the Cambridge Philosophical Society, 35, 405
- Hurley, Pols & Tout (2000) Hurley J. R., Pols O. R., Tout C. A. 2000, MNRAS, 315, 543
- Hurley, Pols & Tout (2002) Hurley J. R., Pols O. R., Tout C. A. 2002, MNRAS, 329, 897
- Hurley et al. (2005) Hurley J. R., Pols O. R., Aarseth S. J., Tout C. A. 2005, MNRAS, 363, 293
- Hurley (2008a) Hurley, J.R. 2008a, Cambridge -body Lectures, Lecture Notes in Physics, 760. Springer-Verlag, Berlin, p.283
- Hurley (2008b) Hurley, J.R. 2008b, Cambridge -body Lectures, Lecture Notes in Physics, 760. Springer-Verlag, Berlin, p.321
- Hypki & Giersz (2013) Hypki A., Giersz M. 2013, MNRAS, 429, 1221
- King (1966) King I. R. 1966, AJ, 71, 64
- Kravtsov & Gnedin (2005) Kravtsov A. V., Gnedin O. Y. 2005, ApJ, 623, 650
- Kroupa, Gilmore & Tout (1991) Kroupa P., Gilmore G., Tout C. A. 1991, MNRAS, 251, 293
- Kroupa, Tout & Gilmore (1993) Kroupa P., Tout C. A., Gilmore G. 1993, MNRAS, 262, 545
- Kroupa (1995) Kroupa P. 1995, MNRAS, 277, 1507
- Kroupa, Petr & McCaughrean (1999) Kroupa P., Petr M. G., McCaughrean M. J. 1999, New Astronomy, 4, 495
- Kroupa (2002) Kroupa P. 2002, Science, 295, 82
- Kroupa (2008) Kroupa P. 2008, Cambridge -body Lectures, Lecture Notes in Physics, 760. Springer-Verlag, Berlin, p. 181
- Kroupa (2011) Kroupa P. 2011, Proceeds of the International Astronomical Union, IAU Symposium 270, 141-149
- Kroupa & Petr-Gotzens (2011) Kroupa P. Petr-Gotzens M. G. 2011, A&A, 529, 92
- Kroupa et al. (2013) Kroupa P., Weidner C., Pflamm-Altenburg J., Thies I., Dabringhausen J., Marks M., Maschberger T. 2013, Planets, Stars and Stellar Systems Vol. 5, ed. Oswalt T. D. & Gilmore G. (Springer Science & Business Media Dordrecht: Dordrecht), 115-242
- Kruijssen & Portegies Zwart (2009) Kruijssen J. M. D., Portegies Zwart S. F. 2009, ApJL, 698, L158
- Kruijssen & Lützgendorf (2013) Kruijssen J. M. D., Lützgendorf N. 2013, MNRAS Letters, accepted (arXiv:1306.0561)
- Lee & Stahler (2011) Lee A. T., Stahler S. W. 2011, MNRAS, 416, 3177
- Leigh et al. (2012) Leigh N. W., Umbreit S., Sills A., Knigge C., De Marchi G., Glebbeek E., Sarajedini A. 2012, MNRAS, 422, 1592
- Leigh et al. (2013) Leigh N. W., Böker T., Maccarone T. J., Perets H. B. 2013, MNRAS, 429, 2997
- Leonard (1989) Leonard P. J. T. 1989, AJ, 98, 217
- Lightman & Shapiro (1977) Lightman A. P., Shapiro S. L. 1977, ApJ, 213, 183
- Long, Charles & Dubus (2002) Long K. S., Charles P. A., Dubus G., 2002, ApJ, 569, 204
- Lützgendorf et al. (2011) Lützgendorf N., Kissler-Patig M., Noyola E., Jalali B., de Zeeuw P. T., Gebhardt K., Baumgardt H. 2011, A&A, 533, 36
- Lützgendorf et al. (2013) Lützgendorf N., Kissler-Patig M., Neumayer N., Baumgardt H., Noyola E., de Zeeuw P. T., Gebhardt K., Jalali B., Feldmeier A. 2013, A&A, 555, 26
- Mackey et al. (2007) Mackey A. D., Wilkinson M. I., Davies M. B., Gilmore G. F. 2007, MNRAS, 379L, 40
- Mackey et al. (2008) Mackey A. D., Wilkinson M. I., Davies M. B., Gilmore G. F. 2008, MNRAS, 386, 65
- Maeder (2009) Maeder A. 2009, Physics, Formation and Evolution of Rotating Stars. Berlin: Springer-Verlag
- Marks, Kroupa & Baumgardt (2008) Marks M., Kroupa P., Baumgardt H. 2008, MNRAS, 386, 2047
- Marks & Kroupa (2010) Marks M., Kroupa P. 2010, MNRAS, 406, 2000
- Marks, Kroupa & Oh (2011) Marks M., Kroupa P., Oh S. 2011, MNRAS, 417, 1684
- Marks et al. (2012) Marks M., Kroupa P., Dabringhausen J., Pawlowski M. S. 2012, MNRAS, 422, 2246
- Marks & Kroupa (2012) Marks M., Kroupa P. 2012, A&A, 543, 8
- Milgrom & Shapiro (1978) Milgrom M., Shapiro S. L. 1978, ApJ, 223, 991
- Milone et al. (2012) Milone A. P., Piotto G., Bedin L. R., Aparicio A., Anderson J., Sarajedini A., Marino A. F., Moretti A., Davies M. B., Chaboyer B., Dotter A., Hempel M., Marin-Franch A., Majewski S., Paust N. E. Q., Reid I. N., Rosenberg A., Siegel M. 2012, A&A, 540, 16
- Miyamoto & Nagai (1975) Miyamoto M., Nagai R. 1975, PASJ, 27, 533
- Murray (2009) Murray N. 2009, ApJ, 691, 946
- Ostriker (1999) Ostriker E. C. 1999, ApJ, 513, 252
- Paust et al. (2010) Paust N. E. Q., Reid I. N., Piotto G., et al. 2010, AJ, 139, 476
- Pflamm-Altenburg & Kroupa (2009) Pflamm-Altenburg J., Kroupa P. 2009, ApJ, 706, 516
- Piotto et al. (2007) Piotto G., Bedin L. R., Anderson J., King I. R., Cassisi S., Milone A. P., Villanova S., Pietrin- ferni A., Renzini A. 2007, ApJ, 661, L53
- Plummer (1911) Plummer H.C. 1911, MNRAS, 71, 460
- Portegies Zwart et al. (2004) Portegies Zwart S. F., Baumgardt H., Hut P., Makino J., McMillan S. L. W. 2004, Nature, 428, 724
- Praagman, Hurley & Power (2010) Praagman A., Hurley J., Power C. 2010, New Astronomy, 15, 46
- Rephaeli & Salpeter (1980) Rephaeli Y., Salpeter E. E. 1980, ApJ, 240, 20
- Ruderman & Spiegel (1971) Ruderman M. A., Spiegel E. A. 1971, ApJ, 165, 1
- Sippel & Hurley (2013) Sippel A. C., Hurley J. R. 2013, MNRAS, 430, 30
- Sollima et al. (2007) Sollima A., Beccari G., Ferraro F. R., Fusi Pecci F., Sarajedini A. 2007, MNRAS, 380, 781
- Sollima (2008) Sollima A. 2008, MNRAS, 388, 307
- Spitzer (1987) Spitzer L. Jr. 1987, Dynamical Evolution of Globular Clusters (Princeton, NJ: Princeton Univ. Press)
- Tremaine, Ostriker & Spitzer (1975) Tremaine S. D., Ostriker J. P., Spitzer L. Jr. 1975, ApJ, 196, 407
- Vesperini & Heggie (1997) Vesperini E., Heggie D. C. 1997, MNRAS, 289, 898
- von Hoerner (1957) von Hoerner S. 1957, ApJ, 125, 451
- Webb, Sills & Harris (2012) Webb, J.J., Sills A., Harris, W. E. 2012, ApJ, 746, 93
- Webb et al. (2013) Webb, J.J., Harris W. E., Sills A., Hurley J. R. 2013, ApJ, 764, 124
- Xue et al. (2008) Xue X. X., et al. 2008, ApJ, 684, 1143
- Zhang & Fall (1999) Zhang Q., Fall S. M. 1999, ApJ, 527, 81
- Zonoozi et al. (2011) Zonoozi A. H., Küpper A. H. W., Baumgardt H., Haghi H., Kroupa P., Hilker M. 2011, MNRAS, 411, 1989