A large-scale galaxy structure at
associated with the radio galaxy MRC 0156-252††thanks: Based on
observations obtained at the European Southern Observatory using the Very Large Telescope on Cerro
Paranal through ESO programme 090.A-0734 (P.I. A. Galametz)
We present the spectroscopic confirmation of a structure of galaxies surrounding the radio galaxy MRC 0156-252 at . The structure was initially discovered as an overdensity of both near-infrared selected and mid-infrared selected galaxy candidates. We used the VLT/FORS2 multi-object spectrograph to target high-redshift galaxy candidates, and obtain robust spectroscopic redshifts for more than half the targets. The majority of the confirmed sources are star-forming galaxies at . In addition to the radio galaxy, two of its close-by companions () also show AGN signatures. Ten sources, including the radio galaxy, lie within (i.e., velocity offsets km s-1) and within projected Mpc comoving of the radio galaxy. Additional evidence suggests not only that the galaxy structure associated with MRC 0156-252 is a forming galaxy cluster but also that this structure is most probably embedded in a larger scale structure.
Key Words.:
Galaxies: clusters: general - Galaxies: clusters: individual: MRC 0156-252 - large scale structure of the Universe - Galaxies: individual: MRC 0156-2521 Introduction
Galaxy clusters are the densest, most massive gravitationally bound regions, emerging from the highest fluctuation peaks in the matter distribution of the early universe. They therefore provide crucial constraints on cosmological models (e.g., Jimenez & Verde 2009) as well as on scenarios of galaxy formation. As large reservoirs of galaxies at a specific cosmic time, they also provide unique laboratories to investigate galaxy evolution.
Decades of studies have drawn a relatively accurate picture of the state and physical processes occurring within galaxy clusters at low to intermediate redshift. Clusters possess a core dominated by massive, early-type galaxies forming a tight red sequence, up to at least (Lidman et al. 2008; Nastasi et al. 2011). A primary challenge for this field is to push cluster discoveries to higher redshift in order to investigate the formation epoch and physical processes that lead to the present-day structures.
However, until recently, our knowledge of high-redshift galaxy clusters was relatively sparse with only a handful of confirmed systems at . Discoveries of galaxy clusters at higher redshift were mainly restricted by the limitation of classical cluster search methods such as the detection of extended X-ray emission from the intracluster medium (e.g., Stanford et al. 2006; Fassbender et al. 2011) which is limited by the diminishing surface brightness, the red-sequence techniques shifted to the near-infrared at , or the promising Sunyaev-Zel dovich (SZ) cluster surveys that are, to date, still restricted to (e.g., Vanderlinde et al. 2010; Foley et al. 2011; Stalder et al. 2013; Planck Collaboration 2013; Bayliss et al. 2013).
Over the last decade, two alternative techniques have proven efficient at finding high-redshift galaxy structures. On one hand, studies have used the great sensitivity of the Spitzer telescope and in particular its Infrared Array Camera (IRAC; Fazio et al. 2004) to identify galaxy clusters. The IRAC colour is very efficient at selecting high-redshift galaxies () and therefore at isolating high-redshift clusters (Eisenhardt et al. 2008; Papovich 2008; Galametz et al. 2012; Wylezalek et al. 2013). A large number of confirmed high-redshift () galaxy (proto-)clusters were found and confirmed through spectroscopic follow-up of overdensities of IRAC red sources — e.g., SXDF-XCLJ0218-0510 at (Papovich et al. 2010; Tanaka et al. 2010), IDCS J1426+3508 at (Stanford et al. 2012) and CL J1449-0856 at (Gobat et al. 2013). These galaxy (proto-)clusters were, however, discovered through field surveys, i.e., serendipitously. Finding larger samples of high-redshift galaxy clusters would require field surveys even wider than the several tens of square-degrees which are the current state-of-the-art.
On the other hand, targeted searches in the surroundings of powerful high-redshift radio galaxies have proven quite effective. Radio galaxies are amongst the most massive sources in the Universe with masses of M M⊙ (Seymour et al. 2007) and preferentially inhabit dense environments. The first searches of high-redshift galaxy structures in the environments of radio galaxies typically focussed at . They made use of narrow-band imaging to detect emission line objects such as Ly and H emitters (e.g., Pentericci et al. 2000; Kurk et al. 2004; Venemans et al. 2004, 2007; Hayashi et al. 2010; Koyama et al. 2013) that are usually not very massive (a few M⊙; Overzier et al. 2008) and likely to be young star-forming galaxies. An overdensity of star-forming galaxies at was also reported in the field of the bright QSO HS1700+643 (Steidel et al. 2005).
Complementary studies have attempted to reveal the massive evolved population in these galaxy structures at (e.g., Kajisawa et al. 2006; Tanaka et al. 2007; Zirm et al. 2008; Galametz et al. 2009a, 2010b) in order to determine the epoch of appearance of the first red sequence galaxies. However, most of these confirmed galaxy structures at are still in the act of collapsing i.e. they are likely proto-clusters which are are not yet part of an evolved and quasi-virialized dark matter halo. Although there has been evidence of a mixed population of both star-forming and quiescent galaxies in protoclusters at with the latest formed between and (Tanaka et al. 2013), attempts at confirming red sequence objects in proto-clusters at have been challenging with even the reddest galaxies showing on-going star-formation (Doherty et al. 2010). However, significant star formation activity has also been observed in the cores of massive clusters at and beyond (e.g. Tran et al. 2010; Hayashi et al. 2010; Fassbender et al. 2011; Bayliss et al. 2013; Lotz et al. 2013). The cosmic epoch at is therefore crucial for the development of the dominant red and dead cluster galaxy population observed in lower redshift cluster environments. In this respect, detailed studies of galaxy population properties in proto-clusters at can provide important insights on the early evolution, environmental effects, and physical processes that drive galaxy evolution in dense environments.
Recent programs have intended to combine the two cluster searching techniques mentioned above to systematically look for (proto)clusters in the fields of radio galaxies using IRAC and m data: e.g., the Spitzer High-z Radio Galaxy survey (SHzRG; Galametz et al. 2012) and its extension (both in sample size and to type 1 AGN), the Clusters Around Radio-Loud AGN survey (CARLA; Wylezalek et al. 2013).
In this paper, we present spectroscopic observations of a galaxy structure found in the field of the radio galaxy MRC 0156-252 () that was part of the SHzRG sample and found to lie in an overdense region of both IRAC-selected galaxies (Galametz et al. 2012, and Section 3) and near-infrared-selected high-redshift galaxy candidates (Galametz et al. 2010a, and Section 2).
We follow-up the galaxy structure candidate with the optical multi-object FOcal Reducer and low dispersion Spectrograph (FORS2) at VLT. Sections 2 and 3 provide information on the radio galaxy itself and the candidates selection, respectively. Section 4 details the observations, data reduction and spectroscopic redshift assignments. Section 5 reports on the close-by companions of MRC 0156-252. Section 6 presents the galaxy structure found at and a comparison of this structure with current known galaxy clusters and protoclusters at similar cosmic time. Section 7 summarizes our results.
Throughout the paper, we assume a CDM cosmology with km s-1 Mpc-1, and . All magnitudes are expressed in the AB photometric system.

2 MRC 0156-252
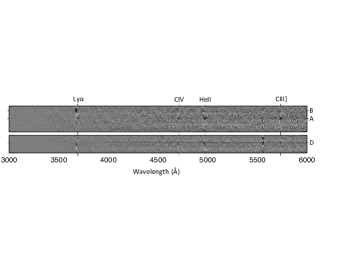
MRC 0156-252 was first reported in Large et al. (1981) as part of the Molonglo Reference Catalogue of Radio Sources. An optical spectrum of the radio galaxy revealed three emission lines that McCarthy et al. (1990) identified as Ly, CIV and HeII at a redshift of . MRC 0156-252 has narrow Ly emission and shows an extended optical morphology (McCarthy et al. 1990) but it is unresolved at near-infrared wavelengths (McCarthy et al. 1992). This led McCarthy (1993) to conclude that MRC 0156-252 has an old stellar population with some on-going star-formation that could explain the extended rest frame UV emission. Based on a later near-infrared spectrum of MRC 0156-252 and the study of its broad H line, Eales & Rawlings (1996) suggested that MRC 0156-252 might actually be a quasar largely obscured by dust. They also found that the peak of the H line was redshifted by km s-1 compared to what expected at . Although they note that similar offsets have been observed for other high-redshift quasars, we find that the higher quality FORS2 spectroscopy presented in §4 revises the redshift of MRC 0156-252 to , consistent with the position of the H line from Eales & Rawlings (1996).
Radio galaxies show a range of morphologies often with clumpy structures (Pentericci et al. 1999; Galametz et al. 2009a). MRC 0156-256 has, at least, four bright close-by companions previously reported in McCarthy et al. (1990), Pentericci et al. (2001) and Galametz et al. (2010a), including the brightest source (in the near-infrared) usually identified as the radio source. Figure 1 shows the immediate surroundings of MRC 0156-252 in (pre-imaging; see §4.1), and . The majority of the companions are aligned in the direction of the radio axis ( NE / SW) and spread over less than . Source A is the brightest source that coincides with the position of the radio core. Source B is located at the very edge of the NE radio lobe and has very blue colours, possibly due to enhanced star-formation triggered by the radio jet (Pentericci et al. 2001). A faint companion (E) is detected at the edge of the SW radio lobe. Source D, found SW of A, also has blue colours. The FORS2 -band image reveals that D has a disturbed morphology with a brighter compact ‘core’ and an extension to the south. Source C is located NE of A and has red near-infrared colours. An additional source (A′) was also revealed by the optical data within of the radio galaxy.
3 Identification of a galaxy cluster candidate in the field of MRC 0156-252
As previously mentioned, several pieces of evidence suggest that MRC 0156-252 is embedded in a (proto)cluster at high redshift.
MRC 0156-252 was found to lie in an overdensity of near-infrared selected galaxy candidates (Galametz et al. 2010a; G10 hereafter). G10 introduces a purely near-infrared two-colour selection criterion to isolate galaxies at and differentiate between old, red stellar populations and young, blue star-forming galaxies, designated as r- and b-, respectively. We refer to G10 for details on the colour selection technique. At the depth of the near-infrared data, the field of MRC 0156-252 was found to be times denser than control fields in -selected galaxies including the GOODS-South field, which is known to host a galaxy protocluster at (Castellano et al. 2007; Kurk et al. 2009). Half of the r- galaxies have colours consistent with red sequence models at . G10 therefore concluded that MRC 0156-252 is likely associated with a galaxy (proto)cluster at . Figure 2 shows the spatial distribution of the r- and b- selected sources in the field of MRC 0156-252.

MRC 0156-252 was also found to lie in an overdensity of mid-infrared selected galaxy candidates (Galametz et al. 2012; G12 hereafter). G12 studied the environment of high-redshift () radio galaxies — including MRC 0156-252 — in order to identify potential associated galaxy clusters. G12 made use of a single red IRAC colour cut () to isolate galaxies (Papovich et al. 2008, Wylezalek et al. 2013). The field of MRC 0156-252 was the ninth densest field in red IRAC-selected galaxies, overdense at a level compared to average. Its surface density of IRAC-selected galaxies was found to be consistent with the CL J1449+0856 protocluster (Gobat et al. 2011). G12 therefore also concluded that MRC 0156-252 is indeed embedded in a high-redshift galaxy (proto)cluster. The spatial distribution of the red IRAC-selected sources in the field of MRC 0156-252 is also reported in Figure 2.
4 VLT/FORS2 spectroscopy
We conducted spectroscopic observations with VLT/FORS2 to confirm the membership of the cluster member candidates in the field of MRC 0156-252.
4.1 Mask design and targets
Only limited shallow optical data were available in the field of MRC 0156-252 prior to the FORS2 run from Las Campanas (, and Ly data; McCarthy et al. 1990; Pentericci et al. 2001) and HST/WFPC2 (; Overzier et al. 2005). To accurately design the masks for the FORS2 spectroscopy, we obtained deep ( hr) imaging in the band ( nm corresponding to nm rest frame at ; referred to as hereafter). The -band was chosen to match the wavelength range covered by the spectroscopy. The data were reduced using standard IRAF reduction tools and source extraction was done using SExtractor (Bertin & Arnouts 1996).
We designed two slit masks and chose their orientations to optimize the observations of the radio galaxy and its neighbors i.e., positions angle of for the first mask and for the second. Figure 1 shows the two slits that were designed to observe the radio galaxy companions. One slit of the first mask was placed along the radio axis to target sources A, A′, B and D. We did not observe source C and chose to elongate the slit towards the south for an optimal sky subtraction. Source C is barely detected in the -band and thus it is expected to be quite challenging to confirm through optical spectroscopy. One slit of mask 2 targeted the southern extended companion of the radio galaxy (source D and its extension to the south). The rest of the masks were designed as follows: the first mask was preferentially filled with sources that are relatively bright in the -band (). The second mask was filled with sources down to a fainter () magnitude.
In total, we targeted distinct sources (two r- selected sources were common to both masks): the radio galaxy and neighbors ( slits), r- selected sources (including IRAC-selected sources), b- selected sources (including IRAC-selected sources), red IRAC-selected sources, one mid-infrared selected AGN candidate (G12) — identified by the four IRAC bands AGN colour wedge from Stern et al. (2005) — and four additional bright, nearby sources to check the mask alignment.
4.2 Observations and data reduction
The two slit masks were observed on UT 2012 October 20 using the MXU mode of FORS2 with the blue-optimized detector and the 300V+10 grism with no order-sorting filter to cover a typical wavelength range of Å (Å at ). Mask 1 and Mask 2 (filled with fainter targets) were exposed for hours and hours total, respectively. The sky conditions were clear with an average seeing throughout the night.
We reduced the spectroscopic data using ‘BOGUS’111http://www.ucolick.org/h̃olden/datareducetext/bogus.html, an IRAF script designed for efficient processing of multi-slit data. The pipeline includes classical reduction steps such as flat-fielding, cosmic ray rejection, sky subtraction, and combination of independent exposures. The 1D spectra were extracted using IRAF. The uncertainties on the wavelength calibration were estimated from the sky lines to be Å.
4.3 Spectroscopy results

Spectroscopic redshifts () were assigned to galaxies. The redshifts were determined using EZ (Garilli et al. 2010). The majority of the derived redshifts are at a high-confidence level with at least three strong absorption lines or two strong emission lines. Quality flags ‘B’ were assigned to redshifts with weakly detected absorption lines. Redshift uncertainties were derived by summing in quadrature the fitting and wavelength calibration uncertainties. Figure 3 shows the distribution of our spectroscopic redshifts. Appendix A reports the identification number (in the -band) of these sources with , coordinates, target selection technique, spectroscopic redshifts and detected absorption/emission lines for the members of the galaxy structure associated with MRC 0156-252 (see section 6 and Table 2) and for foreground/background galaxies (Table 3).
Mainly due to the wavelength coverage probed by the FORS2 configuration, we did not confirm any galaxy in the redshift range . Galaxies with were mostly confirmed thanks to their [OII] emission doublet. A large fraction of the galaxies with are star-forming galaxies and present a clear continuum discontinuity due to the Ly forest in addition to standard absorption lines (e.g., SiII1260; OI/SiII; CII; SiIV; SiII1526; CIV; FeII; AlII; SiII1808; AlIII). Four sources have AGN signatures at including sources B and D. Due to the adopted spectrograph configuration, we should in principle be able to detect Ly for galaxies at , provided they are star-forming and do not contain dust. A Ly emission line was observed in of the galaxies confirmed at .
We obtained spectroscopic redshifts for of the (%) targeted IRAC-selected galaxies. of them (%) have, as expected from their mid-infrared colours, which shows that a simple red IRAC colour cut is particularly efficient at identifying high-redshift galaxies. At least one of the lower redshift galaxies is an obscured AGN, which is a population known to have red mid-infrared colours (e.g., Stern et al. 2005, 2012), and thus are a known contaminant to the simple selection. We also derived spectroscopic redshifts for of (%) targeted b- galaxies out of which have a and with . This result demonstrates the efficiency of near-infrared broad-band selection at preferentially isolating high-redshift galaxies. To our knowledge, this spectroscopic run is the first to follow-up -selected galaxies and demonstrates the efficiency of the selection technique. However, it would be highly speculative in the light of this first preliminary result to derive estimates of the effectiveness of the selection criterion. We were not able to derive spectroscopic redshifts for half of the targets which probably lack strong absorption/emission lines out of their faint continuum. We can not dismiss however that they could be lying at a redshift not probed by our FORS configuration.
Only three of the targeted r- were assigned a spectroscopic redshift, two of which are type-2 AGN. The confirmation of red galaxies at high redshift is known to be challenging since they are not expected to show strong features, especially at optical wavelengths. For example, Wuyts et al. (2009) followed-up a sample of Distant Red Galaxies (DRG; ) using either deeper observations ( hrs) with VLT/FORS2 or with similar exposure times on Keck/LRIS and were able to derive spectroscopic redshifts for about % of their sample. Their confirmed DRG all show Ly. Similarly, of our r- show a emission line.
5 The radio galaxy companions
A redshift was derived for sources A, B and D. Their 2D and 1D spectra are shown in Figures 4 and 5 respectively. Sources C and E were not targeted. As far as A′ is concerned, its proximity to A and the width of A’s emission lines made it unfeasible to extract a reliable spectroscopic redshift.
Source A was assigned a redshift of derived by fitting a Gaussian profile to the HeII emission line, a non-resonant line, therefore not affected by absorption. HeII is also the strongest emission line in this part of the spectrum. McCarthy et al. (1990) had previously assigned a redshift of through optical spectroscopy while Eales & Rawlings (1996) found through near-infrared spectroscopy that the H line was redshifted by km s-1. Results from Eales & Rawlings (1996) are consistent with the revised redshift derived from the FORS2 data. The McCarthy et al. (1990) redshift is however consistent with the redshift of companion B (). B is the brightest source in the -band.
Sources A, B and D of MRC 0156-252 show AGN signatures with prominent CIV, HeII and CIII] emission. Their clearly distinct continuum and emission lines (see Figure 4) indicate that these sources are separated. The detected lines are therefore not a signature of extended halos of the radio galaxy but of individual galaxies, although extended CIV and HeII halos are commonly found in radio galaxies (Villar-Martín et al. 2007). The emission lines of source D show a spatial extension to the south however, indicating that the cloud-like extension to the south of D is associated with D and not just an additional independent source along the line of sight.
Several radio galaxies are also known to have companion AGNs. De Breuck et al. (2010) presented the Spitzer/IRAC follow-up of a sample of 70 radio galaxies and found that at least four have companions within with mid-infrared colours consistent with AGN. The spectroscopic follow-up of one of them, 7C 1756-152 at , showed a companion AGN, offset by from the radio galaxy (Galametz et al. 2010b).
These results, including the clumpy morphology of the radio galaxies (evident for MRC 0156-252; see Figure 1), could be suggestive of merger-triggered AGN activity, as predicted by several models of galaxy evolution (e.g., Hopkins et al. 2008). All three AGN in MRC 0156-252 are type-2, or obscured AGN whose obscuration could be primarily caused by galaxy-scale gas and dust. The strong feedback associated with these multiple powerful AGN could rapidly expel gas from the merging central galaxy of this (proto)cluster, shutting down star formation and leading to the old, red ellipticals that we see associated with rich environments in the local universe.
Table 1 lists the redshifts and velocity dispersions of the detected emission lines of sources A, B and D. Redshifts were assigned by fitting single Gaussian profiles to the emission lines. Velocity offsets are derived relative to the HeII line of source A. The redshifts of A, B and D listed in Table 2 correspond to the redshift derived from the HeII line. A large range of velocity shifts is observed between the different companions (i.e., hundreds of km s-1). Velocity shifts vary from a couple of hundreds to km s-1, a result similar to the range of velocities observed among the different components of PKS 1138-262 (Kuiper et al. 2011).
| Source | Line | Spec. z | Velocitya |
|---|---|---|---|
| km s-1 | |||
| A | Ly | ||
| CIV | |||
| HeII | |||
| CIII] | |||
| B | Ly | ||
| CIV | |||
| HeII | |||
| D | Ly | ||
| CIV | |||
| HeII | |||
| CIII] |
-
a
Relative to the HeII emission line of the radio galaxy (source A).

6 A galaxy structure at z = 2.02
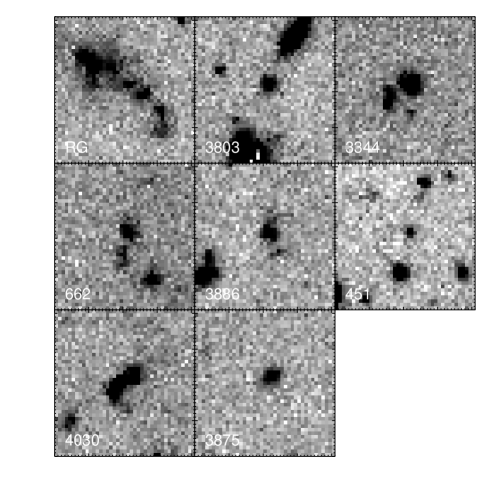
The distribution of spectroscopic redshifts in Figure 3 clearly shows a peak at . Ten galaxies, including the radio galaxy, have redshifts within , corresponding to velocity offsets km s-1 relative to (nine within km s-1). Adopting a biweight estimator (Beers et al. 1990) for galaxy clusters with a small number of confirmed members, we estimate a line-of-sight velocity dispersion of km s-1, or km s-1 when only considering members within . Spectra of the structure members and -band images are shown in Figure 5 and Figure 6, respectively. They were all IRAC-selected galaxies; four were also selected as b- galaxies. Except for the radio galaxy companions, all spectroscopically confirmed structure members are classical star-forming galaxies.
With a limited number of galaxies confirmed with spectroscopy, it is premature to draw conclusions on the nature of the galaxy structure. It could either be an already assembled, relaxed galaxy cluster or a protocluster still in formation. We will take a closer look at these possibilities below.
6.1 A large-scale structure
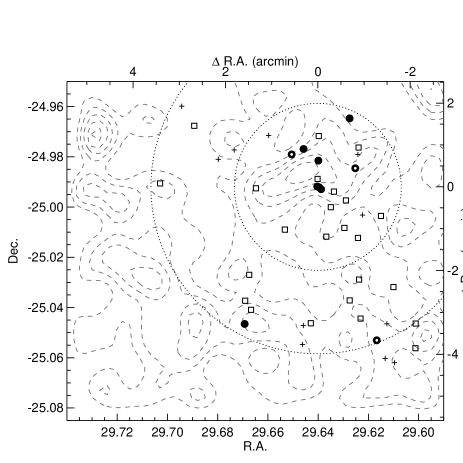
Figure 7 shows the spatial distribution of the structure members alongside other sources with a spectroscopic redshift from our FORS2 run. Five structure members (not including the radio galaxy companions) were found within Mpc of the radio galaxy. The two other confirmed members were found at a proper distance of Mpc south/south-east of MRC 0156-252. Both G10 and G12 suggested that the galaxy structure associated with MRC 0156-252 may extend to the south east with a second overdensity of both b- and IRAC-selected galaxies found Mpc away from the radio galaxy (i.e., R.A. ; Dec. ). This FORS2 spectroscopic follow-up of the structure focused on confirming cluster members near the radio galaxy and only a few high-redshift galaxy candidates were targeted in that second overdensity. However, source #662 in that structure was confirmed at which suggests this second overdensity may also be associated with the galaxy structure in which MRC 0156-252 is embedded. Since both the near-infrared and IRAC data only cover the radio galaxy surroundings and immediate south east region (G10), we do not rule out that the structure could also extend beyond our field of view.
6.2 A red sequence?
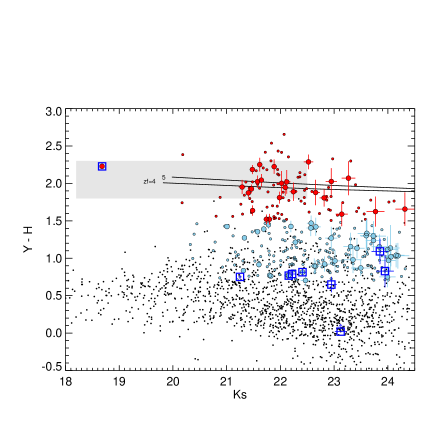
Figure 8 shows the distribution of sources in the surroundings of MRC 0156-252 in a versus colour-magnitude diagramme (see G10 for details on the photometry). The -selected galaxies i.e., galaxy candidates at , show the classical bimodal distribution in colours observed for galaxies up to at least (Williams et al. 2009) with two distinct populations of galaxies with blue and red near-infrared colours, isolated by design by a colour cut. We note however that the red candidates within Mpc of the radio galaxy preferentially lie on a ‘sequence’, similar to the red sequence observed in virialized galaxy clusters. The mean of the red galaxies is with a -clipped scatter of , a colour consistent with red sequence models at with (G10).
We isolate the bright end of the potential proto-cluster red sequence i.e., galaxies with , (see Fig. 8, gray box; sources) and compare its density to field surveys. We made use of the public multiwavelength catalogue of the CANDELS UDS field (Galametz et al. 2013) which contains sources over an area of square arcmin. The CANDELS UDS field was also imaged by VLT/HAWK-I bands as well as UKIRT/WFCAM -band (UKIDSS DR8), consistent with the VLT/HAWK-I filter. No filter correction is therefore required. The average density of the r--selected galaxies with derived from the UDS is per square degree. The density of such sources in the immediate surroundings of MRC 0156-252 (i.e., Mpc at ) is per square degree i.e., times higher than in the field.
Apart from the radio galaxy, the brightest red candidates have a , similar to the bright end limits of the suspected red sequences of both CL J1449+0856 (at ; Gobat et al. 2011) and IDCS J1426+3508 (; Stanford et al. 2012, ). The only two red galaxies confirmed to reside in the Spider Web galaxy protocluster also have (Doherty et al. 2010). These two galaxies, both confirmed from H emission spectroscopy, are amongst the brightest galaxies in that field in the near-infrared.
Unfortunately, we did not confirm any red candidate at in the surrounding of MRC 0156-252. All spectroscopic member galaxies except the radio galaxy have very blue colours. Further spectroscopy at redder wavelengths will be necessary to confirm the presence of a red sequence in the galaxy structure.
6.3 X-ray extended emission from the ICM?
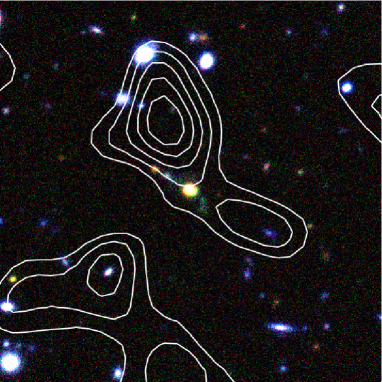
The field of MRC 0156-252 was imaged by Chandra (Overzier et al. 2005; O05 hereafter) for ks. Along with the study of non-thermal X-ray emission from the radio galaxy core and extended emission from the radio lobes, O05 searched for evidence of extended thermal X-ray emission from a potential intracluster medium (ICM). MRC 0156-252 was the only field in their sample of five radio galaxies at that showed a trace of extended X-ray emission. Figure 9 shows the X-ray contours of this extended emission — obtained by smoothing the original keV X-ray image by a FWHM Gaussian kernel after removing the X-ray counts from the radio galaxy and point sources in the field — overlaid on a 3-colour image of the region around MRC 0156-252.
O05 estimated a tentative erg cm-2 s-1 for the keV unabsorbed flux for the extended emission. Similar X-ray flux estimations were derived in galaxy proto-clusters at comparable high redshifts (Tanaka et al. 2010; Papovich et al. 2010; Gobat et al. 2011), although, as for the MRC 0156-252 field, both these proto-clusters also host a number of X-ray AGN that made it challenging to estimate a reliable X-ray flux for the ICM. These estimations are still however times fainter than the X-ray emission in the highest redshift confirmed X-ray selected galaxy clusters (e.g., ; Fassbender et al. 2011) or mid-infrared selected galaxy clusters (; Stanford et al. 2012) and (; Brodwin et al. 2011) which are most probably more advanced collapsed galaxy structures than the present proto-cluster.
No overdensity of red galaxies is visible at the position of the X-ray emission (Fig. 9). Although O05 also found evidence for extended X-ray emission related to inverse Compton processes in the regions covered by the extended radio structure of MRC 0156-252, these regions were excluded entirely when searching for the large-scale extended emission shown in Fig. 9. However, due to its closeness to the radio galaxy and its extension to both sides of the radio galaxy along the radio axis could indicate that inverse Compton scattering of cosmic microwave background (CMB) photons is occurring at much larger scales than those probed by the present radio morphology of MRC 0156-252. Finoguenov et al. (2010) lists a sample of inverse Compton ‘ghosts’ associated with radio jets whose X-ray fluxes are consistent with the X-ray extended emission found in the field of MRC 0156-252. Recent works also suggest that the ICM X-ray emission could also come from the far-infrared photons associated from dusty starbursts (see, e.g., Smail & Blundell 2013).
This result unfortunately shows a major limitation of the technique of searching for high-redshift galaxy clusters in the vicinity of radio galaxies since it is challenging to disentangle faint extended, thermal emission of a potential (proto-)ICM from thermal/non-thermal extended X-ray emission associated with the radio galaxy itself. No further interpretation can be made at this point. Deeper X-ray observations will be necessary to draw any firm conclusions.
We further note that high-redshift clusters often host AGN (e.g., Eastman et al. 2007; Martini et al. 2006, 2007; Galametz et al. 2009b; Pentericci et al. 2013), and even without issues such as the inverse Compton scattering of the CMB in the radio jets/lobes of radio-loud AGN, disentangling extended ICM emission from nuclear AGN X-ray emission will be a challenge for distant clusters searches in low spatial resolution surveys such as eROSITA.
7 Summary
We have used optical multi-object spectroscopy with VLT/FORS2 to target high-redshift galaxy candidates in the field of the radio galaxy MRC 0156-252 at .
We have assigned spectroscopic redshifts to sources, including galaxies at . The large majority of the confirmed high-redshift sources are starburst galaxies.
The spectroscopic follow-up of two close-by companions of the radio galaxy (sources B and D) showed large velocity offsets of hundreds of km s-1.They both show obscured AGN signatures. A new -band optical image shows that MRC 0156-252 has a very clumpy morphology. Higher-resolution imaging or spectroscopy is now required to shed light on what processes are precisely occurring in the vicinity of the radio galaxy and on the possible origins of the AGN activity (e.g., merger-triggered?).
The spectroscopic follow-up confirmed the presence of a high-redshift galaxy structure at associated with MRC 0156-252. Ten members (including sources A, B and D) were found with redshifts within , corresponding to velocity offsets km s-1 at . Although the small number of spectroscopically confirmed galaxy members do not permit us to draw firm conclusions regarding the precise nature of this galaxy structure, complementary pieces of evidence (i.e., analysis of a possible red sequence and X-ray data) suggest the galaxy structure associated with MRC 0156-252 is a forming galaxy cluster i.e., a proto-cluster. In particular, when selecting the bright red near-infrared selected galaxy candidates with colour consistent with red sequence models at (with ), the field was found times denser than control field. The distribution of the high-redshift galaxy candidates in the field shows a secondary peak in the South East, Mpc away from the main clump. One galaxy in this secondary peak was spectroscopically confirmed to lie at a redshift consistent with suggesting that the galaxy structure associated with MRC 0156-252 is embedded in a larger scale structure.
References
- Bayliss et al. (2013) Bayliss, M. B. et al. 2013, ArXiv e-prints
- Beers et al. (1990) Beers, T. C., Flynn, K., & Gebhardt, K. 1990, AJ, 100, 32
- Bertin & Arnouts (1996) Bertin, E. & Arnouts, S. 1996, A&AS, 117, 393
- Brodwin et al. (2011) Brodwin, M. et al. 2011, ApJ, 732, 33
- Castellano et al. (2007) Castellano, M. et al. 2007, ApJ, 671, 1497
- De Breuck et al. (2010) De Breuck, C. et al. 2010, ApJ, 725, 36
- Doherty et al. (2010) Doherty, M. et al. 2010, A&A, 509, 83
- Eales & Rawlings (1996) Eales, S. A. & Rawlings, S. 1996, ApJ, 460, 68
- Eastman et al. (2007) Eastman, J. et al. 2007, ApJ, 664, L9
- Eisenhardt et al. (2008) Eisenhardt, P. R. M. et al. 2008, ApJ, 684, 905
- Fassbender et al. (2011) Fassbender, R. et al. 2011, New Journal of Physics, 13, 125014
- Fazio et al. (2004) Fazio, G. G. et al. 2004, ApJS, 154, 10
- Finoguenov et al. (2010) Finoguenov, A. et al. 2010, MNRAS, 403, 2063
- Foley et al. (2011) Foley, R. J. et al. 2011, ApJ, 731, 86
- Galametz et al. (2009a) Galametz, A. et al. 2009a, A&A, 507, 131
- Galametz et al. (2009b) —. 2009b, ApJ, 694, 1309
- Galametz et al. (2010a) —. 2010a, A&A, 522, A58+
- Galametz et al. (2010b) —. 2010b, A&A, 516, A101+
- Galametz et al. (2012) —. 2012, ApJ, 749, 169
- Galametz et al. (2013) —. 2013, ApJS, 206, 10
- Garilli et al. (2010) Garilli, B. et al. 2010, PASP, 122, 827
- Gobat et al. (2011) Gobat, R. et al. 2011, A&A, 526, A133+
- Gobat et al. (2013) —. 2013, ArXiv e-prints
- Hayashi et al. (2010) Hayashi, M. et al. 2010, MNRAS, 402, 1980
- Hopkins et al. (2008) Hopkins, P. F. et al. 2008, ApJS, 175, 356
- Jimenez & Verde (2009) Jimenez, R. & Verde, L. 2009, Phys. Rev. D, 80, 127302
- Kajisawa et al. (2006) Kajisawa, M. et al. 2006, MNRAS, 371, 577
- Koyama et al. (2013) Koyama, Y. et al. 2013, MNRAS, 428, 1551
- Kuiper et al. (2011) Kuiper, E. et al. 2011, MNRAS, 415, 2245
- Kurk et al. (2009) Kurk, J. et al. 2009, A&A, 504, 331
- Kurk et al. (2004) Kurk, J. D. et al. 2004, A&A, 428, 793
- Large et al. (1981) Large, M. I. et al. 1981, MNRAS, 194, 693
- Lidman et al. (2008) Lidman, C. et al. 2008, A&A, 489, 981
- Lotz et al. (2013) Lotz, J. M. et al. 2013, ApJ, 773, 154
- Martini et al. (2006) Martini, P., Kelson, D. D., Kim, E., Mulchaey, J. S., & Athey, A. A. 2006, ApJ, 644, 116
- Martini et al. (2007) Martini, P., Mulchaey, J. S., & Kelson, D. D. 2007, ApJ, 664, 761
- McCarthy (1993) McCarthy, P. J. 1993, PASP, 105, 1051
- McCarthy et al. (1990) McCarthy, P. J. et al. 1990, AJ, 100, 1014
- McCarthy et al. (1992) —. 1992, ApJ, 386, 52
- Nastasi et al. (2011) Nastasi, A. et al. 2011, A&A, 532, L6
- Overzier et al. (2005) Overzier, R. A. et al. 2005, A&A, 433, 87
- Overzier et al. (2008) —. 2008, ApJ, 673, 143
- Papovich (2008) Papovich, C. 2008, ApJ, 676, 206
- Papovich et al. (2010) Papovich, C. et al. 2010, ApJ, 716, 1503
- Pentericci et al. (1999) Pentericci, L. et al. 1999, A&A, 341, 329
- Pentericci et al. (2000) —. 2000, A&A, 361, L25
- Pentericci et al. (2001) —. 2001, ApJS, 135, 63
- Pentericci et al. (2013) —. 2013, A&A, 552, A111
- Planck Collaboration (2013) Planck Collaboration. 2013, arXiv:1303.5080
- Seymour et al. (2007) Seymour, N. et al. 2007, ApJS, 171, 353
- Smail & Blundell (2013) Smail, I. & Blundell, K. 2013, ArXiv e-prints
- Stalder et al. (2013) Stalder, B. et al. 2013, ApJ, 763, 93
- Stanford et al. (2006) Stanford, S. A. et al. 2006, ApJ, 646, L13
- Stanford et al. (2012) —. 2012, ApJ, 753, 164
- Steidel et al. (2005) Steidel, C. C. et al. 2005, ApJ, 626, 44
- Stern et al. (2005) Stern, D. et al. 2005, ApJ, 631, 163
- Stern et al. (2012) —. 2012, ApJ, 753, 30
- Tanaka et al. (2010) Tanaka, M., Finoguenov, A., & Ueda, Y. 2010, ApJ, 716, L152
- Tanaka et al. (2007) Tanaka, M. et al. 2007, MNRAS, 377, 1206
- Tanaka et al. (2013) —. 2013, ApJ, 772, 113
- Tran et al. (2010) Tran, K.-V. H. et al. 2010, ApJ, 719, L126
- Vanderlinde et al. (2010) Vanderlinde, K. et al. 2010, ApJ, 722, 1180
- Venemans et al. (2004) Venemans, B. P. et al. 2004, A&A, 424, L17
- Venemans et al. (2007) —. 2007, A&A, 461, 823
- Villar-Martín et al. (2007) Villar-Martín, M. et al. 2007, MNRAS, 378, 416
- Williams et al. (2009) Williams, R. J. et al. 2009, ApJ, 691, 1879
- Wuyts et al. (2009) Wuyts, S. et al. 2009, ApJ, 706, 885
- Wylezalek et al. (2013) Wylezalek, D. et al. 2013, ApJ, 769, 79
- Zirm et al. (2008) Zirm, A. W. et al. 2008, ApJ, 680, 224
Appendix A Spectroscopic redshifts
| ID | R.A.a | Dec.a | Selection | b | Absorption / Emission linesc | Galaxy type |
| J2000 | J2000 | or spectral features | ||||
| 4352 | 01:58:33.48 | -24:59:32.01 | Comp. A | Ly∗; CIV∗; HeII∗; CIII]∗ | RG | |
| 4351 | 01:58:33.68 | -24:59:30.56 | Comp. B | Ly∗; CIV∗; HeII∗; CIII]∗ | Type-2 AGN | |
| 4365 | 01:58:33.31 | -24:59:34.48 | Comp. D | Ly∗; CIV∗; HeII∗; CIII]∗ | Type-2 AGN | |
| 3803 | 01:58:34.99 | -24:58:36.83 | IRAC | SiII1260; OI/SiII; CII; SiIV; SiII1526; CIV; FeII; AlII | star-forming | |
| 3344 | 01:58:30.59 | -24:57:52.92 | IRAC | SiII1260; OI/SiII; CII; SiIV; SiII1526; CIV; FeII; AlII; | ||
| SiII1808; AlIII | star-forming | |||||
| 662 | 01:58:40.62 | -25:02:47.57 | b-/IRAC | CII; SiII1526; CIV; HeII; SiII1808 | star-forming | |
| 3886 | 01:58:33.58 | -24:58:53.48 | IRAC | SiII1260; OI/SiII; CII; SiIV; CIV; AlII; SiII1808 | star-forming | |
| 451 | 01:58:28.00 | -25:03:10.98 | b-/IRAC | (B) | OI/SiII; CII; SiII1526; CIV; AlII | star-forming |
| 4030 | 01:58:30.05 | -24:59:04.44 | IRAC | (B) | Ly∗; SiII1260; CII; CIV | star-forming |
| 3875 | 01:58:36.13 | -24:58:44.60 | b-/IRAC | (B) | SiII1526; CIV; AlIII | star-forming |
-
a
Coordinates are derived from the -band pre-imaging.
-
b
Quality B redshifts are marked by ‘(B)’
-
c
Emission lines are marked by an asterisk.
| ID | R.A.a | Dec.a | Selection | b | Absorption / Emission linesc | Galaxy type |
| J2000 | J2000 | or spectral features | ||||
| 641 | 01:58:24.28 | -25:02:47.07 | IRAC | Ly∗; CIV∗ | ||
| 1794 | 01:58:30.94 | -24:59:50.50 | r-/IRAC | CII; OI/SiII; SiII1260; SiIV; SiII1526; AlII | star-forming | |
| 4228 | 01:58:33.66 | -24:59:19.82 | b- | OI/SiII; SiII1260; CII; SiII1526; CIV | star-forming | |
| 2024 | 01:58:27.60 | -25:00:12.73 | IRAC | Ly∗; CII; SiII1526 | ||
| 4314 | 01:58:48.71 | -24:59:26.14 | b-/IRAC | Ly∗; OI/SiII; CII; SiII1526; CIV | star-forming | |
| 741 | 01:58:29.55 | -25:02:39.78 | b-/IRAC | Ly (strong abs.); OI/SiII; CII; SiII1526; AlII; SiII1808 | star-forming | |
| 4439 | 01:58:32.09 | -24:59:37.91 | b- | OI/SiII; CII; SiII1260; SiIV; SiII1526; AlII, AlIII | star-forming | |
| 3432 | 01:58:45.44 | -24:58:03.60 | IRAC | OI/SiII; CII; SiIV; CIV | star-forming | |
| 2376 | 01:58:29.80 | -25:00:44.32 | IRAC | OI/SiII; SiIV; CIV | star-forming | |
| 2250 | 01:58:36.78 | -25:00:32.39 | b-/IRAC | OI/SiII; CIV; CII | star-forming | |
| 1240 | 01:58:26.41 | -25:01:54.71 | r- | CIV∗; HeII∗ | Type-2 AGN | |
| 696 | 01:58:34.30 | -25:02:46.55 | r-/IRAC | Ly∗; CIV∗ | Type-2 AGN | |
| 3043 | 01:58:40.18 | -25:01:37.14 | b-/IRAC | Ly∗; OI/SiII; SiII1526; AlII | star-forming | |
| 316 | 01:58:24.30 | -25:03:22.26 | b-/IRAC | OI/SiII; CII; SiIV; SiII1526; CIV; FeII; OIII; AlII | star-forming | |
| 3812 | 01:58:29.73 | -24:58:34.77 | b- | OI/SiII; SiII1526; CIV; AlII | star-forming | |
| 1414 | 01:58:29.69 | -25:01:43.90 | IRAC | Ly∗; SiII526; CIV | ||
| 3622 | 01:58:33.54 | -24:58:18.21 | IRAC | OI/SiII; CII; SiIV; SiII1526; CIV | star-forming | |
| 1011 | 01:58:30.58 | -25:02:13.87 | IRAC | (B) | CIV | |
| 2358 | 01:58:32.82 | -25:00:42.43 | IRAC | CII; SiII1526; SiIV | star-forming | |
| 1901 | 01:58:32.39 | -25:00:00.27 | IRAC | SiIV; CIV; OIII | star-forming | |
| 4280 | 01:58:39.54 | -24:59:33.21 | IRAC | (B) | OI/SiII; SiIV; CIV | star-forming |
| 2225 | 01:58:31.09 | -25:00:30.00 | IRAC | OI/SiII; SiIV; SiII1526; CIV; AlII; AlIII | star-forming | |
| 874 | 01:58:40.01 | -25:02:27.34 | b-/IRAC | CIV∗; HeII∗ ; CIII]∗; MgII∗ | QSO | |
| 1019 | 01:58:40.57 | -25:02:14.33 | b-/IRAC | CII; SiIV; CIV; AlII | star-forming | |
| 168 | 01:58:27.19 | -25:03:36.90 | IRAC | [OII]∗ | ||
| 3850 | 01:58:29.80 | -24:58:44.71 | IRAC | [OII]∗; Balmer break | ||
| 3795 | 01:58:41.62 | -24:58:38.19 | IRAC | [OII]∗; Å break | ||
| 268 | 01:58:35.09 | -25:03:17.03 | IRAC | [NeV]3426∗; [OII]; Balmer absorption series | Type-2 AGN | |
| 130 | 01:58:26.31 | -25:03:43.08 | b- | [OII]∗ | ||
| 2025 | 01:58:29.36 | -25:00:11.47 | IRAC | [OII]∗; [NeIII]3967∗; H∗; H∗; [OIII]5007∗ | ||
| 3642 | 01:58:38.33 | -24:58:17.40 | mid-IR AGN | [OII]∗; H∗; [OIII]5007∗ | ||
| 3890 | 01:58:43.14 | -24:58:51.56 | Alignment | [OII]∗; E+A | ||
| 1663 | 01:58:46.63 | -24:57:35.52 | Alignment | [OII]∗; CaHK | ||
| 474 | 01:58:27.03 | -25:02:47.32 | Alignment | CaHK | ||
| 443 | 01:58:35.02 | -25:02:49.86 | Alignment | [OII]∗; H∗; [OIII]5007∗ |
-
a
Coordinates are derived from the -band pre-imaging.
-
b
Quality B redshifts are marked by ‘(B)’
-
c
Emission lines are marked by an asterisk.