The hard X-ray behavior of Aql X-1 during type-I bursts
Abstract
We report the discovery of an anti-correlation between the soft and the hard X-ray lightcurves of the X-ray binary Aql X-1 when bursting. This behavior may indicate that the corona is cooled by the soft X-ray shower fed by the type-I X-ray bursts, and that this process happens within a few seconds. Stacking the Aql X-1 lightcurves of type-I bursts, we find a shortage in the 40–50 keV band, delayed by 4.51.4 s with respect to the soft X-rays. The photospheric radius expansion (PRE) bursts are different in that neither a shortage nor an excess shows up in the hard X-ray lightcurve.
Subject headings:
stars: coronae — stars: neutron — X-rays: individual(Aql X-1) — X-rays: binaries — X-rays: bursts1. Introduction
A low-Mass X-ray Binary (LMXB) is a system with either a neutron star (NS) or a black hole (BH) accreting material from a companion star (in general having a mass ), usually via a Roche-Lobe overflow settling into an accretion disk. Many LMXBs show periods of high activities, referred to as outbursts, which are probably triggered by changes in the mass accretion rate. Basically, there are two components (an optically thick blackbody like component in the soft X-ray band and a power law with cutoff component in the hard X-ray band) in the outburst spectrum of a LMXB. It is thought that the power law component is caused by inverse Comptonization of the hot plasma (i.e. the corona, see the case of 4U 1608522 Zhang et al., 1996); the seed photons being the optically thick blackbody like component. However, no consensus has been reached on the corona formation model, and both disk evaporation (Meyer et al., 1994; Esin et al., 1997; Liu et al., 2007; Frank et al., 2002) and magnetic reconnection models (Zhang et al., 2000; Mayer & Pringle, 2007; Zhang, 2007) are entertained. The timescale of the corona formation/heating is key to distinguish between these models. The typical timescale for disk evaporation and magnetic reconnection models are days (Meyer et al., 1994; Esin et al., 1997; Liu et al., 2007; Frank et al., 2002) and milliseconds (Zhang et al., 2000; Mayer & Pringle, 2007; Zhang, 2007), respectively.
Type-I X-ray bursts are caused by unstable burning of the accreted hydrogen/helium on the surface of a NS enclosed in an XRB, and manifest themselves as a sudden increase (typically by a factor of 10 or greater) in the X-ray luminosity followed by an exponential decay (for reviews, see Lewin et al., 1993; Cumming, 2004; Strohmayer & Bildsten, 2006; Galloway et al., 2008). The most luminous bursts are the photospheric radius expansion (PRE) events, for which the peak flux is comparable to the Eddington luminosity at the surface of the NS.
The spectral behavior of the outbursts (i.e., persistent/accretion emission from the accretion disk and corona) might be affected by the bursts themselves. In fact, a hard X-ray flux decrease was hinted at during a burst of Aquila X-1 (Aql X-1, also named 4U 1908+005) observed with RXTE/HEXTE, but with a significance of only 2 (Maccarone & Coppi, 2003). Effects at energies lower than 30 keV were reported by Worpel et al. (2013); Zand et al. (2013).
Aql X-1 is a transient NS XRB, classified as an atoll source (Reig et al., 2000). It is one of the three NS XRBs which show hysteresis in state transition (Gladstone et al., 2007); the other two being 4U 1608-522 (Maitra & Baily, 2004) and IGR J17473-2721 (Zhang et al., 2009; Chen et al., 2010, 2011). Tens of type-I bursts were detected during the outbursts of Aql X-1. Among them, roughly one third are PRE bursts (Galloway et al., 2008). In this paper, we report on a detailed analysis of all RXTE/PCA observations on Aql X-1, with the aim of gathering information about the timescales of formation of its corona.
2. Observations and results
2.1. Bursts selection
Aql X-1 was frequently monitored by RXTE during its service till 2012. The analysis of the PCA data is performed using HEAsoft v.6.6. The data are filtered using the standard RXTE/PCA criteria. Only the data from the PCU2 (the third Proportional Counters Unit, in the 0-4 numbering scheme) are used for the analysis, because this PCU was 100% on during all the observations. The dead time correction is made to all the spectra and lightcurves following the standard procedure described at the HEASARC website.
From all available RXTE/PCA pointing observations on Aql X-1, we carried out a systematic search for bursts in the lightcurve of Aql X-1. Only the bursts observed by PCA in Eu64M1s mode (events are time-stamped with 125-microsec resolution, in 64 PHA channel bands with the ‘M’ channel distribution/binning scheme starting at channel 0, and are read out every 1 second) are chosen for analysis, which have enough energy bands and good time resolution. We picked up 39 bursts to constitute a sample, among which 13 are PRE events (Table 1).
2.2. Data analysis
During the bursts, the persistent/accretion and the burst emission are mixed. In order to investigate persistent/accretion emission changes during the type-I X-ray burst, we analyze the spectra and lightcurves by subtracting the pre-burst emission (including instrumental background and persistent/accretion flux of the neutron star).
The burst spectrum is well modeled by a blackbody with a characteristic temperature of a few keV. The burst emission can reach , and dominates the total emission at energies well below 40 keV, above which the persistent/accretion emission from the corona takes over. The average of the 40–50 keV, persistent count rates recorded by RXTE/PCA for non-PRE and PRE bursts are 0.370.05 cts/s and 0.050.04 cts/s, respectively.
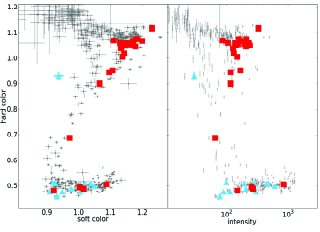
Because the flux in the 40–50 keV band is very faint to be detected during single bursts, especially when the instrument background is 1 cts/s, which is much higher than the persistent/accretion and bursts emission in the same energy band, we stack the individual lightcurves. For each burst, we use the time of its peak in the 2–10 keV as a reference to produce the lightcurve of each burst in the 2–10 keV band as well as in the 40–50 keV band. The fluxes recorded 48 seconds before and 80 seconds after the reference time are regarded as the persistent/accretion flux and are subtracted for each burst in timing analysis. The results are stable with reasonable changes of the time period where the persistent/accretion count rate is estimated. After the persistent emission is subtracted, we separate the PRE bursts from the non-PRE bursts. From the the Color-color diagram (CCD) and Hardness-Intensity diagram (HID) of Aql X-1 (Fig. 1), the non-PRE bursts and the PRE bursts are mostly located in the hard state and the soft state, respectively. Based on the CCD and HID, we subdivide the bursts into non-PRE bursts in the hard state, PRE bursts in the soft state, non-PRE bursts in the soft state and PRE bursts in the hard state. For the latter two groups, the number of bursts is too small to draw conclusion (Table 1). In this paper, only the former two groups (the non-PRE bursts in the hard state and the PRE bursts in the soft state) are stacked and averaged in each time bin, respectively.
2.3. Results
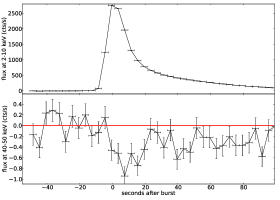
As shown in Fig. 2, for the non-PRE bursts in the hard state, the 40–50 keV flux of the combined 4s-binned lightcurve is mostly negative during the bursts occurrence and flat elsewhere. The 40–50 keV decrement reaches a maximum of -0.90.2 cts/s at the 2-10 keV burst peak, which amounts to the whole 40–50 keV persistent flux. A constant fit with a 1 s-bin light curve that ranges from 0 seconds to 15 seconds results in a of 74 under 15 dofs, suggesting a significance of 6 for the shortage.
By assuming that the spectrum of the corona is well described by a cutoff power law (cutoffpow model in XSPEC) with a photon index 1.25, we simulate the PCA spectra with different cutoff energy, fixed photon index and normalization. We find that the PCA flux in 40–50 keV is 0.37 cts/s, 0.24 cts/s, 0.11 cts/s, 0.06 cts/s and 0.01 cts/s for the cutoff energy of 40 keV, 30 keV, 20 keV, 15 keV, and 10 keV, respectively. This means that the PCA flux between 40 and 50 keV can drop by about one order of magnitude if the corona temperature is cooled from 40 keV to 10 keV, resulting in a significant shortage at hard X-rays while bursting. Assuming that the hard X-rays originate from the corona, this suggests that most of the corona is cooled by the soft photons of the bursts.
We perform a cross-correlation analysis between the two light curves at 2–10 keV and 40–50 keV, with a bin size of 1 s. In this procedure, 1 s-bin lightcurves were adopted because for a smaller time interval, e.g. 0.5 s, the poor statistics prevents from estimating a time lag. The cross-correlation, see Fig. 3, shows that the shortage at 40–50 keV lags that at 2–10 keV by 1.81.5 s. In order to estimate the error, we sampled the two lightcurves by assuming that the flux in each bin has a Gaussian distribution, and estimated the time delay with a cross-correlation method. By sampling the lightcurve a thousand times, the distribution of the resulted time delay was fitted with a Gaussian to infer the error.
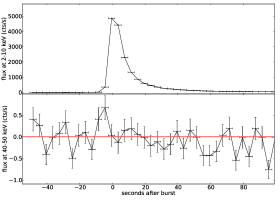
A similar analysis procedure is carried out on the PRE bursts in the soft state as well. In the 40–50 keV light curves, no hint of a shortage nor an excess is present around the soft X-ray peak. As shown in Fig. 2, the 40–50 keV lightcurve hovers around zero during/around the burst. A constant fit to this light curve gives a of 9.0 under 5 dofs, consistent with no deviation.
3. Discussion
3.1. Additional corona cooling by the bursts
We have found an anti-correlation of the soft and hard X-ray lightcurves of Aql X-1 when bursting, which likely indicates a cooling of the corona by the soft X-ray showers of the bursts. This reveals a cooling/heating timescale of less than a few seconds. These results are similar to those previously found for IGR J17473-2721 (Chen et al., 2012), perhaps hinting at a generic behavior of NS XRBs.
When bursts do not occur, the corona cooling is driven by the soft photons from the disk. Therefore a timescale of a few days reflects the actual timescale of the soft disk photon field, e.g. the viscous timescale of the disk. When bursts happen, their soft photons overwhelm those from the disk and provide additional cooling in a short time (typically of tens of seconds). The anti-correlation between hard and soft X-rays shows that the corona can be cooled and recovers quite fast (in seconds). Such short timescales for recovery is inconsistent with the disk evaporation model in which the formation of a corona is driven and energized by the disk accretion. Magnetic field reconnection can provide a viable alternative.
3.2. Persistent/accretion spectrum softens during the bursts
The PRE bursts are the most luminous events. Their fluxes can stay very close to the Eddington limit, accompanied with a drop of color temperature below 1 keV and an increment of the apparent radius to several tens kilometer. Although PRE bursts are brighter, no anti-correlation is found at hard X-rays. The PRE bursts of Aql X-1 are mostly located in the decaying phase of the outbursts and in the banana state of the CCD diagram (Fig. 1). The persistent flux at 40–50 keV is quite low (0.050.04 cts/s) during the PRE bursts, implying a weak corona and thus poor statistics for measuring a possible shortage.
The persistent/accretion flux in 2.5–25 keV has been found to increase by a factor of 20 during the PRE bursts of 40 sources by RXTE/PCA (Worpel et al., 2013).In their work, the possible influence of the burst upon the persistent flux was investigated via spectral fitting, where the spectrum was fitted jointly with the burst blackbody and the persistent spectral shape at 2.5–25 keV. A significant increment was derived for the persistent emission during the burst of PRE events (Worpel et al., 2013), and these authors claim that this phenomenon is also detected for the non-PRE bursts in their forthcoming paper.
If the persistent/accretion flux increased by a factor of 20 during the PRE bursts of Aql X-1, the flux of 40–50 keV () will be up to 0.0520 cts/s 1 cts/s. Considering the number of the PRE bursts , the 4-s time bin, and the instrument background ( 1 cts/s), the significance of the excess of the each time bin should be
| (1) |
However, we find no evidence for a hard X-ray increase during the bursts, neither for IGR J17473-2721 (Chen et al., 2012), nor for 4U 1636-536 (Ji et al., 2013), nor for Aql X-1 (this paper). In contrast, we find a shortage for the non-PRE bursts, which is opposite to the expectation that the accretion rate should increase during bursts.
An enhanced persistent/accretion flux is also detected in a joint observation by Chandra and RXTE/PCA in 0.5-30 keV (Zand et al., 2013), but with more soft excess and less hard X-ray emission. They suggest that the excess in the spectra during the bursts is due to that the bursts emission being reprocessed/reflected by the disk and re-emitted into the line of sight (Ballantyne, 2004). There is no conflict between the model above and our finding; i.e., during bursts, from the both observations (Worpel et al., 2013; Zand et al., 2013) in soft X-ray band and our findings in hard X-ray band, there is an increased soft X-ray flux and decreased hard X-ray flux.
References
- Ballantyne [2004] Ballantyne, D. R. 2004, MNRAS, 351, 57
- Chen et al. [2010] Chen, Y.-P., Zhang, S., Torres, D. F., et al. 2010, A&A, 510, A81
- Chen et al. [2011] Chen, Y.-P., Zhang, S., Torres, D. F., et al. 2011, A&A, 534, A101
- Chen et al. [2012] Chen, Y.-P., Zhang, S., Zhang, S.-N., et al. 2012, ApJ, 752, L34
- Cumming [2004] Cumming, A. 2004, Nucl. Phys. B Proc. Suppl., 132, 435
- Esin et al. [1997] Esin, A. A., McClintock, J. E., & Narayan, R. 1997, ApJ, 489, 865
- Frank et al. [2002] Frank, J., King, A. & Raine, J. 2002, Accretion Power in Astrophysics, Cambridge Univ. Press
- Galloway et al. [2008] Galloway, D. K., Muno, M. P., Hartman, J. M., et al. 2008, ApJS, 179, 360
- Gladstone et al. [2007] Gladstone, J., Done, C., & Gierlinski, M. 2007, MNRAS, 378, 13
- Harrison et al. [2010] Harrison, Fiona A., Boggs, Steve, Christensen, Finn et al. 2010, Space Telescopes and Instrumentation 2010: Ultraviolet to Gamma Ray. Edited by Arnaud, Monique; Murray, Stephen S.; Takahashi, Tadayuki. Proceedings of the SPIE, Volume 7732, pp. 77320S-77320S-8 (2010), arXiv:1008.1362
- Ji et al. [2013] Ji, L., Zhang, S, Chen, Y.-P. et al. 2013, MNRAS, 432, 2773
- Lewin et al. [1993] Lewin, W. H. G., van Paradijs, J., & Taam, R. E. 1993, Space Sci. Rev., 62, 223
- Liu et al. [2007] Liu, B. F., Taam, Ronald E., Meyer-Hofmeister, E. 2007, ApJ, 671, 695
- Maccarone & Coppi [2003] Maccarone, T. J. & Coppi, P. S. 2003, A&A, 399, 1151
- Maitra & Baily [2004] Maitra, D., & Bailyn, C. D. 2004, ApJ, 608, 444
- Mayer & Pringle [2007] Mayer, M. & Pringle, J. E. 2007, AIPConf.Proc.924:760-763 (astro-ph/0612752v1)
- Meyer et al. [1994] Meyer, F. & Meyer-Hofmeister, E. 1994, A&A, 288, 175
- Meyer-Hofmeister et al. [2012] Meyer-Hofmeister, E., Liu, B. F., Meyer, F., 2012, A&A, 544A, 87M
- Reig et al. [2000] Reig, P., Mndez, M., van der Klis, M., & Ford, E. C. 2000, ApJ, 530, 916
- Strohmayer & Bildsten [2006] Strohmayer, T., & Bildsten, L. 2006, New views of thermonuclear bursts (Compact stellar X-ray sources), 113, 156
- Walker [1992] Walker, M. A. 1992, ApJ, 385, 642
- Walker & Meszaros [1989] Walker, M. A. & Meszaros, P. 1989, ApJ, 346, 844
- Worpel et al. [2013] Worpel, H., Galloway, D. K., Price, D. J. 2013, arXiv:1303.4824
- Zand et al. [2013] Zand, J. J. M. in’t, Galloway, D. K., Marshall, H. L. et al. 2013, arXiv:1301.2232Z
- Zhang [2007] Zhang, S.-N. 2007, Highlights of Astronomy, 14, 41
- Zhang et al. [1996] Zhang, S.-N., Harmon, B. A., & Paciesas, W. S. 1996, A&AS, 120, 279
- Zhang et al. [2000] Zhang, S.-N., Cui, W., Chen, W., et al. 2000, Science, 287, 1239
- Zhang et al. [2009] Zhang, S., Chen, Y.-P., Wang, J.-M., et al. 2009, A&A, 502, 231
| No | ObsID | MJD | Fpeak (cts/s) | PRE | |
|---|---|---|---|---|---|
| 1 | 20098-03-08-00 | 50508.98 | 6983.32 | yes | S |
| 2 | 20092-01-05-00 | 50696.52 | 7188.68 | yes | S |
| 3 | 20092-01-05-030 | 50699.40 | 5099.40 | yes | S |
| 4 | 20092-01-05-07 | 50700.02 | 3776.07 | no | S |
| 5 | 20092-01-05-05 | 50701.54 | 3548.48 | no | S |
| 6 | 40047-03-02-00 | 51332.78 | 7109.68 | yes | S |
| 7 | 40047-03-06-00 | 51336.59 | 7177.73 | yes | S |
| 8 | 50049-01-04-02 | 51818.79 | 2963.57 | no | H |
| 9 | 50049-02-11-00 | 51851.40 | 4964.13 | no | S |
| 10 | 50049-02-13-01 | 51856.16 | 6223.50 | yes | S |
| 11 | 60054-02-01-01 | 52085.10 | 3419.08 | no | H |
| 12 | 60054-02-01-02 | 52086.04 | 3296.49 | no | H |
| 13 | 60054-02-02-01 | 52091.58 | 3227.50 | no | H |
| 14 | 60054-02-03-03 | 52100.80 | 5658.48 | yes | S |
| 15 | 60429-01-06-00 | 52324.99 | 6839.94 | yes | S |
| 16 | 70069-03-02-03 | 52347.18 | 5229.77 | yes | S |
| 17 | 70069-03-03-07 | 52351.88 | 2701.49 | no | S |
| 18 | 80403-01-05-00 | 53056.12 | 3158.50 | no | H |
| 19 | 91028-01-07-00 | 53468.29 | 3043.71 | no | H |
| 20 | 91028-01-09-00 | 53469.13 | 2897.51 | no | H |
| 21 | 91028-01-12-00 | 53470.99 | 3530.08 | no | H |
| 22 | 91028-01-13-00 | 53471.76 | 2795.50 | no | H |
| 23 | 91028-01-14-00 | 53472.21 | 2781.69 | no | H |
| 24 | 91028-01-18-00 | 53474.51 | 2525.70 | no | H |
| 25 | 91028-01-20-00 | 53476.03 | 2624.96 | no | H |
| 26 | 91028-01-21-00 | 53477.00 | 2761.38 | no | H |
| 27 | 91028-01-21-00 | 53477.01 | 992.11 | no | H |
| 28 | 91414-01-08-00 | 53715.16 | 3141.22 | no | H |
| 29 | 91414-01-08-03 | 53719.43 | 3312.39 | no | H |
| 30 | 91414-01-09-00 | 53720.16 | 3387.41 | no | H |
| 31 | 93076-01-03-00 | 54245.56 | 2395.18 | no | H |
| 32 | 93076-01-09-00 | 54251.53 | 3979.26 | no | H |
| 33 | 92438-01-02-01 | 54259.25 | 8079.84 | yes | T |
| 34 | 93405-01-03-07 | 54365.81 | 8005.16 | yes | S |
| 35 | 94076-01-04-01 | 55149.08 | 2966.77 | no | H |
| 36 | 94076-01-04-03 | 55151.19 | 3321.13 | no | H |
| 37 | 94076-01-05-02 | 55157.14 | 6655.43 | yes | S |
| 38 | 96440-01-09-07 | 55904.23 | 5830.69 | yes | S |
| 39 | 96440-01-09-01 | 55905.33 | 3577.68 | no | T |
-
State∗ when the bursts occurred, S=soft state, H=hard state, T= transition state.