Cold dust but warm gas in the unusual elliptical galaxy NGC 4125
Abstract
Data from the Herschel Space Observatory111Herschel is an ESA space observatory with science instruments provided by European-led Principal Investigator consortia and with important participation from NASA have revealed an unusual elliptical galaxy, NGC 4125, which has strong and extended submillimeter emission from cold dust but only very strict upper limits to its CO and HI emission. Depending on the dust emissivity, the total dust mass is M⊙. While the neutral gas-to-dust mass ratio is extremely low (), including the ionized gas traced by [CII] emission raises this limit to . The dust emission follows a similar profile to the stellar light and the dust to stellar mass ratio is towards the high end of what is found in nearby elliptical galaxies. We suggest that NGC 4125 is currently in an unusual phase where evolved stars produced in a merger-triggered burst of star formation are pumping large amounts of gas and dust into the interstellar medium. In this scenario, the low neutral gas-to-dust mass ratio is explained by the gas being heated to temperatures K faster than the dust is evaporated. If galaxies like NGC 4125, where the far-infrared emission does not trace neutral gas in the usual manner, are common at higher redshift, this could have significant implications for our understanding of high redshift galaxies and galaxy evolution.
1 Introduction
Early-type galaxies (ellipticals and lenticulars) are typically dominated by an old stellar population and contain at most a small fraction of their total mass in cold gas and dust. Recent surveys of nearby galaxies have detected CO emission in 5% of the elliptical galaxies in the ATLAS3D sample (Young et al., 2011) and submillimeter emission from cold dust in 24% of the elliptical galaxies in the Herschel Reference Survey (Smith et al., 2012). Unfortunately there are relatively few early-type galaxies that have been observed and detected in both dust and gas tracers. Leeuw et al. (2008) measured gas-to-dust mass ratios of in a sample of 7 elliptical galaxies. Smith et al. (2012) measure gas-to-dust mass ratios for 8 S0 galaxies that are consistent with or higher than the value of 100-150 typically found in spiral galaxies.
NGC 4125 (catalog ) is a luminous E6(pec) galaxy at a distance of 23.9 Mpc (Tonry et al., 2001), which underwent a merger and a burst of star formation 6-8 Gyr ago (Schwiezer & Seitzer, 1992; Pu et al., 2010). Its 60 m IRAS luminosity of L⊙ places it at the high luminosity end of the SAURON sample (Combes, Young, & Bureau, 2007). However, NGC 4125 is undetected in either HI or CO (Welch, Sage & Young, 2010); tight upper limits correspond to M⊙ (2, 8.7′ beam) and M⊙ (2, 21′′ beam) when using a CO-to-H2 conversion factor of H2 cm-2 (K km s-1)-1 (Strong et al., 1988). It has significant X-ray emission from hot gas, with at most a few percent contribution by an AGN (Boroson, Kim, & Fabbiano, 2011). It was selected as the “normal” elliptical galaxy for the Very Nearby Galaxies Survey with the Herschel Space Observatory (PI: C. D. Wilson). However, as we describe in this Letter, the interstellar medium (ISM) of NGC 4125 appears to be anything but normal.
2 Herschel observations
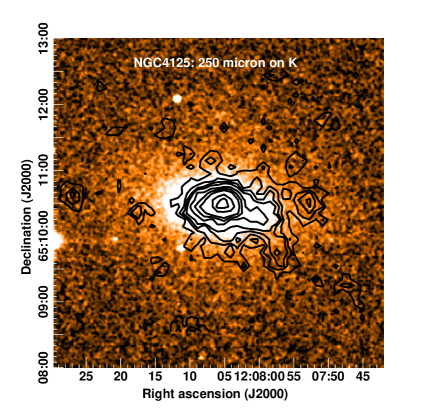
NGC 4125 was observed in scan map mode over a area with the Herschel Space Observatory with the Photodetector Array Camera and Spectrometer (PACS, Poglitsch et al., 2010, OBSIDs 1242188202, 1242188203) and the Spectral and Photometric Imaging Receiver (SPIRE, Griffin et al., 2010, OBSID 1242199156). The data processing and calibration for the SPIRE data are described in Bendo et al. (2012). For the PACS photometry, the level-1 data were downloaded from the Herschel Science Archive using HIPE 9.0 and the latest calibration (PACS_CAL_41_0) and mapped using Scanamorphos v21 (Roussel, 2013). NGC 4125 was observed in the [CII] 158 m, [NII] 122 m, and [OI] 63 m emission lines (OBSIDS 1342222063, 1342222064, 1342222065) using PACS in chop/nod mode with a single pointing covering . The maps were processed as described in Parkin et al. (2013) using HIPE and the PACSman package (Lebouteiller et al., 2012). The 250 m image of NGC 4125 is shown overlaid on the K-band image from 2MASS (Jarrett et al., 2003) in Figure 1.
The total continuum flux of NGC 4125 was measured using an elliptical aperture in diameter (62% of the optical size) with position angle 82o; the sky background was measured in an elliptical annulus with inner and outer diameters of 216′′ and 360′′. For the SPIRE data, in calculating the total flux, we adopt beam areas appropriate for emission going as of 432, 766 and 1573 square arcseconds at 250, 350, and 500 m, respectively, and apply the multiplicative color corrections appropriate for extended sources (SPIRE Data Reduction Guide, 2013). For the PACS data, we adopt the color corrections appropriate for a 20 K blackbody (Müller, Okumura, & Klaas, 2011). For both sets of maps, the uncertainties are calculated as the quadrature sum of the instrumental uncertainty in each pixel and the uncertainty due to the sky confusion. Calibration uncertainties of 7% for SPIRE (SPIRE Data Reduction Guide, 2013) and 5% for PACS (PACS Observer’s Manual, 2011) are added in quadrature to these measurement uncertainties in Table 1.
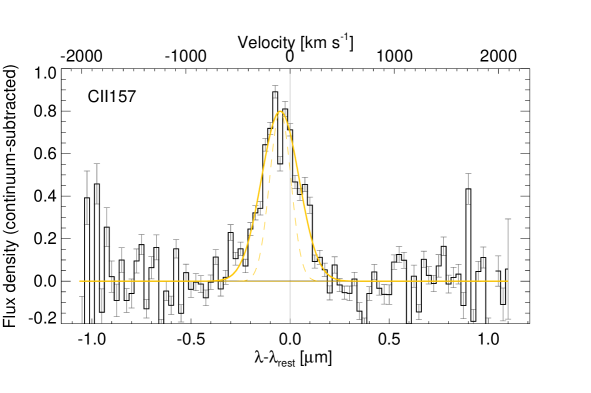
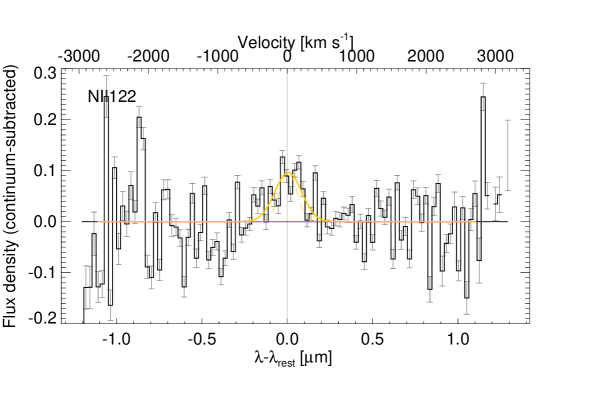
We have detected weak [CII] and [NII] emission (Figure 2). The peak [CII] flux in an 18′′ diameter aperture is W m-2 and the total flux summed in a 36′′ diameter aperture is W m-2. For [NII], the peak flux is W m-2 and the total flux is W m-2. The [OI] 63 m line is not detected, with a 2 upper limit to the total flux of W m-2. Calibration uncertainties are 30% for these spectroscopic data.
3 The gas-to-dust mass ratio in NGC 4125
One unusual aspect of the dust emission in NGC 4125 is that the emission is spatially extended and follows the general shape of the stellar emission (Figure 1). While previous optical extinction maps have shown a central dust lane aligned with the major axis (Goudfrooij et al., 1994), the Herschel images trace dust over a significantly larger area and the dust emission even follows the profile that is a common feature of ellipticals.
Fitting the global dust emission from 160 to 500 m with a modified blackbody with dust opacity going as gives an average dust temperature of K (Figure 3). The dust mass can be calculated as M⊙, where is the distance to the galaxy in Mpc, is the dust temperature in K, is the 250 m flux in Jy, and is the dust emissivity at 250 m in cm2 g-1. As our default, we assume a standard graphite plus silicate dust emissivity cm2 g-1 (Draine, 2003), which corresponds to and has also been used for previous analyses of elliptical galaxies (Parkin et al., 2012; Smith et al., 2012). We obtain a global dust mass for NGC 4125 of M⊙ (Table 2) and a mass in the peak resolution element of M⊙. Using the same distance and emissivity, our dust mass is a factor of 4 larger than that of Kaneda et al. (2011), who obtained a warmer dust temperature due to a lack of fluxes longward of 160 m.
The dust mass is rather sensitive to our assumptions about the grain properties. If we instead adopt the mixture of amorphous carbon and silicates explored for the Large Magellanic Cloud by Galliano et al. (2011), for which and cm2 g-1, we obtain a dust temperature of K and a total dust mass of M⊙. Performing the fit with allowed to vary between 1 and 2.5 returns a fit with and a temperature of K. Combining this temperature with cm2 g-1 gives similar dust masses to the amorphous carbon model of Galliano et al. (2011). We also note, however, that single temperature fits to spiral galaxies usually yield smaller dust masses than more realistic multiple temperature models (Dale et al., 2012). Fitting the data with two components with (Figure 3) gives temperatures of 17 and 51 K and a cold dust mass of M⊙. Although the 500 m flux lies somewhat above the fits, the excess emission is likely due to two faint ( mJy) point-like sources to the west of NGC 4125 (Figure 1). These sources contribute 20% of the total flux at 500 m but only 10% at 250 m and may be background galaxies.
We estimate a stellar mass of M⊙ from the 3.6 m flux in Dale et al. (2007) and the median mass-to-light ratio of 1.00 from Falcon-Barroso et al. (2011). The dust to stellar mass ratio of is towards the high end of the values seen for nearby elliptical galaxies (Smith et al., 2012; di Serego Alighieri et al., 2013). Comparing the global dust mass with the sum of the HI and H2 upper limits (Welch, Sage & Young, 2010) and including a factor of 1.36 to account for helium (Wilson et al., 1988) gives a global gas-to-dust ratio of . Because the areas covered by the three different measurements (HI, CO, dust) are very different, another relevant comparison is between the peak dust mass (18′′ beam) and the CO upper limit (21′′ beam). Comparing these two values gives a limit on the gas-to-dust mass ratio of . These upper limits are factors of 7-12 smaller than the typical gas-to-dust mass ratio of 150 seen in our own and other galaxies. Thus, there appears to be a deficit of neutral gas to go along with the cold dust in NGC 4125.
We can also estimate the gas mass associated with the observed [CII] emission. We assume that the [CII] emission comes from the ionized gas phase ( K) via collisional excitation with electrons. We note that the [NII]/[CII] ratio is consistent with a low-density ionized medium (Oberst et al., 2006). Assuming the electron density, , is much less than the critical density cm-3 (Madden et al., 1993), the column density is given by with in units of erg s-1 cm-2 sr-1. Assuming a C+ abundance relative to hydrogen of , the mass corresponding to the total flux in the map is M⊙. Solving for the case where the ionized medium uniformly fills the 18′′ (2.1 kpc) radius volume gives a lower limit to of 0.11 cm-3 and an ionized hydrogen mass of M⊙. Combining this mass estimate with our dust mass and again accounting for helium with a factor of 1.36 gives a total (ionized plus neutral) gas-to-dust mass ratio of for or for . This analysis suggests that a significant fraction of the gas in NGC 4125 is warm ionized gas that produces [CII] emission rather than cold neutral gas.
4 Discussion
4.1 An internal origin for the dust in NGC 4125?
The dusty ISM of NGC 4125 has some unusual properties. The dust has a similar radial profile to the stellar light out to at least 7 kpc (1′) radius (Figure 1). Its total dust mass is among the highest seen in elliptical galaxies (Smith et al., 2012) and is only a factor of 3 times smaller than the dust mass in the elliptical galaxy Centaurus A (Parkin et al., 2012). However, unlike Cen A, where the neutral gas-to-dust mass ratio is 100 and the gas traces a clearly rotating disk (Parkin et al., 2012), in NGC 4125 the corresponding gas is not neutral but in a warmer ionized or even x-ray emitting phase. These unusual properties suggest an internal origin for the ISM of NGC 4125.
The ratio is towards the high end of the range seen in ellipticals, as is the total stellar mass (Smith et al., 2012). The optical colors of NGC 4125 suggest that it underwent a burst of star formation 6-8 Gyr ago (Schwiezer & Seitzer, 1992). Long-slit spectroscopy combined with simple stellar population models indicate super-solar metallicity and also point to a recent dissipational merger event and stellar ages as young as 8 Gyr (Pu et al., 2010). Many of these younger stars would now be in the red giant, carbon star, or asymptotic giant branch (AGB) phase when stars shed large quantities of gas and dust. The material that is lost from these stars has a normal gas-to-dust mass ratio. However, if the dust from the star survives for a longer time (i.e. 50 Myr, Clemens et al., 2010) than the gas survives in the neutral phase, the observed neutral gas to dust mass ratio could be reduced, because the majority of the gas would be in an ionized or X-ray emitting phase.
Assuming a dust lifetime of 50 Myr, the stars in NGC 4125 would need to produce dust at a rate of M⊙ yr-1 to explain the observed dust mass. This rate is much higher than the typical rate seen in passive elliptical galaxies (Clemens et al., 2010). Fong et al. (2006) derived total (gas plus dust) mass loss rates from a few to a few M⊙ yr-1 for a collection of AGB stars and proto-planetary and planetary nebulae in our own Galaxy, with a median mass loss rate of M⊙ yr-1. Boyer et al. (2012) find that extreme AGB stars are responsible for of the dust produced by evolved stars in the SMC. Assuming a normal gas-to-dust mass ratio of 150, NGC 4125 would need to contain roughly such stars (0.001% of its total stellar mass) to produce the required dust. Given the total mass of NGC 4125, such a population of stars seems quite reasonable.
In contrast, if the dust in NGC 4125 was acquired via an interaction with another galaxy, the lack of neutral gas suggests that the interaction must have been extremely recent. We would need to be viewing NGC 4125 at the precise time when most of the gas has been ionized but significant cold dust remains. It is hard to understand how such a large mass of dust could survive for much more than 50 Myr without the high column densities which would shield both the dust and the neutral gas.
4.2 How unique is NGC 4125?
One question which arises is why we have not discovered more galaxies like NGC 4125. First, such galaxies may be intrinsically rare in the local Universe. The Herschel Reference Survey (Boselli et al., 2010) contains all elliptical galaxies in a portion of the northern sky with mag and Mpc; NGC 4125 meets the distance and luminosity criteria but falls just outside the upper declination limit of the survey. Adding NGC 4125 to the 18 elliptical galaxies from Smith et al. (2012), we can estimate that the rate for NGC 4125-like galaxies may be %. However, not all the galaxies in the Herschel Reference Survey have atomic and molecular gas measurements and so some could be similar to NGC 4125. Second, NGC 4125 is a luminous galaxy, which makes it easier to detect a given mass fraction of dust. For internal processes, a higher stellar mass would correlate with a higher dust mass. The presence of a younger stellar population than in passively evolving ellipticals could also serve to increase the dust to stellar mass ratio. Given the sensitivities of typical Herschel maps, a similar galaxy which was 1/3 as massive would appear as a point source at 250 m at the same distance as NGC 4125, while a galaxy 1/10 as massive could not be distinguished easily from the Herschel confusion limit. Finally, it is hard to know how critical the exact age and mass fraction of the younger stellar population might be in producing this particular configuration of dust without neutral gas. With stellar lifetimes of 1.4 Gyr for a 2 M⊙ star and 5.5 Gyr for a 1.25 M⊙ star (Schaller et al., 1992), the exact age of the young population may not be a critical factor, as long as a young enough population forms a sufficient fraction of the stellar mass.
Understanding the frequency and origin of galaxies like NGC 4125 may have important implications for understanding red galaxies at larger redshifts. A galaxy like NGC 4125 would be rather difficult to interpret if it was observed at much larger distances. Its relatively strong submillimeter emission could be interpreted as indicating the presence of a significant cold ISM (Eales et al., 2010a), while its rest-frame 70 m emission could be taken as an indicator of on-going star formation. For example, using the star formation rate calibration of Li et al. (2010), the 70 m flux in the central 18′′ could be interpreted as a star formation rate of 0.15 M⊙ yr -1. For a typical gas depletion time of 2 Gyr (Leroy et al., 2008), such a star formation rate would imply an H2 mass of M⊙, a mass which is clearly ruled out by the existing CO upper limits. At some point in the past, the progenitors of elliptical galaxies must have contained a significant ISM in order to form their current population of stars. If the ISM in NGC 4125 has an internal origin linked to the age of its most recent star formation episode, then we might expect galaxies like NGC 4125 to be more common at larger redshifts, when the overall stellar population of elliptical galaxies was, of necessity, younger.
Recently, observations of moderate redshift galaxies have identified optically red galaxies which contain significant infrared emission. Rowlands et al. (2012) and Agius et al. (2013) have studied large samples of early-type (elliptical and lenticular) galaxies from the H-ATLAS (Eales et al., 2010b) survey. While these galaxies typically have larger dust masses and lower stellar masses than NGC 4125, it would be interesting to follow up on the handful of massive galaxies with red colors. Dey et al. (2008) have identified a sample of dust-obscured galaxies with high Spitzer mid-infrared to optical flux ratios. The colors of some of these galaxies show they are clearly forming stars (Pope et al., 2008), but many are not detected in and so could instead be passive, post-star formation galaxies. Herschel surveys have also identified a number of 250 m sources with red optical colors (Smith et al., 2011). While Dariush et al. (2011) conclude that most of these are highly obscured galaxies, some of them have colors that are similar to NGC 4125. If galaxies like NGC 4125, where the far-infrared emission is not related to star formation and neutral gas in the usual manner, become more common at higher redshift, this would have significant implications for our understanding of high redshift galaxies and galaxy evolution.
References
- Agius et al. (2013) Agius, N. K., Sansom, A. E., Popsecu, C. C., et al. 2013, MNRAS, 431, 1929
- Bendo et al. (2012) Bendo, G. J., Boselli, A., Dariush, A., et al. 2012, MNRAS, 419, 1833
- Boroson, Kim, & Fabbiano (2011) Boroson, B., Kim, D.-W., & Fabbiano, G. 2011, ApJ, 729, 12
- Boselli et al. (2010) Boselli, A., Eales, S., Cortese, L., et al. 2010, PASP, 122, 261
- Boyer et al. (2012) Boyer, M. L., Srinivasan, S., Riebel, D., et al. 2012, ApJ, 748, 40
- Clemens et al. (2010) Clemens, M. S., Jones, A. P., Bressan, A., et al. 2010, A&A, 518, L50
- Combes, Young, & Bureau (2007) Combes, F., Young, L. M., & Bureau, M. 2007, MNRAS, 377, 1795
- Dale et al. (2007) Dale, D. A., Gil de Paz, A., Gordon, K. D., et al. 2007, ApJ, 655, 863
- Dale et al. (2012) Dale, D. A., Aniano, G., Engelbracht, C. W. et al. 2012, ApJ, 745, 95
- Dariush et al. (2011) Dariush, A., Cortese, L., Eales, S., et al. 2011, MNRAS, 418, 64
- Dey et al. (2008) Dey, A., Soifer, B. T., Desai, V., et al. 2008, ApJ, 677, 943
- di Serego Alighieri et al. (2013) di Serego Alighieri, S., Bianchi, S., Pappalardo, C., et al. 2013, A&A, 552, A8
- Draine (2003) Draine, B. T. 2003, ARA&A, 41, 241
- Eales et al. (2010b) Eales, S., Dunne, L., Clements, D., et al. 2010, PASP, 122, 499
- Eales et al. (2010a) Eales, S. A., Smith, M. W. L., Wilson, C. D., et al. 2010, A&A, 518, L62
- Falcon-Barroso et al. (2011) Falcon-Barroso, J., van de Ven, G., Peletier, R. F., et al. 2011, MNRAS, 417, 1787
- Fong et al. (2006) Fong, D., Meixner, M., Sutton, E. C., Zalucha, A., & Welch, W. J. 2006, ApJ, 652, 1626
- Galliano et al. (2011) Galliano, F., Hony, S., Bernard, J.-P., et al. 2011, A&A, 536, A88
- Goudfrooij et al. (1994) Goudfrooij, P., Hansen, L., Jorgensen, H. E., & Norgaard-Nielsen, H. U. 1994, A&AS, 105, 341
- Griffin et al. (2010) Griffin, M. J., Abergel, A., Abreu, A., et al. 2010, A&A, 518, L3
- Jarrett et al. (2003) Jarrett, T. H., Chester, T., Cutri, R., Schneider, S. E. & Huchra, J. P. 2003, AJ, 125, 525
- Kaneda et al. (2011) Kaneda, H., Ishihara, D., Onaka, T., et al. 2011, PASJ, 63, 601
- Lebouteiller et al. (2012) Lebouteiller, V., Cormier, D., Madden, S. et al. 2012, A&A, 548, A91
- Leeuw et al. (2008) Leeuw, L. L, Davidson, J., Dowell, C. D., & Matthews, H. E., 2008, ApJ, 677, 249
- Leroy et al. (2008) Leroy, A. K., Walter, F., Brinks, E. et al. 2008, AJ, 136, 2782
- Li et al. (2010) Li, Y., Calzetti, D., Kennicutt, R. C. et al. 2010, ApJ, 725, 677
- Madden et al. (1993) Madden, S. C., Geis, N., Genzel et al. 1993, ApJ, 407, 579
- Müller, Okumura, & Klaas (2011) T. Müller, K. Okumura, & U. Klaas, 2011, “PACS photometer - colour corrections”, PICC-ME-TN-038, April 12, 2011, available from the ESA Herschel Science Centre
- Oberst et al. (2006) Oberst, T. E., Parshley, S. C., Stacey, G. J. et al. 2006, ApJ, 652, L125
- PACS Observer’s Manual (2011) PACS Observer’s Manual, 2011, HERSCHEL-HSC-DOC-0832, available from the ESA Herschel Science Centre
- Parkin et al. (2012) Parkin, T. J., Wilson, C. D., Foyle, K. et al. 2012, MNRAS, 422, 2291
- Parkin et al. (2013) Parkin, T. J., Wilson, C. D., Schirm, M. R. P. et al. 2013, ApJ, in press (arXiv:1308.3702)
- Poglitsch et al. (2010) Poglitsch, A., Waelkens, C., Geis, N. et al. 2010, A&A, 518, L2
- Pope et al. (2008) Pope, A., Bussmann, R. S., Dey, A., et al. 2008, ApJ, 689, 127
- Pu et al. (2010) Pu, S. B., Saglia, R. P., Fabricius et al. 2010, A&A, 516, A4
- Roussel (2013) Roussel, H., 2013, PASP, in press (ArXiv:1205.2576)
- Rowlands et al. (2012) Rowlands, K., Dunne, L, Maddox, S. et al. 2012, MNRAS, 419, 2545
- Saintonge, Tran, & Holden (2008) Saintonge, A., Tran, K.-V. H., & Holden, B. P. 2008, ApJ, 685, L113
- Schaller et al. (1992) Schaller, G., Schaerer, D., Meynet, G., & Maeder, A. 1992, A&AS, 96, 269
- Schwiezer & Seitzer (1992) Schwiezer, F. & Seitzer, P. 1992, AJ, 104, 1039
- Smith et al. (2011) Smith, D. J. B., Dunne, L., Maddox, S. J. et al. 2011, MNRAS, 416, 857
- Smith et al. (2012) Smith, M. W. L., Gomez, H., Eales, S. et al. 2012, ApJ, 748, 123
- SPIRE Data Reduction Guide (2013) SPIRE Data Reduction Guide, 2013, SPIRE-RAL-DOC 003248, 12 February 2013, available from the ESA Herschel Science Center
- Strong et al. (1988) Strong, A. W., Bloemen, J. B. G. M., Dame, T. M. et al. 1988, A&A, 207, 1
- Tonry et al. (2001) Tonry, J. L., Dressler, A., Blakeslee, J. P. et al. 2001, ApJ, 546, 681
- Welch, Sage & Young (2010) Welch, G. A., Sage, L. J., & Young, L. M., 2010, ApJ, 725, 100
- Wilson et al. (1988) Wilson, C. D., Scoville, N., Madore, B. F. et al. 1988, ApJ, 333, 611
- Young et al. (2011) Young, L. M., Bureau, M., Davis, T. A. et al. 2011, MNRAS, 414, 940


| Wavelength | Resolution | Peak fluxaaPeak fluxes with SPIRE are from maps with the native SPIRE resolution and have units of mJy beam-1. Peak fluxes with PACS are measured in an 18′′ circular aperture and have units of mJy. | Total flux |
|---|---|---|---|
| (m) | (FWHM, ′′) | (mJy) | (mJy) |
| 24 | 6 | … | bbFlux from Dale et al. (2007). |
| 70 | 5.76 | ||
| 160 | 12.13 | ||
| 250 | 18.2 | ||
| 350 | 24.5 | ||
| 500 | 36.0 |
| Property | Value | Notes |
|---|---|---|
| M⊙aaIf we adopt the dust emissivity appropriate for amorphous carbon plus silicate grains, the dust mass becomes M⊙; see text. | , graphite + silicate grains | |
| 2 upper limit | ||
| 2 upper limit | ||
| Assumes uniform ionized medium (§3) | ||
| M⊙ | … | |
| … |