Lunar Eclipse Observations Reveal Anomalous Thermal Performance of Apollo Reflectors
Abstract
Laser ranging measurements during the total lunar eclipse on 2010 December 21 verify previously suspected thermal lensing in the retroreflectors left on the lunar surface by the Apollo astronauts. Signal levels during the eclipse far exceeded those historically seen at full moon, and varied over an order of magnitude as the eclipse progressed. These variations can be understood via a straightforward thermal scenario involving solar absorption by a % covering of dust that has accumulated on the front surfaces of the reflectors. The same mechanism can explain the long-term degradation of signal from the reflectors as well as the acute signal deficit observed near full moon.
1 Introduction
Corner-cube reflectors (CCRs) were placed on the Moon by the Apollo astronauts during the Apollo 11, Apollo 14, and Apollo 15 landings. Each reflector consists of an array of solid, circularly-cut fused silica CCRs 3.8 cm in diameter, installed for the purpose of lunar laser ranging (LLR) operations that could test gravitational physics, elucidate details of the lunar interior, and improve knowledge of Earth orientation and precession (Murphy, 2013).
Soon after commencing LLR observations with the Apache Point Observatory Lunar Laser-ranging Operation (APOLLO: Murphy et al., 2008) in 2006, two problems became evident. First, the signal strength returning from the lunar reflectors is diminished by approximately a factor of ten compared to carefully calculated theoretical expectations (Murphy et al., 2007). Second, the reflector arrays suffer an additional order-of-magnitude signal reduction when the the lunar phase is within about 20∘ of full moon (Murphy et al., 2010). Historical data indicate that the full-moon deficit condition slowly developed during the first decade after placement on the lunar surface. The combined effect of the two facets of signal reduction is that signal strength is never greater than about 10% of expectations at any lunar phase, reducing to % near full moon—schematically depicted by the dash-dot line in Fig. 1.
The Apollo CCR arrays were designed and built in an impressive six-month period by Arthur D. Little, Inc., including a substantial effort dedicated to thermal design in order to minimize thermal gradients within the solid prisms. It is well-understood that thermal gradients within an optical device impose variations in the refractive index, leading to thermal lensing effects. The central intensity of the far-field diffraction pattern (FFDP) emerging from the CCR is severely diminished when differences of even a few degrees Kelvin exist across the corner cube (Goodrow & Murphy, 2012). Total internal reflection (TIR) corner cubes, despite producing lower central irradiances compared to CCRs with reflective coatings, were selected for the Apollo reflectors so that incoming sunlight would be completely reflected when arriving within 17∘ of normal incidence—and larger incidence angles at certain azimuth angles. Total reflection of incident energy, and especially the lack of direct absorption in rear-surface coatings, translates to reduced thermal gradients within the CCR material. Engineering documents presented a number of thermal modeling predictions for the performance, based on the FFDP central irradiance of the reflector array as a function of sun angle (ADL Inc., 1969; Faller et al., 1973). Incorporating details of azimuthal orientation and tilt of the reflector tray on the Moon, the central irradiance for each Apollo reflector was expected to remain above 60% of the nominal value for all sun illumination angles (Fig. 1).
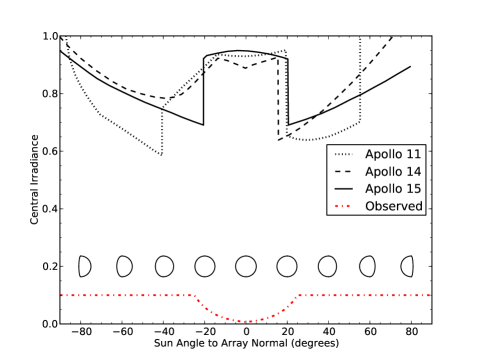
Note that around full-moon phase, when the tilted arrays are all facing the Sun, the reflectors are expected to behave quite well, since this is the domain in which TIR rejection of incident solar energy is indeed total. We have found, in contrast, that reflector signal strength is at its worst near full moon, as indicated by the dash-dot line in Fig. 1.
Various possible mechanisms were presented in Murphy et al. (2010) to account for both facets of observed signal reduction simultaneously. Each of the scenarios involved anomalous absorption or scattering of photons, leading to both the overall signal deficit and poor performance at full moon via solar–thermal lensing. The simplest and most plausible of the scenarios is the slow accumulation of dust on the front surface of the reflectors as dust is transported across the lunar surface both electrostatically and by impact activity (Stubbs, Vondrak, & Farrell, 2006; Farrell et al., 2007; Grün et al., 2011). Hartzell et al. (2013) found that intermediate-sized grains approximately 10 m in diameter are most successfully lofted in a simulated space environment. For grains in this size range, geometrical obscuration would dominate over diffraction effects for visible light.
Part of the rationale for attributing the full-moon deficit to a thermal problem is due to strong performance during past total lunar eclipses—generally becoming visible within minutes of totality—as gleaned from the archive of lunar laser ranging normal points available through the International Laser Ranging Service (Pearlman, Degnan, & Bosworth, 2002). This observation strongly suggests that solar illumination is a key factor. Because the APOLLO LLR facility is capable of operating in the high-background conditions at full moon, we had the opportunity to follow the performance of the reflectors through an entire eclipse event on 2010 December 21.
We present here the heuristic performance expectations of a reflector array suffering solar-induced thermal gradients during the course of a total eclipse, exploring briefly the dust deposition that would be necessary to create the previously reported performance deficits. We then present the observed performance during eclipse, demonstrating a close match to the heuristic expectations. We conclude that the lunar reflectors are not operating according to their design, likely burdened with a fine layer of dust. Detailed thermal simulations of the CCRs and mounting trays in the lunar environment are not within the scope of this paper, for which the primary objective is presentation of the eclipse observations.
2 Thermal Expectations
We have detailed separately the effect of axial and radial thermal gradients within a CCR on the central irradiance of the FFDP. The conclusion is that a temperature difference across the CCR of only a few degrees can destroy the central irradiance (Goodrow & Murphy, 2012). A simple model for what may be plaguing the lunar reflectors is that dust on the front surface absorbs solar radiation when the array points nearly face-on to the Sun—as is the case near full moon. The CCRs are recessed into an aluminum tray by half their diameters (see Fig. 2), so that illumination of the front surface is complete only at full phase. Solar energy absorbed by the dust is radiatively and conductively transferred into the front surface of the CCR, creating a thermal gradient within the CCR that was not anticipated in the design. The gradient translates to a varying refractive index, or thermal lensing, imparting phase delays for different optical paths within the CCR.

For instance, if the front surface of the corner cube is hotter than its vertex, a ray path entering and exiting the CCR near its outer radius will stay relatively close to the front surface as it traverses the interior of the CCR, experiencing a slightly larger average refractive index and therefore greater phase delay compared to a central ray that penetrates deep into the CCR and into cooler material. The result is a spherical wavefront advanced in the center and retarded at the edges. The divergence translates into a loss of peak intensity in the far field, and thus reduced return signal. Radial temperature gradients produce similar-scale effects on the wavefront and FFDP. Thermal expansion also plays a role, but far less pronounced than the refractive effect (Goodrow & Murphy, 2012).
2.1 Dust Covering Fraction and Thermal Impact
We model the putative front-surface dust absorption as covering a fraction, , of the front surface in small grains randomly and uniformly distributed across the surface. Assigning to the dust an albedo, , results in a front-side thermal input in full sun of , where W m-2 is the solar irradiance and is the frontal area. Light that successfully enters the CCR will re-emerge through the front surface after retroreflection, to again find probability, , of absorption by dust (see Fig. 2 for a schematic example). The probability of transmission through both passages of the front surface is , assuming random (independent) placement of dust grains on the surface. The total rate of energy absorbed by dust for the Apollo CCRs then computes to:
| (1) |
In order to explain the observed order-of-magnitude signal deficit at all phases, we make use of the fact that the double-pass of the CCR front surface results in an effective likelihood of transmission proportional to , reducing the effective aperture area by this same factor. The central irradiance of the far field diffraction pattern arising from an arbitrary aperture is:
| (2) |
where is the electric field at position in the aperture plane, and is the associated phase. For a plane wave of uniform intensity, we see that the central irradiance is simply proportional to the square of the aperture area—independent of configuration. The effective area of a dust-covered CCR will be times the geometrical area, so that the return strength in the far-field should scale as . From our observation that the CCR signal is reduced by a factor of ten or more (a factor of 15 may be closer to the truth), we put the fill-factor, , so that the front-surface thermal absorption from Eq. 1 becomes approximately 1.0 W.
The thermal power radiated to space from the front surface of each CCR depends on the temperature the CCRs reach under full sun, which in part depends on the temperature attained by the mounting tray. This, too, depends in principle on the state of dust coverage. A perfect blackbody equilibrates at 394 K under 1370 W m-2 of solar illumination, as does lunar dust, with “balanced” values for albedo () and emissivity (). In their thermal models, the manufacturers of the reflector arrays used 0.2 for both optical absorptance () and emissivity for the aluminum top surface of the array, the balance of which also results in an equilibrium temperature of 394 K. It is worth noting that preparation of the aluminum surface can have a dramatic impact on equilibrium temperature: machined aluminum (, ) reaches 470 K in full sunlight, while clear-anodized aluminum (, ) is a far cooler 260 K. A 50% lunar dust covering on said anodized aluminum would raise the temperature to 330 K.
Adopting 394 K as an upper limit to the CCR temperature in full sun, the front-surface () radiated power would be as large as W if the radiation were able to couple into sr of cold sky. However, the Apollo CCRs are recessed by half their diameters into slightly conical clear-anodized aluminum pockets (1.5∘ half-angle for Apollo 11; 6∘ for the other two; see Fig. 2). This results in area-weighted solid angles to cold space of 1.52 and 1.70 sr, for the two designs, or only 24 and 27% of a sr half-space. Since the conical walls are known to have moderately high emissivity (; ADL Inc., 1969), the radiative cooling power of the CCR face into space is reduced to W—assuming a fused silica emissivity of and that any radiation not absorbed by the conical walls is reflected to space. Note that this is less than the estimated W rate of solar absorption by dust on the front surface. Dust on the conical walls does little to modify the radiative cooling rate, as the walls are already high-emissivity. But if anything, the presence of dust would reduce cooling efficacy further.
We may therefore expect the CCR front surface to see a net influx of thermal power, the associated energy making its way to the aluminum mounting tray by radiation (suppressed by the low emissivity cavity behind the CCR) and mount conductance through the tabs and Teflon rings around the periphery of the CCR (Fig. 2). In principle, the relative efficacies of these two flows will determine whether axial or radial gradients dominate. The distinction is not important for the purposes of this paper, as either type of gradient diminishes the far-field signal strength (Goodrow & Murphy, 2012). A detailed thermal simulation including the mounting tray, the lunar surface, and the impact of dust would be desirable to confirm the scenario described here, but is beyond the scope of the current paper.
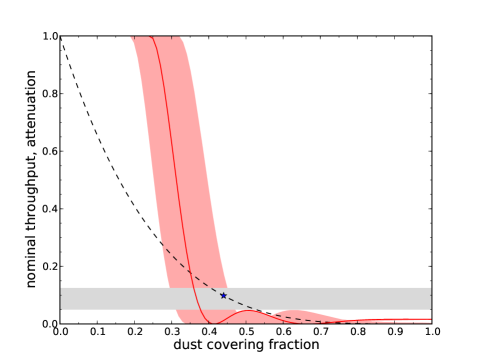
Short of a full thermal simulation, we can at least investigate the plausibility of optically significant thermal gradients based on the fact that the net power, , transmitted through the CCR front surface will produce a temperature gradient in the neighborhood of , where is the “thickness” across which the gradient develops, and W m-1 K-1 is the thermal conductivity of fused silica. In order to realize debilitating thermal gradients (of order 4 K; see Goodrow & Murphy, 2012), we require a front-surface power imbalance of W, using the CCR radius as the characteristic “thickness,” . This is comparable to the difference calculated above of a 1.0 W input in conjunction with a W radiative loss rate. These numbers are not precisely determined, but set a scale that is fully consistent with gradients several degrees in magnitude, and thus optically important. Fig. 3 illustrates the feasibility of both obscuration and thermal lensing imposing the observed factor-of-ten signal deficit effects at the same dust covering fraction.
2.2 Thermal Time Constant
The time constant for changing a thermal gradient in a solid mass of fused silica can be approximated by evaluating the timescale over which an axial gradient in a cylinder of material having height and radius would equilibrate. At a thermal conductivity , the rate of energy flow along the cylinder axis will be , where is the total temperature difference across the cylinder. If the temperature is allowed to equilibrate with no flow of heat into or out of the cylinder, we must move of thermal energy from one half of the cylinder to the other half. Here, is the specific heat capacity of the material, is the density, and the factor of eight transforms the end-to-end temperature difference into the amount of excess thermal energy that must be moved elsewhere. Dividing energy transferred by the initial rate of energy flow yields a time constant
| (3) |
For a fused silica CCR with a height ( kg m-3; J kg-1K-1; W m-1K-1; mm for the Apollo CCRs111materials values from http://www.sciner.com/Opticsland/FS.htm), the cylindrical timescale computes to 100 seconds. While weak coupling to the mounting tray may lengthen the time constant somewhat, one may still expect to see changes in the thermal state of the CCR well within the hours-long timescale of the eclipse, given the foregoing estimation.
2.3 Predicted Behavior
The eclipse provides a celestial light switch with which to test our hypothesized thermal scenario by tracking the reflected signal strength as the solar illumination changes. Operating under the assumption that our model for solar absorption by dust at the front surface is correct, the front of the CCR under solar illumination will be hotter than the bulk, establishing a positive thermal gradient (we will adopt the convention that the gradient is positive when the front face is hotter than the interior bulk). During the eclipse, we can expect the CCR to radiate its stored thermal energy to space via the high-emissivity front surface, ultimately resulting in the establishment of a negative gradient. At some point during this reversal, the overall gradient should cross through zero—at which time we should expect a strong return due to an approximately isothermal corner cube prism. Depending on the magnitude of the negative gradient that develops well into the eclipse, the return may become weaker than the normal full-moon performance. When sunlight reappears, the gradient again reverses, passing through zero once more as the CCR transitions from a negative to a positive thermal gradient. Therefore, we may expect a second peak in return strength around this time, before settling back to the usual full-moon performance under the influence of a positive gradient. Fig. 4 illustrates a possible evolution during the eclipse.
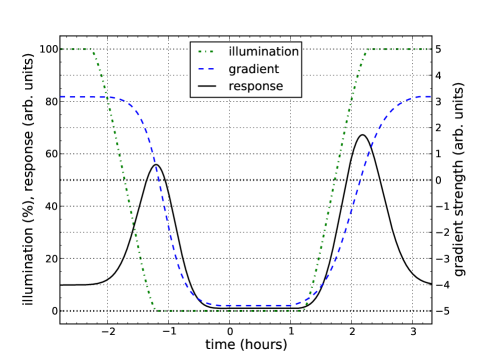
Because the eclipse-induced thermal transitions happen quickly, a truly isothermal condition is unlikely to develop during the process. But the dominant gradient should be largely ameliorated during the reversal. The speed with which the gradient changes may influence the degree of thermal anisotropy, and hence the peak return strength. Because the net heating or cooling rate of the CCR is not likely to be symmetric during ingress and egress—this depends on the detailed balance of front-surface absorption and radiation—we should not be surprised to see a different evolution of return strength during egress vs. ingress. Such an asymmetry is suggestively illustrated in Fig. 4. For example, using the estimated rates from Section 2.1, the net heat flow into the corner cube before the eclipse will be 0.4 W, while during eclipse the rate will be W (only radiation). In this scenario, one would expect the stabilized negative gradient to exceed the stabilized positive gradient in absolute value, and a faster transition accompanying eclipse ingress than that for egress, as depicted in Fig. 4.
3 Observations and Results
3.1 Observing Conditions and Timing
The total lunar eclipse on 2010 December 21 (near solstice) was well-placed in the sky at the Apache Point Observatory, reaching an elevation angle of around the time that totality began. High, thin clouds of variable thickness were present throughout the observations. Moderate and fairly steady winds were also present throughout the period: one minute samples indicate a mean, median, and standard deviation of 37.2, 38.6, and 4.7 km hr-1, respectively, having a minimum and maximum of 20.9 and 48.3 km hr-1. Surface wind direction was also steady, staying between azimuths of 255∘ and 280∘ (originating from the west). The impact of wind on tracking increased during the night, as the telescope and open dome shutter followed the Moon into the west.
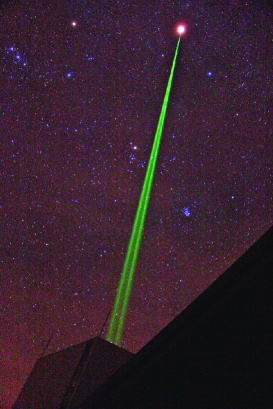
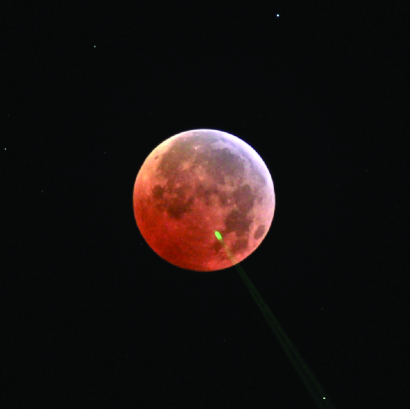
The timeline for the eclipse appears in Table 1. Laser ranging attempts commenced at 05:50 UTC, ending at 11:20 UTC, when the Moon was at elevations of and , respectively. Fig. 5 shows pictures taken during the total phase of the eclipse from a location approximately 40 m from the telescope. The spot of laser light visible at lower right in the right-hand image is reflected from thin clouds about 10 km high. The laser power measured 1.29–1.42 W during the observation period—less than the long-term average nearer 2 W.
| Event | Time (UTC) |
|---|---|
| P1: Penumbral eclipse begins (first contact) | 05:29:17 |
| U1: Partial eclipse begins (second contact) | 06:32:37 |
| U2: Total eclipse begins (third contact) | 07:40:47 |
| Eclipse midpoint | 08:16:57 |
| U3: Total eclipse ends (fourth contact) | 08:53:08 |
| U4: Partial eclipse ends (fifth contact) | 10:01:20 |
| P2: Penumbral eclipse ends (sixth contact) | 11:04:31 |
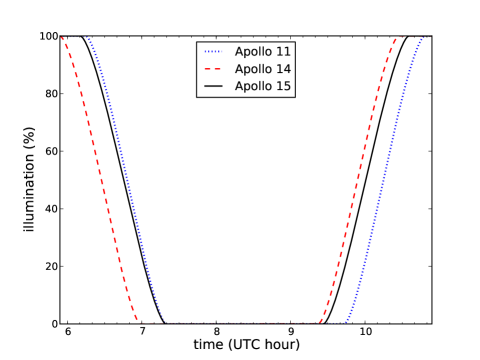
Because the edge of the Earth’s shadow is curved, and the transit of the eclipse through the shadow was not centered, different reflectors not only see time offsets in the shadow crossing, but different durations and onset slopes. As a result, a different illumination timeline applies to each reflector during the eclipse, as illustrated in Fig. 6.
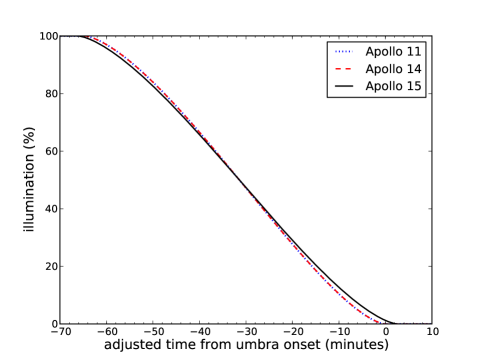
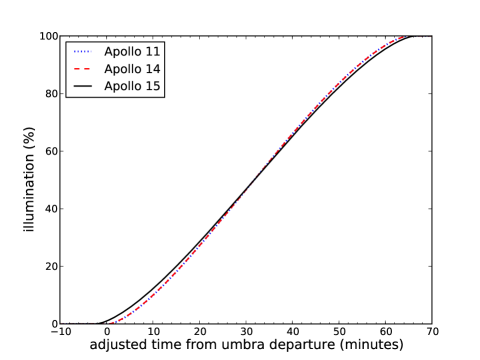
It is to our advantage to evaluate the temporal response of the reflectors with respect to their individual illumination histories, rather than on an absolute time axis. If we shift the illumination history curves in time so that the midpoint of both ingress and egress separately align at the 50% illumination points, we find that we must shift the ingress time of Apollo 11 and Apollo 15 earlier by 20.8 and 17.9 minutes, respectively, to lie on top of the (earliest) Apollo 14 curve. Likewise, for egress, Apollo 11 and Apollo 15 must be shifted earlier by 20.9 and 6.7 minutes, respectively. Fig. 7 shows the aligned curves—which for Apollo 11 and Apollo 14 lie on top of each other, and are indistinguishable.
3.2 Data Acquisition and Presentation
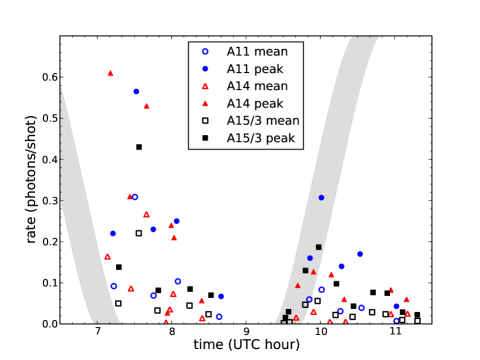
The raw observations are detailed in Tables 2 and 3, and shown in Fig. 8. For each run, whose start time is listed in the table and spans 50 s per 1000 shots, a reflector signal is detected against background events, summed in a 1 ns temporal window following the predicted lunar range (see Murphy et al., 2008, for example data). The background rate is subtracted, and an average rate computed, representing the number of reflector photons divided by the number of laser shots. Before plotting results, rates for Apollo 15 are divided by 3 to account for its larger size so that the reflector responses may be compared to one another. We also present a peak rate corresponding to the best 15 s contiguous period within each run. Comments capture supplemental notes made at the time of observation; notes about wind do not reflect anomalously windy periods, according to wind records for the night, although their influence on pointing likely increased over time as the telescope tracked into the wind.
| Time | Reflector | Illum. | Shots | Photons | Mean | Peak | Comments |
|---|---|---|---|---|---|---|---|
| (UTC) | (%) | ||||||
| 5:50:17 | A15 | 100 | 10000 | — | — | — | seeing 1.5 arcsec; laser power 1.35 W |
| 5:59:52 | A15 | 100 | 2477 | — | — | — | cut short for satellite block |
| 6:08:32 | A15 | 100 | 5000 | — | — | — | |
| 6:13:03 | A15 | 98 | 5000 | — | — | — | |
| 6:18:33 | A14 | 63 | 5000 | — | — | — | |
| 6:23:29 | A15 | 86 | 5000 | — | — | — | |
| 6:36:12 | A15 | 64 | 5000 | — | — | — | after pointing update |
| 6:41:16 | A14 | 20 | 5000 | — | — | — | |
| 6:46:36 | A15 | 43 | 5000 | — | — | — | |
| 6:59:13 | A15 | 19 | 5000 | — | — | — | after transmit/receive offset |
| 7:05:51 | A14 | 0 | 6000 | 985 | 0.164 | 0.610 | |
| 7:11:46 | A11 | 5 | 4000 | 368 | 0.092 | 0.220 | |
| 7:15:50 | A15 | 0 | 3000 | 450 | 0.15 | 0.415 | windy highly variable rate |
| 7:21:38 | L1 | 0 | 4500 | — | — | — | |
| 7:26:00 | A14 | 0 | 3000 | 260 | 0.087 | 0.310 | |
| 7:29:11 | A11 | 0 | 3000 | 926 | 0.309 | 0.565 | |
| 7:32:24 | A15 | 0 | 3000 | 1985 | 0.662 | 1.290 | |
| 7:35:24 | L1 | 0 | 3000 | — | — | — | |
| 7:38:32 | A14 | 0 | 3000 | 800 | 0.267 | 0.530 | |
| 7:44:13 | A11 | 0 | 3000 | 207 | 0.069 | 0.230 | |
| 7:47:23 | A15 | 0 | 3000 | 296 | 0.099 | 0.245 | windy highly variable rate |
| 7:50:59 | L1 | 0 | 3000 | — | — | — | |
| 7:54:15 | A14 | 0 | 3000 | 11 | 0.004 | 0.027 | essentially lost (tracking drift?) |
| 7:57:19 | A14 | 0 | 3000 | 107 | 0.036 | 0.240 | |
| 8:00:10 | A14 | 0 | 3000 | 220 | 0.073 | 0.210 | |
| 8:03:53 | A11 | 0 | 3000 | 311 | 0.104 | 0.250 | |
| 8:12:24 | A15 | 0 | 5000 | 671 | 0.134 | 0.255 | |
| 8:17:31 | L1 | 0 | 5000 | — | — | — | |
| 8:22:39 | A14 | 0 | 5000 | 72 | 0.014 | 0.057 | |
| 8:27:43 | A15 | 0 | 5000 | 355 | 0.071 | 0.210 | |
| 8:36:20 | A11 | 0 | 5000 | 88 | 0.018 | 0.067 | |
| 8:41:37 | A14 | 0 | 5000 | — | — | — | IR all-sky camera showing clouds worse |
| 8:46:41 | A15 | 0 | 6000 | — | — | — | |
| 8:52:38 | A15 | 0 | 4000 | — | — | — | laser power 1.42 W after run |
| 9:01:00 | A15 | 0 | 5000 | — | — | — | after run, noted large image motion on camera |
| Time | Reflector | Illum. | Shots | Photons | Mean | Peak | Comments |
|---|---|---|---|---|---|---|---|
| (UTC) | (%) | ||||||
| 9:20:02 | A15 | 0 | 5000 | — | — | — | after waiting for light for crater pointing ref. |
| 9:28:30 | A15 | 0.5 | 5000 | 30 | 0.006 | 0.047 | |
| 9:33:06 | A15 | 5 | 5000 | 65 | 0.013 | 0.090 | |
| 9:37:59 | A14 | 24 | 6000 | 94 | 0.016 | 0.094 | |
| 9:46:38 | A15 | 25 | 3000 | 421 | 0.140 | 0.390 | |
| 9:49:53 | A11 | 7 | 3000 | 179 | 0.060 | 0.160 | |
| 9:53:18 | A14 | 51 | 3000 | 89 | 0.030 | 0.127 | jumpy pointing—presumably wind shake |
| 9:56:32 | A15 | 44 | 3000 | 504 | 0.168 | 0.560 | |
| 9:59:48 | A11 | 23 | 3000 | 250 | 0.083 | 0.307 | |
| 10:05:37 | A14 | 76 | 5000 | 26 | 0.005 | 0.120 | |
| 10:10:36 | A15 | 72 | 4000 | 262 | 0.066 | 0.293 | |
| 10:14:31 | A11 | 53 | 4000 | 124 | 0.031 | 0.140 | high clouds approaching |
| 10:18:43 | A14 | 95 | 4000 | 22 | 0.006 | 0.060 | |
| 10:24:22 | A15 | 94 | 4000 | 209 | 0.052 | 0.130 | |
| 10:31:32 | A11 | 84 | 4000 | 157 | 0.039 | 0.170 | |
| 10:35:39 | A14 | 100 | 4000 | — | — | — | |
| 10:40:04 | A15 | 100 | 4000 | 342 | 0.086 | 0.230 | |
| 10:44:16 | A11 | 99 | 4000 | — | — | — | |
| 10:51:00 | A15 | 100 | 4000 | 285 | 0.071 | 0.225 | |
| 10:55:13 | A14 | 100 | 4000 | 97 | 0.024 | 0.083 | |
| 10:59:50 | A11 | 100 | 4000 | 29 | 0.007 | 0.043 | |
| 11:04:26 | A15 | 100 | 4000 | 115 | 0.029 | 0.087 | |
| 11:08:39 | A14 | 100 | 4000 | 101 | 0.025 | 0.060 | still jumpy pointing (wind shake) |
| 11:12:56 | A11 | 100 | 4000 | — | — | — | |
| 11:17:07 | A15 | 100 | 3000 | 68 | 0.023 | 0.067 | laser power 1.29 W after run |
Lunar laser ranging is a low-signal endeavor, and some time is inevitably spent trying to recover a lost signal. Also, the return rate is highly sensitive to atmospheric conditions—especially turbulence-induced “seeing”—so that even perfect alignment and tracking produce factors of 3–5 in signal rate fluctuations on timescales ranging from seconds to minutes. For these reasons, the reported rates should all be interpreted with factor-of-two uncertainties. The peak rate may be more representative of the intrinsic performance than the average rate, because at least these moments tend to ensure that pointing and atmospheric transmission are simultaneously as good as they may be, and therefore more meaningfully compared from one run to another.
During ingress, we began observations at 05:50 UTC, but were not able to acquire returns from either Apollo 15 or Apollo 14 for the first hour. At 06:52 we adjusted the transmit-receive beam alignment offset by 1.6 arcsec: a large change for APOLLO that can easily account for the lack of signal. After this adjustment, we failed once more to raise Apollo 15 in a run starting at 06:59. All reflectors were still illuminated to some degree during these failed attempts. In the next run, starting at 7:05, we got a very bright return from Apollo 14—about an order of magnitude stronger than any full-moon result over the previous five years. We were then able to see Apollo 11 and Apollo 15 prior to their entry into full shadow, displaying comparatively poor performance, although still better than historical experience. Attempts were made at 07:21, 07:35, 07:51, and 8:17 to find the Lunokhod 1 reflector, but to no avail. As discussed below, this is not particularly surprising given the construction of the Lunokhod arrays.
After 08:41, well into the total phase of the eclipse, we lost the signal from all reflectors and were unable to recover signal from Apollo 15 in multiple subsequent attempts. Slightly thicker clouds during this period may have played a role (explored more thoroughly later). A run starting at 09:28 recovered a very weak signal from Apollo 15, just as it was re-entering sunlight. A second peak in performance was then observed for all reflectors, although less impressive than the first. Even so, the observed rates were well in excess of historical return rates at full phase. The last hour of observation produced signal levels typical of full-moon phase.
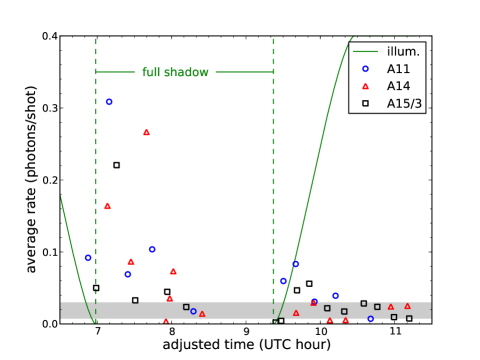
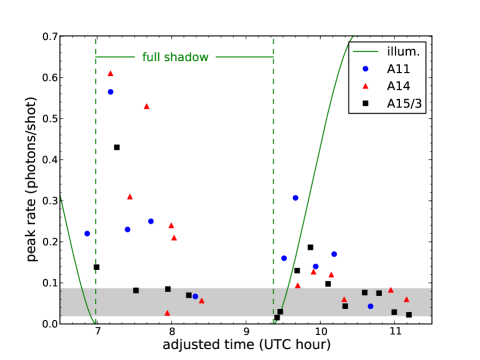
Adjusting the times to a common illumination history (as in Fig. 7) reveals the trends a bit more clearly, as seen in Fig. 9. All reflectors follow a similar evolution. Both peaks in performance are seen to commence after the onset of shadow and re-illumination, respectively, and display similar timescales. The second peak is about half as strong as the first, although a systematic shift in atmospheric transparency or seeing could be responsible for a change at this level. Well after the end of the eclipse, the rates settle into a range consistent with APOLLO’s historically observed full-moon return rates over five years of prior operation.
3.3 Cloud Transparency Analysis
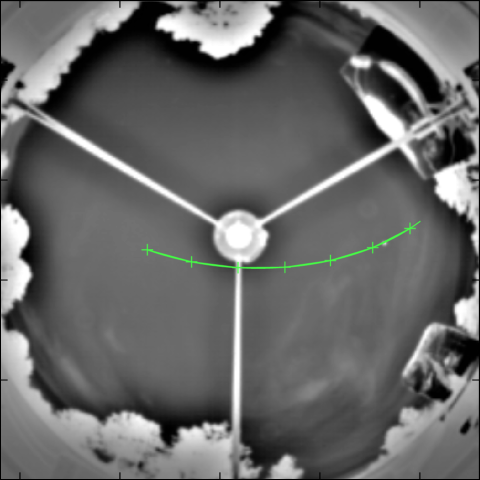
High-altitude clouds of variable thickness—mostly thin—were present throughout the eclipse. The unprecedented signal rate at full phase is convincing enough, but it is important to explore the extent to which clouds may impact the signal profile. An all-sky infrared (IR) camera working around 7–14 m provides a record of sky conditions at the site (see example in Fig. 10). By characterizing the range of infrared brightness (proportional to cloud thickness) experienced at any given location along the Moon’s track during the period of observation, we are able to establish the relative brightness of the sky around the Moon as a function of time. Representing this brightness on a scale of zero (clear) to one (maximum brightness experienced at that position during the observation period; not necessarily opaque), we arrive at the erratic gray curve in Fig. 11. The spike at 10:20 was seen to diminish the direct infrared flux from the Moon (which disappeared during the eclipse) by a factor of two, while the smaller spike at 10:29 resulted in a 20% reduction in flux. This reinforces the assertion that the clouds on this night exhibit only modest opacity, although it should be borne in mind that lunar ranging signals must traverse the atmosphere twice.
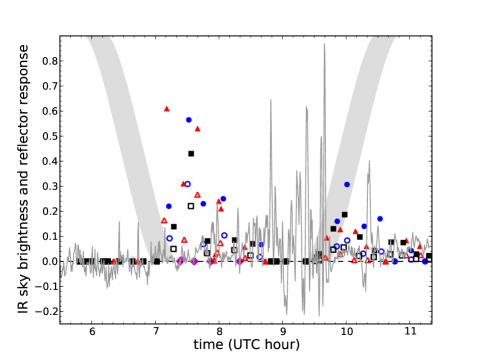
Also displayed in Fig. 11 is the observing history following the conventions of Fig. 8, this time adding failed attempts. The early and late periods are mostly clear, while the highest opacity period from 8:20 to 9:40 coincides with the loss of signal late in the eclipse. On its face, this would seem to challenge our claim that the response pattern we observed stems from intrinsic thermal problems in the corner cube prisms. But detailed examination does not bear this out.
Firstly, the initial rise and fall of signal transpired against a backdrop of good conditions. Indeed, the clear-looking photograph at left in Fig. 5 coincides with the worst conditions during this period, while the picture at right—also evidently clear—corresponds to a time when the lunar signal was already diminished. In other words, the clouds in question are not very thick. Secondly, the cloudy periods were always intermittent rather than steadily opaque. APOLLO observations frequently succeed in intermittent conditions, experiencing peaks and valleys in the response rate during runs lasting a few minutes. Note in particular the failed attempt around 9:01 during momentarily clear conditions. Lastly, signal recovery began before the most intense cloudy period subsided at 9:40, after which the signal strength went through another peak and decay during a period of good conditions.
Even though the observing conditions were less than pristine on the night of the eclipse, it should be strongly emphasized that the observations are remarkable not only because the performance peaks happen to line up with the times of thermal transition, as speculated should be the case (e.g., Fig. 4). More robust is the fact that the returns from all three Apollo reflectors exceeded previous full-moon return rates by an order of magnitude after the onset of totality, eventually settling back to the historically observed rates after the eclipse was over. While the observing conditions on the night of the eclipse were decent, the presence of thin clouds would rule out the prospect of beating previous records by an order of magnitude, especially when simultaneously contending with a laser power that was lower than the long-term normal. Variable conditions do not, therefore, diminish the significance of the eclipse observations as an indicator of thermal problems in the reflectors.
3.4 Missing Lunokhod
The lack of return from Lunokhod 1—normally comparable to the Apollo 11 and Apollo 14 response—is an interesting datapoint. The physically larger, triangular-faced CCRs have a thermal time constant an order of magnitude longer than the Apollo CCRs, and are not mounted in recesses in an aluminum tray as are the Apollo CCRs. It is well-established that the Lunokhod arrays suffer substantial performance degradation under solar illumination. Having reflective (partially absorbing) rear-surface coatings rather than operating via TIR may be partially responsible. In general, the Lunokhod arrays are more susceptible to thermal disruptions than the Apollo arrays, so the lack of returns from Lunokhod 1 during the eclipse is not entirely surprising.
4 Discussion
The present observations leave little doubt that the lunar reflectors experience thermally induced performance degradation under solar illumination at full moon—confirming the conjecture raised in Murphy et al. (2010). Indeed, it is rather remarkable that the return rates observed during this one lunar eclipse approach the best levels observed by APOLLO at any lunar phase over many years, despite the presence of high, thin clouds. This is similar to the experience during the 1996 September 27 lunar eclipse at the Observatoire de la Côte d’Azur (OCA: Samain et al., 1998): immediately after ingress they recorded a return from the Apollo 11 reflector within a factor of two of their best-ever result at any lunar phase, over decades of observation. Normally, OCA is unable to acquire any LLR signal during full moon.
It is difficult to explain the observed double peak in signal strength associated with eclipse ingress and egress without invoking a sign reversal in the thermal gradient within the corner cube. We know that the gradient, as defined in Section 2.3, must be negative during the eclipse, as the front surface operates as a cooling surface radiating to space. The implication is then that the gradient is positive during solar illumination near full phase. Using the estimates and relations established in Section 2.1, this puts the thermal input from dust absorption greater than W. According to Eq. 1, the dust covering fraction must be at least in order to exceed 0.6 W of absorption, which translates to a static (all phases) optical loss of a factor of three. The fact that the normal full-moon deficit is substantial (Murphy et al., 2010), together with the foregoing observation that the signal evolution during the eclipse is dramatically double-peaked, implies a non-eclipsed solar absorption well in excess of 0.6 W—arguing for even larger dust covering fractions and static losses. Indeed, as sketched by Fig. 3, a covering fraction around is consistent with: a) a factor of ten signal loss at all lunar phases; b) a thermal gradient during solar illumination large enough to account for a further order-of-magnitude signal loss at full moon; and c) the double-peaked dynamic observed during eclipse.
The only piece that does not fit perfectly is the relative strengths of the ingress and egress signal peaks. The fact that we were unable to recover any signal during the late stages of totality suggests that the negative gradient at that stage was stronger than the positive gradient during full illumination. For this to be true—as would be the case for the estimated net absorption of 0.4 W versus a W cooling rate in shadow—one expects the transition to be faster during ingress than during egress. This, in turn, should lead to a weaker signal peak during ingress than during egress, as depicted in Fig. 4. We see the opposite (Fig. 9). This discrepancy is not overly concerning, however, in light of the fact that changing conditions can easily produce variations in return strength on this scale (factor of 2–3 level). Cloudier conditions combined with increased wind shake and higher airmass in the latter half of the observations, while not able to mimic the observed response dynamics and order-of-magnitude variations, are sufficient to impact the observations in a manner that is still consistent with the model.
Confirmation that a thermal gradient is responsible for the observed full-moon deficit may also help explain why waning gibbous-phase laser returns are often very strong (as can be seen in Fig. 1 of Murphy et al., 2010). Near full-moon phase, each reflector suffers a strong positive gradient from dust absorption of solar illumination on the front surface. When the sun angle becomes large enough, the front surface energy absorption diminishes, and the gradient slowly becomes negative as stored thermal energy is radiated to space. During this transition (gibbous phase), the gradient should pass through zero and result in a stronger signal. The timescales are much longer than those for the eclipse, and the CCRs themselves are capable of much faster adjustment. But the balance between solar forcing and radiative release is itself adjusting slowly, carrying the CCR along a slow thermal trajectory.
One final comment on an item of general interest: the suggestion that the lunar reflectors are covered in a % coating of dust is not in conflict with the survival of astronaut footpaths as dramatically revealed in images from the Lunar Reconnaissance Orbiter Camera. If the dust buildup is a process that is linear in time, the present observation of half-covered layer forming over yr suggests a deposition rate of m yr-1—assuming typical grain sizes of m (Hartzell et al., 2013). At this rate, it would take tens of thousands of years to cover the tracks of the astronauts. On the other hand, impact ejecta rays are known to survive over 100 Myr timescales and may point to local differences in surface composition with respect to regolith dust.
5 Conclusion
Estimates and observations provided in this paper support the idea that dust accumulation could be responsible for several observed effects: reduced signal at all phases; the full-moon signal deficit; and the double-peaked signal during eclipse. The key idea is that when illuminated, solar thermal absorption by a % dust-covered CCR front surface provides enough heat to support a several-degree thermal gradient within the CCR, and this in turn is enough to destroy the central irradiance of the diffraction pattern sent back to Earth. The double peak in performance coincident with eclipse ingress and egress are exactly what one would expect under this model. The timescales observed for signal evolution are likewise realistic.
These results bear on the concept of optical or infrared observatories on the lunar surface. On the timescale of decades, a layer of dust may form on optical surfaces, compromising performance. It is unclear how far from the surface the dust accumulation extends. A potential hint is that the Lunokhod reflectors, situated roughly a meter off the surface, appear to fare no better—and in the case of Lunokhod 2, much worse—than the much lower-profile Apollo reflectors. Results from the recently launched Lunar Atmosphere and Dust Environment Explorer (LADEE) will likely shed significant light on dust transport mechanisms.
Also important is that next-generation lunar reflectors, such as those being developed presently (Currie, Dell’Agnello, & Monache, 2011), incorporate baffles or other mechanisms to mitigate dust accumulation on critical surfaces. Independent of the chief direction of transport, reducing the solid angle visible from the corner cube front surface should help. As new reflectors are developed and tested in simulated environmental conditions, it could be highly informative to explore the role that dust plays in the far-field performance of lunar corner cubes.
Acknowledgments
We thank the Apache Point Observatory and the University of Washington for providing a lengthy observing period during which to track the eclipse progress. We are also grateful to Jack Dembicky for providing an inspiring set of images of eclipse ranging operations. We thank Douglass Currie for useful discussions, and Eric Michelsen and Jim Williams for useful comments. The apparatus used for these observations is associated with the APOLLO collaboration, which also includes Eric Adelberger, James Battat, C. D. Hoyle, Christopher Stubbs, and Erik Swanson. APOLLO is supported by the National Science Foundation, grant PHY-1068879, and NASA NNX-12AE96G, and T. M. acknowledges support from the LUNAR consortium as part of the NASA Lunar Science Institute (NNA09DB30A). Results in this paper are based on observations obtained with the Apache Point Observatory 3.5 m telescope, which is owned and operated by the Astrophysical Research Consortium.
References
- ADL Inc. (1969) Arthur D. Little, Inc., 1969. Laser Ranging Retro-Reflector Array for the Early Apollo Scientific Experiments Package, available at: http://www.physics.ucsd.edu/~tmurphy/apollo/doc/ADL.pdf
- Currie, Dell’Agnello, & Monache (2011) Currie, D., Dell’Agnello, S., and Monache, G. D., 2011. “A lunar laser ranging retroreflector array for the 21st Century,” Acta Astronautica, 68, 667
- Faller et al. (1973) Faller, J. E., Alley, C. O., Bender, P. L., Currie, D. G., Dicke, R. H., Kaula, W. M., MacDonald, G. J. F., Mulholland, J. D., Plotkin, H. H., Silverberg, E. C., & Wilkinson, D. T., 1973. “Laser ranging retroreflector,” in the Apollo 15 Preliminary Science Report, Chapter 14, NASA SP289, available at: http://www.lpi.usra.edu/lunar/documents/
- Farrell et al. (2007) Farrell, W. M., Stubbs, T. J., Vondrak, R. R., Delory, G. T., and Halekas, J. S., 2007. “Complex electric fields near the lunar terminator: The near-surface wake and accelerated dust,” Geophysical Research Letters, 34, L14201.
- Goodrow & Murphy (2012) Goodrow, S. D., & Murphy, T. W., 2012. “Effects of thermal gradients on total internal reflection corner cubes,” Appl. Optics, 51, 8793–8799.
- Grün et al. (2011) Grün, E., Horanyi, M., and Sternovsky, Z., 2011, “The lunar dust environment,” Planetary and Space Sci., 59, 1672–1680.
- Hartzell et al. (2013) Hartzell, C. M., Wang, X., Scheeres, D. J., and Horanyi, M., 2013, “Experimental demonstration of the role of cohesion in electrostatic dust lofting,” Geophys. Res. Lett., 40, 1038–1042
- Murphy et al. (2007) Murphy, T. W., Adleberger, E. G., Battat, J. B., Hoyle, C. D., Michelsen, E. L., Stubbs, C. W., and Swanson, H. E., 2007, “Absolute Calibration of LLR signal: Reflector health status,” Proceedings of the 15th International Laser Ranging Workshop, Canberra, Australia
- Murphy et al. (2008) Murphy, T. W., Adelberger, E. G., Battat, J. B. R., Carey, L. N., Hoyle, C. D., LeBlanc, P., Michelsen, E. L., Nordtvedt, K., Orin, A. E., Strasburg, J. D., Stubbs, C. W., Swanson, H. E., and Williams, E., 2008. “The Apache Point Observatory Lunar Laser-ranging Operation: Instrument Description and First Detections,” Publications of the Astronomical Society of the Pacific, 120, 20–37, arXiv:0710.0890.
- Murphy et al. (2010) Murphy, T. W., Adelberger, E. G., Battat, J. B. R., Hoyle, C. D., McMillan, R. J., Michelsen, E. L., Samad, R. L., Stubbs, C. W., & Swanson, H. E., 2010, “Long-term degradation of optical devices on the Moon,” Icarus, 208, 31–35.
- Murphy (2013) Murphy, T. W., 2013. “Lunar laser ranging: the millimeter challenge,” Rep. on Prog. in Physics, 76, 076901. 21pp.
- Pearlman, Degnan, & Bosworth (2002) Pearlman, M. R., Degnan, J. J., and Bosworth, J. M., 2002. “The International Laser Ranging Service,” Adv. Space Res., 30, (2), pp. 135–143, DOI:10.1016/S0273-1177(02)00277-6.
- Samain et al. (1998) Samain, E., Mangin, J. F., Veillet, C., Torre, J. M., Fridelance, P., Chabaudie, J. E., Feraufy, D., Glentzlin, M., Pham Van, J., Furia, M., Journet, A., and Vigouroux, G., 1998. “Millimetric lunar laser ranging at OCA,” Astron. and Astrophys. Suppl. Ser., 130, 235
- Stubbs, Vondrak, & Farrell (2006) Stubbs, T. J., Vondrak, R. R., and Farrell, W. M., 2006. “A dynamic fountain model for lunar dust,” Advances in Space Research, 37, 59–66.