Oxidation of GaN: An ab initio thermodynamic approach
Abstract
GaN is a wide-bandgap semiconductor used in high-efficiency LEDs and solar cells. The solid is produced industrially at high chemical purities by deposition from a vapour phase, and oxygen may be included at this stage. Oxidation represents a potential path for tuning its properties without introducing more exotic elements or extreme processing conditions. In this work, ab initio computational methods are used to examine the energy potentials and electronic properties of different extents of oxidation in GaN. Solid-state vibrational properties of Ga, GaN, \ceGa2O3 and a single substitutional oxygen defect have been studied using the harmonic approximation with supercells. A thermodynamic model is outlined which combines the results of ab initio calculations with data from experimental literature. This model allows free energies to be predicted for arbitrary reaction conditions within a wide process envelope. It is shown that complete oxidation is favourable for all industrially-relevant conditions, while the formation of defects can be opposed by the use of high temperatures and a high \ceN2:\ceO2 ratio.
pacs:
82.60.-s, 65, 71.15.Mb, 82.33.PtI Introduction
Solid-state lighting with light-emitting diodes (LEDs) offers exceptionally high efficiencies, and systems with luminous efficacies of over 100 lmW-1 are already commercially available.Murphy (2012) With experimental systems achieving up to 169 lmW-1, researchers are continuing to move performance towards the theoretical limit for white light of around 300 lmW-1 (depending on the definition of “white”).Narukawa et al. (2010) GaN, in pure and indium-doped forms, has been an instrumental part of this movement, forming many of the highest-performing LED systems.
Very pure semiconductors such as GaN are generally formed under high vacuum by techniques including chemical vapour deposition (CVD) and molecular beam epitaxy (MBE). Such conditions require specialised equipment and considerable energy. It would be desirable to carry out deposition reactions at more modest pressures, but this risks the presence of gas impurities and may make the system more difficult to control. In particular, oxygen is thought to form solid solutions with GaN, substituting N atoms for O at low concentrations (%) and altering the resistivity and bandgap – important properties for its electronic applications.Aleksandrov et al. (2000) 500∘C is considered “low-temperature” for deposition and 800-1000∘C is more typical; this coincides with the maximum solubility of oxygen.Aleksandrov et al. (2000) A recent attempt at atomic layer deposition of GaN at modest temperatures (C) obtained a bulk oxygen concentration of 19.5%.Ozgit et al. (2012)
However it has also been reported that higher temperatures can reduce the concentration of gallium oxide by controlling the rate of deposition; Obinata et al (2005) attribute the formation of Ga-O bonds to a film of “excess Ga”, but also note that gallium oxide existed within their GaN films.Obinata et al. (2000) A proposed solution is annealing in the presence of ammonia, providing excess nitrogen.Sawada et al. (2007)
In addition to the growth process, GaN is known to thermally decompose under vacuum at temperatures above around 700∘C (i.e. reaction conditions), with a strong temperature dependence, and this is also suppressed by nitrogen.Fernández-Garrido et al. (2007) The thermodynamic significance of varying nitrogen pressures is therefore of interest.
A range of materials modelling techniques have been applied to GaN in the past. These include analytical pairwise potentialZapol et al. (1997); Catlow et al. (2010) and electronic structure studiesLany and Zunger (2010); Lambrecht et al. (1994); Limpijumnong et al. (2003); Carter et al. (2009). The computational defect physics was reviewed by Neugebauer and Van de WalleNeugebauer and Van de Walle (1994), while Zywietz et al. investigated the incorporation of oxygen on the material surface.Zywietz et al. (1999)
The key reaction considered in this study was the oxidation of GaN under formation conditions. Complete oxidation is expected to occur at high temperatures, above typical deposition conditions:
while the dominant form of oxidation at deposition conditions is the substitution of N atoms for O at low concentrations:
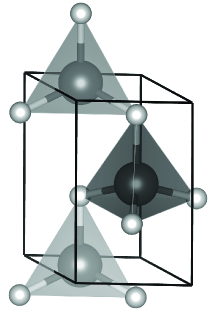
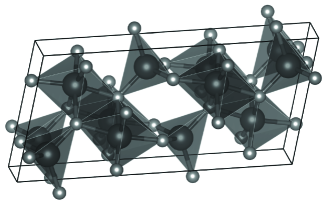
GaN adopts the wurtzite crystal structure with tetrahedral ion coordination environments; this is represented by a small hexagonal unit cell (Figure 1(a)), whereas the stable - structure of \ceGa2O3 corresponds to a more complex monoclinic unit cell, with both tetrahedral and octahedral elements (Figure 1(b)).
II Methodology
The aim of the study was to predict the envelope of conditions for thermodynamically stable GaN, and free energies of several degrees of oxidation. This is achieved by using density functional theory (DFT) to calculate the energies of pure and defective compounds.Hohenberg and Kohn (1964); Kohn and Sham (1965) Energy minimisation with DFT is based purely on the electronic potential field, and does not account directly for any lattice vibrations, or the effect of pressure. By adding the zero-point vibrational energy to the DFT-derived energy , we can obtain an energy value which we define as equivalent to various thermodynamic potentials at zero temperature and zero pressure (indicated with a superscript ‘0’):
| (1) |
where , , are the Gibbs free energy, enthalpy and internal energy, respectively. The contributions of individual components may be considered in terms of their chemical potentials . For ideal materials the chemical potential is equivalent to the Gibbs free energy of one unit (i.e. 1 mole) of the pure material, and hence:
| (2) | ||||
| Introducing the chemical potential at given reaction conditions , and rearranging: | ||||
| (3) | ||||
A slightly different approach is needed to collect this information for each material. In the solid phase, is calculated for crystalline unit cells with a three-dimensional periodic boundary condition. and the free energy change with temperature and pressure require some combination of approximations, literature data and/or lattice dynamics calculations.Stoffel et al. (2010)
In the gas phase, the DFT energy for an isolated molecule must be found in a method consistent with the solid component energies. Zero-point and free energies are readily available in the literature for common gases such as \ceO2 and \ceN2, although care must be taken to use consistent reference points.
II.1 Total energies and structures
DFT calculations were carried out using the Fritz Haber Institute ab initio molecular simulations (FHI-aims) package.Blum et al. (2009) FHI-aims is highly scalable across thousands of computer coresHavu et al. (2009), and uses atom-centred numerically-tabulated basis sets to describe all of the electrons in the system. All energies and structures were converged using the provided ‘tight’ or ‘tier 2’ basis set, which includes hydrogen-like s, p, d and f atomic orbitals for Ga and adds a g orbital for N and O. With the exception of molecular oxygen, all calculations did not include spin-polarisation. The PBEsol exchange-correlation functional was selected; this functional uses the generalised gradient approximation (GGA) and is intended for solid-state calculations. Perdew et al. (2008); Csonka et al. (2009) The use of GGA for examining the electronic structures of semiconductors has been challenged recently as it tends to under-estimate formation energies and bandgaps; nonetheless PBEsol is considered to offer a good balance of accuracy and efficiency for total energies and structure optimisation.Lany (2008); Xiao et al. (2011)
II.1.1 Pure compounds
Inital crystal structures for GaN, -\ceGa2O3 and Ga metal were obtained from the literature via the Chemical Database Service at Daresbury and the Inorganic Crystal Structure Database (ICSD).Paszkowicz et al. (2004); Åhman et al. (1996); *[][[NotethatduetoanapparenterrorintheICSD; theinitiallatticeparametersforGaslightlydeviatefromthisoriginalsource; whichgives$a=4.5167$Å; $b=4.5107$Å; $c=7.6448$Å.]]Bradley1935 The unit cell parameters and atomic positions were converged with FHI-aims and PBEsol to give energies () of the pure compounds. The geometry optimisation routine was permitted to vary both the cell contents and unit cell parameters in order to minimise the overall energy. The routine employs analytical stress tensors with an adapted Broyden-Fletcher-Shanno-Goldfarb (BFGS) algorithm.Blum et al. (2009) The relaxed unit cell parameters are given in Table 1. -points were defined as an evenly-spaced grid in reciprocal space, centred on the -point, and time-reversal symmetry was employed to reduce the required number of calculations. The -point-grid density was scaled to the unit cell size to achieve uniform sampling with a target length cutoff of 10 Å, as described by Moreno and Soler.Moreno and Soler (1992)
Oxygen (in the triplet spin configuration) and nitrogen gases were modelled by setting an isolated pair of atoms 1 Å apart and allowing them to relax to a distance minimizing the energy. The resulting distances are also included in Table 1, each overestimating their recorded spectroscopic value by 1% (Table 2).
II.1.2 Defects
Dilute oxidation in bulk GaN was modelled by the supercell approach: 72-atom, 128-atom and 300-atom supercells were created from the relaxed hexagonal 4-atom GaN unit cell as described in Appendix A. Energies were calculated with and without a single substitution of an N atom for an O atom. The atomic positions within the cell were relaxed to find an energy minimum using the BFGS algorithm as above.
In order to model the dilute limit of oxidation, it is necessary here to apply a band-filling correction. Oxygen substitution in GaN results in an excess electron that occupies the conduction band. As the defect concentration decreases, the conduction band filling drops to the band minimum, usually at the gamma point. A correction energy was calculated by integrating over the eigenvalues above this reference energy for each -point, following the method described by Persson et al.Persson et al. (2005) and discussed in more detail by Lany and Zunger.Lany and Zunger (2008) This has been implemented as a MATLAB routine, available on request.
| Compound | Initial parameters | -points | Relaxed structure | ||||||||||
|---|---|---|---|---|---|---|---|---|---|---|---|---|---|
| GaNPaszkowicz et al. (2004) | [7 7 4] | ||||||||||||
| \ceGa2O3Åhman et al. (1996) | [2 8 4] | ||||||||||||
| Ga | [6 4 6] | ||||||||||||
| \ceO2 | |||||||||||||
| \ceN2 | |||||||||||||
II.2 Gases - literature data
| Material | ||||
|---|---|---|---|---|
| / eV | / kJ mol-1 | / kJ mol-1 | / Å | |
| \ceO2 | ||||
| \ceN2 |
Gas properties in ab initio thermodynamics can be calculated using statistical mechanics, but in practice are generally drawn from experimental values.Reuter et al. (2005); Reuter and Scheffler (2001); Morgan and Watson (2010) In this case properties for \ceO2 and \ceN2 were calculated using data from standard thermochemical tables, which have been fitted by NIST to polynomial equations of the form developed by Shomate. Chase (1998); Linstrom and Mallard (2005); Shomate (1944, 1954) Such correlations are especially convenient for use in computer programs. The correction for temperature and pressure in Eq. (3), , requires a reference state of zero, while the majority of data in the literature is relative to standard conditions of 298.15 K and 1 bar. It is therefore convenient to break up the correction to use this reference state, which is denoted with a superscript :
| (4) | ||||
| Introducing the relationship with enthalpy, : | ||||
| (5) | ||||
| , so simplifying and rearranging: | ||||
| (6) | ||||
| Substituting this back into Eq. (4): | ||||
| (8) | ||||
| Of these terms: is found by ab initio calculations; depends on the lattice frequency and is relatively small (literature values are given in Table 2); and are available from literature data. The only variable term is . Introducing the group to break the process into isothermal pressure change and isobaric temperature change: | ||||
| (9) | ||||
| To account for the pressure change, we use an ideal-gas relationship:Warn and Peters (1996) | ||||
| (10) | ||||
| (11) | ||||
| The temperature change uses the standard constant-pressure heat capacity : | ||||
| (12) | ||||
| (13) | ||||
| Combining Equations (8), (11) and (13): | ||||
| (14) | ||||
| (15) | ||||
The key pieces of data needed are therefore the standard enthalpy , the heat capacity, , and entropy, , as functions of temperature at standard pressure. The standard enthalpy is available from reference books, while the temperature-dependant heat capacity and entropy are obtained from tables or polynomial equations as discussed above.
II.3 Lattice dynamics
Thermal properties were calculated within the harmonic approximation using the Phonopy 1.5 software package, preparing and post-processing FHI-aims calculations.*[][[Phonopyisavailableasanopen-sourcepackagefromhttp://phonopy.sourceforge.net]]Togo2008 The number of -points was scaled to match the 10 Å target length cutoff employed in relaxation calculations. Forces were calculated for atomic displacements of 0.01 Å, with a convergence threshold of eV Å-1.
Phonopy follows the Parlinski-Li-Kawazoe method to generate a “dynamical matrix” of forces describing the harmonic behaviour of the atoms in the system. In this scheme the second derivatives of energy are obtained by combining analytical first derivatives with small displacements in supercells.Parlinski, Li, and Kawazoe (1997) These second derivatives yield a set of phonon frequencies, , which may be expressed as a phonon band structure and density of states (DOS).Stoffel et al. (2010) Ultimately a thermodynamic partition function can be formed for each mode,
| (16) |
where the energy at a given state ; the product of all yields an overall partition function from which the Helmholtz free energy
| (17) |
This energy includes the zero-point energy at 0 K, and by differentiation the heat capacity, entropy and related properties are obtained as functions of temperature. In this study the relationship was sampled over temperature with a density of at least one point per degree Kelvin, and any intermediate values were estimated using cubic spline interpolation.
It is possible to use the quasi-harmonic approximation to account for the influence of pressure and thermal expansion by modelling compressed and expanded supercells; \ceGaN is relatively incompressible, with a bulk modulus of over 200 GPa, and in this study the effect is assumed to be negligible.Sarasamak et al. (2010) A higher level of accuracy can be obtained by the use of molecular dynamics (MD) simulations with an appropriate thermostat. The computational cost of this approach is very high, as many time steps are needed to obtain a converged statistical average. Nonetheless the approach accounts for higher-order anharmonicity, within the scope of the analytical potentials or ab initio method used to calculate energies and forces.
Given a suitable function for heat capacity, it is possible to expand Eq. (3) and calculate the chemical potentials of known crystals under an absolute pressure :
| (18) |
where , and the vibrational entropy contribution are drawn from the dynamic lattice model, and is simply the total pressure multiplied by the specific volume.
II.4 Derivation of free energy
The materials are assumed to be ideal in that the chemical potentials, of each component in isolation may simply be summed together to obtain the overall Gibbs free energy of reaction, :
| (19) |
where is the temperature, is the total system pressure, is the partial pressure of a component and is the stoichiometric change for the component . A more advanced model might substitute the partial pressures for fugacities.
III results
III.1 Bulk thermodynamic properties
III.1.1 Solid-state thermodynamic potentials
The lattice dynamic calculations described in section II.3 were applied to relaxed structures of Ga, GaN, \ceGa2O3 to obtain free energies, entropies and heat capacities. The dispersion curve and DOS for GaN shows similar behaviour to work based on analytical potential models and Raman spectroscopyAzuhata et al. (1996); Siegle et al. (1997); Davydov et al. (1998), while the \ceGa2O3 curves may be compared to a previous ab initio study.Liu et al. (2007) Two defect-containing supercells were also subjected to this analysis: the 72- and 128-atom supercells in which one nitrogen atom is substituted for oxygen, \ceGa36N35O and \ceGa64N63O. The calculated zero-point energies are given with standard-temperature Helmholtz free energies () and heat capacities in Table 3, and phonon band structures in Figures 2-5.
| Compound | Supercell | -points | Unit cell basis | Formula unit basis | |||||
| GaN | [ 3 3 2 ] | [3 3 3 ] | |||||||
| Ga | [ 2 2 2 ] | [3 2 3 ] | |||||||
| \ceGa2O3 | [ 1 3 2 ] | [2 3 2 ] | |||||||
| \ceGa36N35O | [ 3 3 2 ] | [1 1 1 ] | |||||||


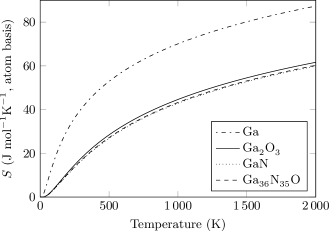
The temperature variation of entropy is presented in Figure 6: on an atomic basis, the values for the oxygen and nitrogen compounds are relatively close, while the Ga metal has greater entropy. The overall defect entropy change appears to be of the order 25 J mol-1 K-1; this is comparable with other work on point defects in ionic compounds, and corresponds to a non-negligible amount of energy at high temperatures.Gillan and Jacobs (1983); Walsh et al. (2011)
III.1.2 Heat capacities
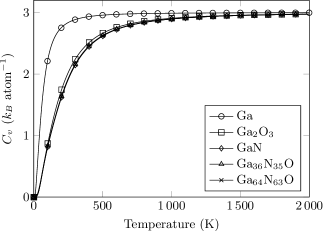
All computed heat capacities are given over the studied temperature range in Figure 7; the behaviour of the gallium compounds is extremely close, and all materials tend towards the Dulong-Petit limit of per atom.
Comparing these results with the literature, the ab initio heat capacity of GaN is plotted against several fits to experimental data in Figure 8. Danilchenko et al. fitted a mixed Debye and Einstein model to data from low-temperature calorimetry, while Leitner et al. carried out high-temperature measurements and formed an empirical model including data from other researchers.Leitner et al. (2003) Jacob et al. (2007) used differential scanning calorimetry (DSC) to return a slightly lower set of high-temperature heat capacity data.Jacob et al. (2007) Not shown is the result of Sanati and Estreicher’s ab initio calculation, which used a Ceperley-Alder local-density functional at a single -point, and appears to give similar results to ours.Sanati and Estreicher (2004) Of interest is the fact that the systems based on theory (phonon integration and Debye/Einstein models) tend towards the Dulong-Petit limit, while the experimental/empirical work exceeds this limit. The simple harmonic approaches do not account for electronic and anharmonic contributions, which may yield this additional heat capacity. In addition to the deviations in heat capacity, it is worth bearing in mind that Ga is molten above around 300 K and simple thermal decomposition of GaN is not taken into account: these are reference states rather than physical models.

The heat capacity of \ceGa2O3 shows similar behaviour relative to the literature, with a close correspondence at low temperatures and deviation from around 500 K (Figure 9).

The phonon band structures for GaN (Figures 2 and 3) clearly show the impact of the defect; a cluster of three ‘gap bands’ appears at around 400 cm-1, providing a set of vibrational energies which are available at lower temperatures than the optic modes above 500 cm-1. These correspond to highly-localised vibrations of the substitutional oxygen atom. The effect manifests itself as a peak in the difference in heat capacity of pure and oxygen-doped \ceGaN (Figure 10). The impact of the defect is both qualitatively logical and quantitatively negligible. Given the comparatively small contribution of the heat capacity to the free energy, it should generally be an acceptable approximation to use the heat capacity of the host material in thermodynamic models.

III.1.3 Enthalpy of formation
Enthalpies of formation at standard conditions were calculated using a simplified form of Equations (15) and (19) given that :
| (20) |
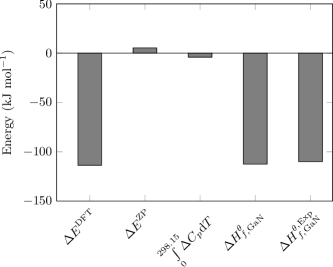
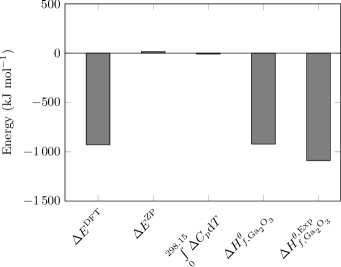
The resulting values are given in Table 4 and compared to classic experimental values. While the value for \ceGaN agrees with the literature to within a few kJ mol-1, there is a greater discrepancy for \ceGa2O3. As seen in Figures 11 and 12, the overall formation enthalpy is dominated by the ground-state potential energy; the common approximation of comparing ground state energies to standard enthalpy changes could be justified in this case.
| Material | ||
|---|---|---|
| / kJ mol-1 | / kJ mol-1 | |
| \ceGaN | ||
| \ceGa2O3 |
While the agreement between this work and the established literature is close, it is worth observing that the standard enthalpy of formation of GaN has been the subject of some debate in recent years: Jacob et al. suggested a value of -126.792 kJ mol-1 in 2007, Peshek et al. obtained -165 kJ mol-1 in 2008 and Jacob and Rajitha responded in 2009 with a critical letter and a new value of -129.289 kJ mol-1.Jacob et al. (2007); Peshek et al. (2008); Jacob and Rajitha (2009) All of these are greater in magnitude than the value of -110 kJ mol -1 reported in the current CRC Handbook of Chemistry and Physics.Haynes and Lide (2011)
III.2 Complete oxidation
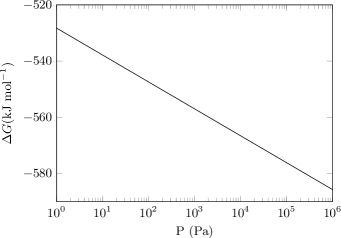
The calculated Gibbs free energy of the oxidation from GaN to \ceGa2O3 is given for a wide range of conditions in Figure 13. At standard temperature and pressure, with an air-like \ceO2:\ceN2 pressure ratio of 20:80, the predicted Gibbs free energy of oxidation is -663.5 kJ mol-1. There is a mild effect of absolute pressure, dropping the energy further by tens of kJ mol-1 as demonstrated in Figure 14, while the relative ratio of gases has a dramatic effect of the order 100 kJ mol-1 at elevated temperature (Figure 13). This is because the entropy of the gas phase decreases at high pressures, and it becomes less unfavourable to remove material to form a solid. At very high pressures (of the order GPa, not shown here) the trend is reversed, but this is beyond the scope of the model as it is driven by the relative compressibilities of gases and solids. The strongly negative values indicate that oxidation is favourable at equilibrium under all industrially-feasible reaction conditions; the GaN-air system, while temperature-resistant in practice, is not thermodynamically stable. This implies that it relies entirely on kinetic stability.

III.3 Dilute oxidation
The enthalpies of dilute oxidation (i.e. substitutional oxygen defect formation) can be explored using the energies of large supercells, taking advantage of the relatively small deviation in heat capacity from the pure substance. In Figure 15, defect formation enthalpies are calculated for standard conditions in an air-like mixture as:
| (21) |
and the vibrational contributions to the two solids are assumed to be equivalent as the difference in heat capacity is of the order 0.05 J mol-1 K-1 (Figure 10).
The overall defect formation enthalpy is exothermic for all concentrations studied; however, there is a strong dependence on the supercell size, which is varied from \ceGa36N36 to \ceGa150N150. Application of the band-filling correction further stabilises partial oxidation by kJ mol-1, and the values for the two larger supercells appear to approach convergence.
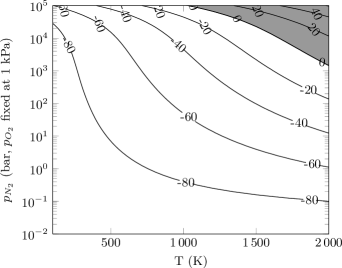
The modelled Gibbs free energy for dilute oxidation is given in Figure 16 for a single substitution per 72-atom cell over a range of temperatures and partial pressures. At the most extreme conditions the threshold of is approached; the operating envelope may be considered more easily as a contour map as in Figures 17 and 18. Comparing these envelopes for two defect concentrations, we observe that it is actually easier to achieve a positive for the more dilute defect. The contribution of entropy to the free energy reverses the trend seen for enthalpy in Figure 15. For example, in the high-pressure high-temperature regime (2000 K, bar), the ground state () contributions to Gibbs free energy are -80.7 kJ mol-1 and -91.6 kJ mol-1 for the 72-atom and 128-atom supercells, respectively. In the same region, the entropic contributions are -305.6 kJ mol-1 and -278.0 kJ mol-1. The enthalpy corrections of 117.8 kJ mol-1 and 119.2 kJ mol-1 show a smaller concentration dependence.


IV Conclusions
A thermodynamic model has been developed for the GaN-\ceO2-\ceN2 system from ab initio calculations and readily-available thermodynamic data. The model permits the free energies and enthalpies of oxidation and defect formation to be calculated for any conditions within a practical processing range. The case of complete oxidation to \ceGa2O3 represents an overall driving force, and the behaviour following a phase transition, while defect calculations offer insight to the early onset of oxidation.
Varying the ratio of gases provides a strong entropic driving force in the system, and industrial processing conditions are capable of shifting the equilibrium. However, the oxidation of GaN appears to be such a favourable reaction that in practice extreme conditions would be required to prevent oxides or substitutional defects from being thermodynamically stable. The high thermal stability of GaN with respect to oxygen is therefore kinetic in nature.
Appendix A Supercell transformations
The transformation matrices in Table 5 were applied with the VESTA software packageMomma and Izumi (2011) to form supercells from the relaxed GaN unit cell.
| Atoms in cell | Shape | Transformation matrix |
|---|---|---|
| 4 | Hexagonal | |
| 72 | Hexagonal | |
| 128 | Orthorhombic | |
| 300 | Hexagonal |
Acknowledgements.
We thank D. Allsopp for useful discussions. We acknowledge the use of the Chemical Database Service at Daresbury and the Inorganic Crystal Structure Database (ICSD). This work was funded and supported by the EPSRC through the Doctoral Training Centre in Sustainable Chemical Technologies at the University of Bath (EP/G03768X/1). Via our membership of the UK’s HPC Materials Chemistry Consortium, which is funded by EPSRC (EP/F067496), this work made use of the facilities of HECToR, the UK’s national high-performance computing service, which is provided by UoE HPCx Ltd at the University of Edinburgh, Cray Inc and NAG Ltd, and funded by the Office of Science and Technology through EPSRC’s High End Computing Programme. Large structure relaxations and lattice dynamics were calculated using Blue Joule, a Bluegene/Q system at the Science and Technology Facility Council’s Daresbury Laboratory, which we were kindly permitted to use as part of the Early Access program.References
- Murphy (2012) T. W. Murphy, J. Appl. Phys. 111, 104909 (2012).
- Narukawa et al. (2010) Y. Narukawa, M. Ichikawa, D. Sanga, M. Sano, and T. Mukai, J. Phys. D: Appl. Phys. 43, 354002 (2010).
- Aleksandrov et al. (2000) S. E. Aleksandrov, T. A. Gavrikova, and V. A. Zykov, Semiconductors 34, 291 (2000).
- Ozgit et al. (2012) C. Ozgit, I. Donmez, M. Alevli, and N. Biyikli, J. Vac. Sci. Technol. A 30, 01A124 (2012).
- Obinata et al. (2000) N. Obinata, K. Sugimoto, K. Ishibiki, S. Egawa, T. Honda, and H. Kawanishi, Jpn. J. Appl. Phys. 44, 8432 (2005).
- Sawada et al. (2007) M. Sawada, M. Sawadaishi, H. Yamamoto, M. Arai, and T. Honda, J. Cryst. Growth 301-302, 67 (2007).
- Fernández-Garrido et al. (2007) S. Fernández-Garrido, G. Koblmüller, E. Calleja, and J.S. Speck, J. Appl. Phys. 104, 033541 (2008).
- Zapol et al. (1997) P. Zapol, R. Pandey, and J. D. Gale, J. Phys.: Condens. Matter 9, 9517 (1997).
- Catlow et al. (2010) C. R. A. Catlow, Z. X. Guo, M. Miskufova, S. A. Shevlin, A. G. H. Smith, A. A. Sokol, A. Walsh, D. J. Wilson, and S. M. Woodley, Phil. Trans. Roy. Soc. A 368, 3379 (2010).
- Lany and Zunger (2010) S. Lany and A. Zunger, Appl. Phys. Lett. 96, 142114 (2010).
- Lambrecht et al. (1994) W. Lambrecht, B. Segall, S. Strite, and G. Martin, Phys. Rev. B 50, 155 (1994).
- Limpijumnong et al. (2003) S. Limpijumnong, J. Northrup, and C. Van de Walle, Phys. Rev. B 68, 075206 (2003).
- Carter et al. (2009) D. J. Carter, J. D. Gale, B. Delley, and C. Stampfl, Phys. Rev. B 77, 115349 (2008).
- Neugebauer and Van de Walle (1994) J. Neugebauer and C. G. Van de Walle, Phys. Rev. B 50, 8067 (1994).
- Zywietz et al. (1999) T. K. Zywietz, J. Neugebauer, and M. Scheffler, Appl. Phys. Lett. 74, 1695 (1999).
- Hohenberg and Kohn (1964) P. Hohenberg and W. Kohn, Phys. Rev. B 136, 864 (1964).
- Kohn and Sham (1965) W. Kohn and L. Sham, Phys. Rev. A 140, 1133 (1965).
- Stoffel et al. (2010) R. P. Stoffel, C. Wessel, M.-W. Lumey, and R. Dronskowski, Angew. Chem. Int. Ed. 49, 5242 (2010).
- Blum et al. (2009) V. Blum, R. Gehrke, F. Hanke, P. Havu, V. Havu, X. Ren, K. Reuter, and M. Scheffler, Comput. Phys. Commun. 180, 2175 (2009).
- Havu et al. (2009) V. Havu, V. Blum, P. Havu, and M. Scheffler, J. Comput. Phys. 228, 8367 (2009).
- Perdew et al. (2008) J. Perdew, A. Ruzsinszky, G. Csonka, O. Vydrov, G. Scuseria, L. Constantin, X. Zhou, and K. Burke, Phys. Rev. Lett. 100, 136406 (2008).
- Csonka et al. (2009) G. Csonka, J. Perdew, A. Ruzsinszky, P. Philipsen, S. Lebègue, J. Paier, O. Vydrov, and J. Ángyán, Phys. Rev. B 79, 155107 (2009).
- Lany (2008) S. Lany, Phys. Rev. B 78, 1 (2008).
- Xiao et al. (2011) H. Xiao, J. Tahir-Kheli, and W. A. Goddard, J. Phys. Chem. Lett. 2, 212 (2011).
- Paszkowicz et al. (2004) W. Paszkowicz, S. Podsiadło, and R. Minikayev, J. Alloys Compd. 382, 100 (2004).
- Åhman et al. (1996) J. Å hman, G. Svensson, and J. Albertsson, Acta Crystallogr. C 52, 1336 (1996).
- Bradley (1935) A. Bradley, Z. Kristallogr. Kristallgeom. Kristallphys. Kristallchem. 91, 302 (1935).
- Moreno and Soler (1992) J. Moreno and J. Soler, Phys. Rev. B 45, 13891 (1992).
- Persson et al. (2005) C. Persson, Y.-J. Zhao, S. Lany, and A. Zunger, Phys. Rev. B 72, 035211 (2005).
- Lany and Zunger (2008) S. Lany and A. Zunger, Phys. Rev. B 78, 235104 (2008).
- Irikura (2007) K. K. Irikura, J. Phys. Chem. Ref. Data 36, 389 (2007).
- Haynes and Lide (2011) W. M. Haynes and D. R. Lide, CRC Handbook of Chemistry and Physics, (Taylor & Francis, 2011).
- Reuter et al. (2005) K. Reuter, C. Stampfl, and M. Scheffler, Handbook of Materials Modeling, Part A. Methods, edited by S. Yip (Springer, Berlin, 2005) pp. 149–234.
- Reuter and Scheffler (2001) K. Reuter and M. Scheffler, Phys. Rev. B 65, 035406 (2001).
- Morgan and Watson (2010) B. J. Morgan and G. W. Watson, J. Phys. Chem. C 114, 2321 (2010).
- Togo et al. (2008) A. Togo, F. Oba, and I. Tanaka, Phys. Rev. B 78, 134106 (2008).
- Parlinski, Li, and Kawazoe (1997) \bibitemOpenK. Parlinski, Z. Q. Li, and Y. Kawazoe, Phys. Rev. Lett. 78, 4063 (1997).
- Sarasamak et al. (2010) K. Sarasamak, S. Limpijumnong, and W. R. L. Lambrecht, Phys. Rev. B 82, 035201 (2010).
- Chase (1998) M. W. J. Chase, NIST-JANAF Thermochemical Tables American Chemical Society, New York, 1998).
- Linstrom and Mallard (2005) P. Linstrom and W. Mallard, NIST Chemistry WebBook, Nist Standard Reference database Number 69 (National Institute of Standards and Technology, Gaithersburg MD, 2005).
- Shomate (1944) C. Shomate, J. Am. Chem. Soc. 66, 928 (1944).
- Shomate (1954) C. Shomate, J. Phys. Chem. 58, 368 (1954).
- Warn and Peters (1996) J. Warn and A. Peters, Concise Chemical Thermodynamics, 2nd ed. (Chapman & Hall, London, 1996) pp. 92–93.
- Danilchenko et al. (2006) B. A. Danilchenko, T. Paszkiewicz, S. Wolski, A. Jezowski, and T. Plackowski, Appl. Phys. Lett. 89, 061901 (2006).
- Jacob et al. (2007) K. Jacob, S. Singh, and Y. Waseda, J. Mater. Res. 22, 3475 (2007).
- Leitner et al. (2003) J. Leitner, A. Strejc, D. Sedmidubský, and K. Růžička, Thermochim. Acta 401, 169 (2003).
- Adams, Jr. and Johnston (1952) G. B. Adams, Jr. and H. L. Johnston, J. Am. Chem. Soc. 74, 4788 (1952).
- Mills (1972) K. Mills, High Temp. – High Press. 4, 371 (1972).
- Azuhata et al. (1996) T. Azuhata, T. Matsunaga, K. Shimada, K. Yoshida, T. Sota, K. Suzuki, and S. Nakamura, Physica B 219-220, 493 (1996).
- Siegle et al. (1997) H. Siegle, G. Kaczmarczyk, L. Filippidis, A. P. Litvinchuk, A. Hoffmann, and C. Thomsen, Phys. Rev. B 55, 7000 (1997).
- Davydov et al. (1998) V. Davydov, Y. Kitaev, I. Goncharuk, A. Smirnov, J. Graul, O. Semchinova, D. Uffmann, M. Smirnov, A. Mirgorodsky, and R. Evarestov, Phys. Rev. B 58, 12899 (1998).
- Liu et al. (2007) B. Liu, M. Gu, and X. Liu, Appl. Phys. Lett. 91, 172102 (2007).
- Gillan and Jacobs (1983) M. J. Gillan and P. W. M. Jacobs, Phys. Rev. B 28 (1983).
- Walsh et al. (2011) A. Walsh, A. A. Sokol, and C. R. A. Catlow, Phys. Rev. B 83, 224105 (2011).
- Sanati and Estreicher (2004) M. Sanati and S. K. Estreicher, J. Phys.: Condens. Matter 16, L327 (2004).
- Peshek et al. (2008) T. J. Peshek, J. C. Angus, and K. Kash, J. Cryst. Growth 311, 185 (2008).
- Jacob and Rajitha (2009) K. Jacob and G. Rajitha, J. Cryst. Growth 311, 3806 (2009).
- Momma and Izumi (2011) K. Momma and F. Izumi, J. Appl. Crystallogr. 44, 1272 (2011).