Phase transformation B1 to B2 in TiC, TiN, ZrC and ZrN under pressure
Abstract
Phase stability of various phases of MX (M = Ti, Zr; X = C, N) at equilibrium and under pressure is examined based on first-principles calculations of the electronic and phonon structures. The results reveal that all B1 (NaCl-type) MX structures undergo a phase transition to the B2-structures under high pressure in agreement with the previous total-energy calculations. The B1-MX structures are dynamically stable under very high pressure ( GPa). The pressure-induced B2 (CsCl-type) MC phases are dynamically unstable even at high pressures, and TiN and ZrN are found to crystallize with the B2-structure only at pressures above GPa. The first-order B1-to-B2 phase transition in these nitrides is not related to the softening of phonon modes, and the dynamical instability of B2-MX is associated with a high density of states at the Fermi level.
Key words: titanium and zirconium carbides and nitrides, first-principles calculations, phase transformation, electronic and phonon structures
PACS: 64.70.K-, 63.20.-e, 71.15.Nc, 71.20.-b
Abstract
На основi першопринципних розрахункiв електронної та фононної структур дослiджувалась стабiльнiсть рiзних фаз МХ (M = Ti, Zr; X = C, N) в рiвновазi та пiд тиском. Результати вказують на те, що всi B1 (типу NaCl) структури МХ при високому тиску зазнають фазового перетворення в B2-структури, що узгоджується з попереднiми розрахунками повної енергiї. Структури B1-MX динамiчно стабiльнi при дуже високому тиску ( ГПа). Обумовленi тиском B2 (типу CsCl) MC структури динамiчно нестабiльнi навiть при високих тисках, а TiN i ZrN кристалiзуються в B2-структурi лише при тиску вищому ГПа. Фазовий перехiд першого порядку з B1 в B2 в цих нiтридах не пов’язаний iз пом’якшенням фононних мод, а динамiчна нестабiльнiсть B2-MX пов’язується з високою щiльнiстю станiв на рiвнi Фермi.
Ключовi слова: карбiди та нiтриди титану i цирконiю, першопринципнi розрахунки, фазовий перехiд, електроннi та фононнi структури
1 Introduction
Transition metal compounds (TMC) form a class of materials with the NaCl-type crystal structure (B1) in a wide composition range, and exhibit extremely high melting points, hardness, and metallic conductivity [1, 2]. These materials are exploited under extreme conditions (high temperature, high pressure, etc.), and they are widely used as the main layers in ultra-hard nano-composite coatings [3]. Therefore, it is important to understand the peculiarities of their behavior under extreme conditions. In this investigation we focus on titanium and zirconium carbides and nitrides (MX, M = Ti, Zr; X = C, N) that crystallize with the NaCl-type (B1) lattice since their high-pressure stability is not very well known. To our knowledge, there has been only several works devoted to this problem: Dubrovinskaia et al. observed a B1-R phase transition in TiC at a pressure above 18 GPa [4], although Winkler et al. found no phase transition in the B1 titanium carbide up to 26 GPa [5]. On the other hand, many theoretical studies predict the B1 to B2 (CsCl-type) phase transition in MX, under high pressure. In table 1, we report the transition pressures () obtained in the present investigation and from other studies based on first-principles and empirical-potential calculations. It is seen that all the first-principles and three-body potential calculations provide consistent values of , whereas the neglect of three body interactions in the empirical-potential studies leads to much lower values of (cf. table 1). Based on the total-energy calculations for TiC, Zhao et al. predicted two phase transition paths under pressure: B1 (117 GPa) TlI′ (172 GPa) TlI, and/or B1 (131 GPa) TiB′ (148 GPa) TiB [6]. Note that a description of these phases can be found in reference [6].
It follows from this brief review that many theoretical investigations predict a B1 to B2 phase transition in MX under pressure in the range of GPa. Also, the more complex cubic to orthorhombic transformations under pressure in TiC and ZrC were predicted in some first-principles calculations. For MX, there is no experimental evidence of the existence of other structural polytypes, besides the B1 structure, in a wide range of temperatures (up to melting points) and pressures.
The main goal of this paper is to verify the dynamical stability of the B2-MX phases under pressure, and to investigate other plausible phases of MX.
The paper is organized as follows. In section 2, we present our theoretical framework and the computational details. Section 3 contains the results of our calculations together with comments. Finally, section 4 contains the main conclusions.
| Phase | Procedure | Reference | |
|---|---|---|---|
| TiC | 570 | Quantum ESPRESSO-GGA | This work |
| 500 | CASTEP-GGA | [6] | |
| 490 | FPLMTO-LDA | [7] | |
| 57 | Two-body potential | [8] | |
| TiN | 354 | Quantum ESPRESSO-GGA | This work |
| 370 | FPLMTO-LDA | [7] | |
| 364.1 | CASTEP-GGA | [9] | |
| 322.2 | CASTEP-LDA | [9] | |
| 126 | Two-body potential | [8, 10] | |
| 310 | Three-body potential | [11] | |
| ZrC | 289 | Quantum ESPRESSO-GGA | This work |
| 295 | CASTEP-GGA | [12] | |
| 98 | Two-body potential | [13] | |
| ZrN | 209 | Quantum ESPRESSO-GGA | This work |
| 205 | CASTEP-GGA | [12] | |
| 94 | Two-body potential | [10] |
2 Methodology
A first-principles pseudo-potential method was used to investigate different phases of MX (M = Ti, Zr; X = C, N). Scalar-relativistic band-structure calculations within the density functional theory (DFT) were carried out. The ‘‘Quantum-ESPRESSO’’ first-principles code [14] was used to perform the pseudo-potential calculations, with Vanderbilt ultra-soft pseudo-potentials to describe electron-ion interactions [15]. For Ti and Zr atoms, the semi-core states were treated as valence states. Plane waves up to a kinetic energy cutoff of 38 Ry (516.8 eV) were included in the basis set. The exchange-correlation potential was treated in the framework of the generalized gradient approximation (GGA) of Perdew-Burke-Ernzerhof (PBE) [16]. Brillouin-zone integrations were performed using the sets of special -points corresponding to the () Monkhorst-Park mesh [17]. For the 8-atom cell of the TlI-type TiC, we used a () mesh that, although it generates a lower number of -points, provides an acceptable accuracy. Each eigenvalue was convoluted with a Gaussian with width Ry (0.272 eV). All structures were optimized by simultaneously relaxing the atomic basis vectors and the atomic positions inside the unit cells using the Broyden-Fletcher-Goldfarb-Shanno (BFGS) algorithm [18]. The relaxation of the atomic coordinates and the unit cell was considered to be complete when the atomic forces were less than 1.0 mRy/Bohr (25.7 meV/Å), the stresses were smaller than 0.025 GPa, and the total energy during the structural optimization iterative process varied by less than 0.1 mRy (1.36 meV). The crystalline and energetic parameters of various phases of titanium and zirconium carbides and nitrides after structural optimization are summarized in table 2. The electronic densities of states (DOS) were calculated using the () mesh.
The above-described pseudo-potential procedure was used to study the phonon spectra of the NaCl (B1) and CsCl (B2)-type MX compounds in the framework of the density-functional perturbation theory (DFPT) described in references [14, 19]. The first-principles DFPT calculations were carried out for a () -mesh, and then the phonon densities of states (PHDOS) were computed using a () -mesh by interpolating the computed phonon dispersion curves. Both the DOS and PHDOS were calculated using the tetrahedron method implemented in the ‘‘Quantum-ESPRESSO’’ code [14].
| Phase | Type | Space Group | No | ||||||
|---|---|---|---|---|---|---|---|---|---|
| TiC | -TiC (B1) | Fm3̄m | 225 | 2 | 4.318 | 4.318 | 4.318 | 10.064 | |
| (4.318) | |||||||||
| (4.327) | |||||||||
| {4.327} | |||||||||
| AsNi (B8) | P63/mmc | 194 | 4 | 3.170 | 3.170 | 4.608 | 10.025 | ||
| TlI | Cmcm | 63 | 8 | 2.953 | 8.951 | 3.112 | 10.259 | ||
| NiAs (B8) | P63/mmc | 194 | 4 | 3.032 | 3.032 | 5.356 | 10.660 | ||
| WC (B) | P6̄m2 | 187 | 2 | 3.054 | 3.054 | 2.656 | 10.727 | ||
| CoSn (B35) | P6/mmm | 191 | 6 | 4.705 | 4.705 | 3.280 | 10.480 | ||
| CsCl (B2) | Pm3̄m | 221 | 2 | 2.700 | 2.700 | 2.700 | 9.842 | ||
| TiN | -TiN (B1) | Pm3̄m | 225 | 2 | 4.318 | 4.318 | 4.318 | 10.064 | |
| (4.318) | |||||||||
| (4.327) | |||||||||
| {4.315} | |||||||||
| ZnS (B3) | F4̄3m | 216 | 2 | 4.595 | 4.595 | 4.595 | 12.127 | ||
| WC (B) | P6̄m2 | 187 | 2 | 2.899 | 2.899 | 2.696 | 9.811 | ||
| CsCl (B2) | Pm3̄m | 221 | 2 | 2.636 | 2.636 | 2.636 | 9.158 | ||
| ZrC | -ZrC | Fm3̄m | 225 | 2 | 4.706 | 4.706 | 4.706 | 13.028 | |
| (4.694) | |||||||||
| (4.730) | |||||||||
| {4.705} | |||||||||
| CsCl (B2) | Pm3̄m | 221 | 2 | 2.946 | 2.946 | 2.946 | 12.784 | ||
| {2.919} | |||||||||
| ZrN | -ZrN (B1) | Pm3̄m | 225 | 2 | 4.592 | 4.592 | 4.592 | 12.104 | |
| (4.585) | |||||||||
| (4.600) | |||||||||
| {4.591} | |||||||||
| CsCl (B2) | Pm3̄m | 221 | 2 | 2.840 | 2.840 | 2.840 | 11.453 | ||
| {2.836} |
X-ray powder diffraction file [089-3828]
X-ray powder diffraction file [065-0242]
Ref. [7]
X-ray powder diffraction file [038-1420]
X-ray powder diffraction file [065-0414]
X-ray powder diffraction file [065-0332]
X-ray powder diffraction file [065-0962]
Ref. [12]
X-ray powder diffraction file [078-1420]
X-ray powder diffraction file [065-0961]
To check the acceptability of the chosen conditions for the calculations we estimate the heat of formation of B1-MX, , using the expression , where is the total energy of the bulk compound with atoms of all the involved elements (Ti, Zr, C, and N), and is the total energy of the bulk hexagonal close-packed structure for Ti or Zr (space group P63/mmc, No. 194) and diamond (A4) for C, and half the total energy of N2 molecule for N, respectively. The total energy and equilibrium bond length of N2 molecule were computed using the extended two-atom cubic cell. The bond length of N2 molecule was in agreement with the experiment (1.098 Å) within 1%. The computed values of for NaCl-type (B1) TiC, TiN, ZrC and ZrN are summarized in table 3 in comparison with the corresponding experimental and theoretical values from other studies. We note that although theoretical formation energies are fairly consistent with each other, they are all somewhat higher than the experimentally determined values. One plausible reason for such a discrepancy for zirconium carbide and nitride was discussed in reference [20]. The reliability of the DFPT calculations of TMC was proved in reference [21]. Here, we only compare the calculated phonon spectrum with the experimental dispersion curves for TiN [22] to confirm that the DFPT results correctly reproduce the anomalies in the phonon spectra for TMC.
| Phase | Methodology or Experiment | Reference | |
|---|---|---|---|
| TiC | Quantum ESPRESSO-GGA | This work | |
| Experiment | [2] | ||
| Experiment | [23] | ||
| CASTEP-GGA | [24] | ||
| TiN | Quantum ESPRESSO-GGA | This work | |
| Experiment | [2] | ||
| Experiment | [25] | ||
| Experiment | [26] | ||
| CASTEP-GGA | [24] | ||
| Dmol-GGA | [27] | ||
| FLAPW-GGA | [28] | ||
| ZrC | Quantum ESPRESSO-GGA | This work | |
| Experiment | [2] | ||
| Experiment | [29] | ||
| VASP-GGA | [30] | ||
| FPLMTO-LDA | [31] | ||
| VASP-GGA | [20] | ||
| ZrN | Quantum ESPRESSO-GGA | This work | |
| Experiment | [2] | ||
| Experiment | [26] |
3 Results and discussion
To predict the possible stable structures of MX, at first we performed total energy calculations for different phases of TiC and TiN that were identified for other binary compounds (NbN, WC, MoC, CoSn, CsCl, NiAs, ZnS, etc.) at equilibrium [1, 2]. The structural and energetic characteristics of the most stable phases of TiC and TiN are summarized in table 2. It is worth noting that B1 is the most stable among all the calculated structures, and a good agreement exists between the computed and experimental structural parameters shown in table 2.
In order to predict the possible stable phases of TiC and TiN under high pressure we calculated the total energies () of all the TiC and TiN phases presented in table 2 as functions of cell volume (). The analysis of the calculated volume dependence of the total energies, , enabled us to identify only the CsCl-type structures that could be derived from the B1-phases at high pressure. Under these circumstances, for ZrC and ZrN, we performed total-energy calculations for only two phases with the NaCl (B1) and CsCl (B2)-type structures (cf. table 2). We did not find any stable orthorhombic phase of TiC at pressure, as it was predicted in reference [6]: the TiB-type TiC phase automatically transformed to the B1 structure during static relaxation, and the B1-type TiC did not transform into the TlI-type TiC under pressure, although the latter structure was quite stable at equilibrium (cf. table 2). Such a discrepancy in the prediction of new phases in TiC is attributed to an inappropriate procedure of geometry optimization used in reference [6].


The total energies as functions of cell volume and enthalpies as functions of pressure for the B1- and B2-phases are shown in figure 1. One can see that, for the MX phases, the B1-to-B2 first-order phase transition takes place at high pressure. The calculated values of transition pressure () are presented in table 1, where, for comparison, the values of obtained from other first-principles and empirical-potential calculations are also shown. It is seen that all the calculated characteristics agree well except for calculated from the two-body empirical potential approach [8, 10, 13]. The lower values of in this approach are likely to be a consequence of the neglect of the many-body interactions.
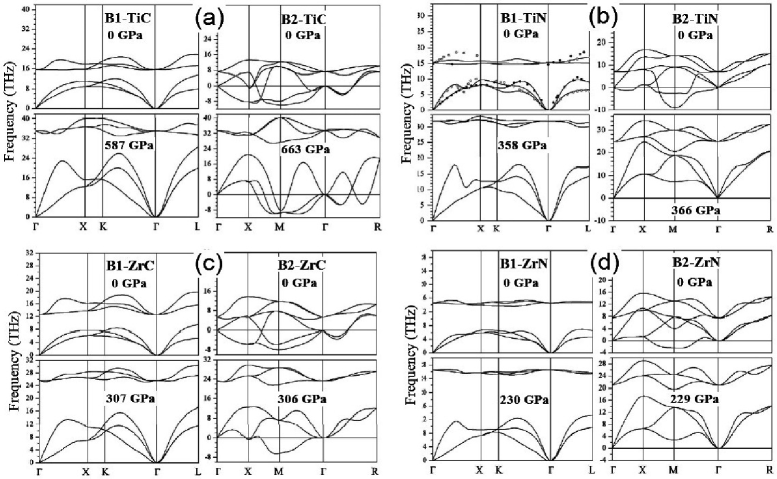
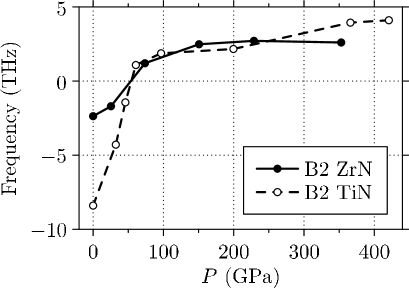
With the B1-to-B2 phase transitions in MX under pressure now being established, we need to verify that the new pressure-induced phases are dynamically stable. To address this issue, we calculated the phonon dispersion curves along some high-symmetry directions of -space for the B1- and B2-phases of MX at equilibrium and under pressure . The calculated phonon spectra are shown in figure 2. We note that the phonon spectra of all B1-phases do not contain any soft modes, which means that theses phases should be dynamically stable up to very high pressures. On the contrary, a softening of the acoustic phonon modes around the X and M points is observed in the phonon spectrum of the B2-structures at equilibrium, which implies that these phases are dynamically unstable. For TiC and ZrC, the condensed phonon modes are preserved even at high pressures [cf. figures 2 (a), (c)]. On the other hand, the titanium and zirconium nitrides with the B2 (CsCl-type) structure can be stabilized by the application of high pressure. In figure 3 we show the dependence of the soft M4-modes on pressure for TiN and ZrN. Clearly, the phonon anomalies in these nitrides disappear at GPa.
To understand the plausible origin of the dynamical instability of the B2-MX phases, let us investigate the electronic structure of the B1 and pressure-induced B2 phases. The densities of states (DOS) of the B1- and B2-MX phases at equilibrium are shown in figure 4.


In the case of B1-MX, at increasing energy, the lowest bands are associated with the states of X, then the next bands originate from X - and M -states, and finally, the broad M -bands with a small admixture of X states are located above the minimum of the DOS. There is a new type of M- — M- interactions in B2-based structures that are absent in B1-MX. As a result, several local peaks appear at the bottom of the metal band. One can see that, for all the B2-MX phases, the Fermi level () crosses the local DOS maximum in the region of the spectrum formed by the M- states (the partial DOS is not shown here). A high DOS at the Fermi level is usually associated with a structural instability and with the existence of soft phonon modes in the long-wave region, and the collapse of these modes leads to a structural transformation. Thus, the high DOS at the Fermi level identified in the case of B2-MX can be one of the reasons for the dynamical instability of these phases.
As a final note, since modern high-pressure devices can generate pressures up to 550 GPa that are higher than the maximum pressure of the earth’s core (360 GPa) [32], we hope that our theoretical findings will motivate further high-pressure experiments to establish new pressure-induced phases in transition metal compounds including those that were examined in this work.
4 Conclusions
Phase stability of various phases of MX (M = Ti, Zr; X = C, N) at equilibrium and under pressure was examined based on the first-principles calculations of the electronic and phonon structures. The calculated formation energies are in good agreement with the corresponding experimental values. The analysis of the dependencies of enthalpy and phonon spectra on pressure for these phases enabled us to bring the following conclusions.
It follows from the total energy calculations that all B1-MX structures undergo a phase transformation to the B2-structures under high pressure in agreement with the previous total-energy calculations. The B1-MX structures are dynamically stable under very high pressure ( GPa). The calculated phonon spectra show that the B2-MX compounds have got collapsed acoustic modes at ambient and high pressures. However, B2-based TiN and ZrN can be dynamically stabilized at pressures above 55 GPa. The first-order B1-to-B2 phase transition in these nitrides is not related to a softening of the phonon modes. For B2 MX, a high density of states at the Fermi level may be responsible for the dynamical instability of these phases.
Acknowledgements
This work was supported by the STCU Contract No. 5539. The work of P. T. was performed under the auspices of the U. S. Department of Energy by the Lawrence Livermore National Laboratory under contract No. DE–AC52–07NA27344.
References
- [1] Toth L.E., Transition Metal Carbides and Nitrides, Academic, New York, 1971.
- [2] Samsonov G.V., Vinitskii I.M., Handbook of Refractory Compounds, Plenum, New York, 1980.
- [3] Veprek S., J. Nanosci. Nanotechnol., 2011, 11, 14; doi:10.1166/jnn.2011.3815.
- [4] Dubrovinskaia N.A., Dubrovinsky L.S., Saxena S.K., Ahuja R., Johansson B., J. Alloys Compd., 1999, 289, 24; doi:10.1016/S0925-8388(99)00159-0.
- [5] Winkler B., Juarez-Arellano E.A., Friedrich A., Bayarjargal L., Yan J.Y., Clark S.M., J. Alloys Compd., 2009, 478, 392; doi:10.1016/j.jallcom.2008.11.020.
-
[6]
Zhao Z., Zhou X., Wang L., Xu B., He J., Liu Z., Wang H., Tian Y., Inorg.
Chem., 2011, 50, 9266;
doi:10.1021/ic200356x. - [7] Ahuja R., Eriksson O., Wills J.M., Johansson B., Phys. Rev. B, 1996, 53, 3072; doi:10.1103/PhysRevB.53.3072.
- [8] Ojha P., Aynyas M., Sanyal S.P., Optoelectron. Adv. Mat., 2008, 2, 50.
- [9] Liu K., Zhou X., Chen H., Lu L., J. Therm. Anal. Calorim., 2012, 110, No. 2, 973; doi:10.1007/s10973-011-1927-5.
- [10] Ojha P., Aynyas M., Sanyal S.P., J. Phys. Chem. Solids, 2007, 80, 148; doi:10.1016/j.jpcs.2006.09.022.
- [11] Chauhan R., Singh S., Singh R.K., Cent. Eur. J. Phys., 2008, 6, 277; doi:10.2478/s11534-008-0027-z.
-
[12]
Hao A., Zhou T., Zhu Y., Zhang X., Liu R., Mater. Chem. Phys.,
2011, 129, 99;
doi:10.1016/j.matchemphys.2011.03.060. - [13] Singh A., Aynyas M., Sanyal S.P., Cent. Eur. J. Phys., 2009, 7, 102; doi:10.2478/s11534-008-0117-y.
- [14] Giannozzi P., Baroni S., Bonini N., Calandra M., Car R., Cavazzoni C., Ceresoli D., Chiarotti G.L., Cococcioni M., Dabo I., Corso A.D., Fabris S., Fratesi G., Gironcoli S.D., Gebauer R., Gerstmann U., Gougoussis C., Kokalj A., Lazzeri M., Martin-Samos L., Marzari N., Mauri F., Mazzarello R., Paolini S., Pasquarello A., Paulatto L., Sbraccia C., Scandolo S., Sclauzero G., Seitsonen A.P., Smogunov A., Umari P., Wentzcovitch R.M., J. Phys.: Condens. Matter, 2009, 21, 395502, doi:10.1088/0953-8984/21/39/395502.
- [15] Vanderbilt D., Phys. Rev. B, 1990, 41, 7892; doi:10.1103/PhysRevB.41.7892.
- [16] Perdew J.P., Burke K., Ernzerhof M., Phys. Rev. Lett., 1996, 77, 3865; doi:10.1103/PhysRevLett.77.3865.
- [17] Monkhorst H.J., Pack J.D., Phys. Rev. B, 1976, 13, 5188; doi:10.1103/PhysRevB.13.5188.
- [18] Billeter S.R., Curioni A., Andreoni W., Comput. Mater. Sci., 2003, 27, 437; doi:10.1016/S0927-0256(03)00043-0.
- [19] Baroni S., Gironcoli S.D., Corso A.D., Gianozzii P., Rev. Mod. Phys., 2001, 73, 515; doi:10.1103/RevModPhys.73.515.
- [20] Kim S., Szlufarska I., Morgan D., J. Appl. Phys., 2010, 107, 053521; doi:10.1063/1.3309765.
- [21] Isaev E.I., Simak S.I., Abrikosov I.A., Ahuja R., Vekilov Y.K., Katsnelson M.I., Lichtenstein A.I., Johansson B., J. Appl. Phys., 2007, 101, 123519; doi:10.1063/1.2747230.
-
[22]
Kress W., Roedhammer P., Bilz H., Teuchert W.D., Christensen A.N., Phys. Rev.
B, 1978, 17, 111;
doi:10.1103/PhysRevB.17.111. - [23] Vrel D.L., Lihrmann J., Petitet J., J. Chem. Eng. Data, 1995, 40, 280; doi:10.1021/je00017a062.
- [24] Yang Y., Lu H., Yu C., Chen J.M., J. Alloys Compd., 2009, 485, 542; doi:10.1016/j.jallcom.2009.06.023.
- [25] Handbook of Chemistry and Physics, Vol. 69, Weast R.C., Astle M.J., Beyer W.H. (Eds.), Chemical Rubber Co., Boca Raton, 1988.
- [26] Chen C., Liu C., Yang H., Tsao C.Y.A., J. Vac. Sci. Technol. B, 2004, 22, 1075; doi:10.1116/1.1738669.
- [27] Hao S., Delley B., Stampfl C., Phys. Rev. B, 2006, 74, 035402; doi:10.1103/PhysRevB.74.035402.
- [28] Stampfl C., Mannstadt W., Asahi R., Freeman A.J., Phys. Rev. B, 2001, 63, 155106; doi:10.1103/PhysRevB.63.155106.
- [29] Guillermet A.F., J. Alloys Compd., 1995, 217, 69; doi:10.1016/0925-8388(94)01310-E.
- [30] Li J., Liao D., Yip S., Najafabadi R., Ecker L., J. Appl. Phys., 2003, 93, 9072; doi:10.1063/1.1567819.
-
[31]
Hogosson H.W., Eriksson O., Jansson U., Johansson B., Phys. Rev. B, 2001,
63, 134108;
doi:10.1103/PhysRevB.63.134108. - [32] Xu J.A., Mao H.K., Bell P.M., Science, 1986, 232, 1404; doi:10.1126/science.232.4756.1404.
Ukrainian \adddialect\l@ukrainian0 \l@ukrainian
Фазовий перехiд з B1 в B2 у карбiдах i нiтридах титану та цирконiю пiд тиском В.I. Iващенко, П.Е.А. Турчi, В.I. Шевченко
Iнститут проблем матерiалознавства НАН України, вул. Кржижанiвського, 3,
03142 Київ, Україна
Лоуренсiвська нацiональна лабораторiя в Лiверморi (Л–352),
поштова скринька 808,
Лiвермор, CA 94551, США