Dielectric properties of PLZT- () under mechanical stress, electric field and temperature loading
Abstract
We investigated the effect of uniaxial pressure ( bars) applied parallely to the ac electric field on dielectric properties of PLZT- () ceramics. There was revealed a significant effect of the external stress on these properties. The application of uniaxial pressure leads to the change of the peak intensity of the electric permittivity (), of the frequency dispersion as well as of the dielectric hysteresis. The peak intensity becomes diffused/sharpened and shifts to a higher/lower temperatures with increasing the pressure. It was concluded that the application of uniaxial pressure induces similar effects as increasing the Ti ion concentration in PZT system. We interpreted our results based on the domain switching processes under the action of combined electromechanical loading.
Key words: ferroelectric, PLZT-x/65/35, dielectric properties, uniaxial pressure
PACS: 77.84.Lf, 77.80.bg
Abstract
Ми дослiдили вплив одновiсного тиску ( bars), прикладеного паралельно до змiнного електричного поля, на властивостi керамiки PLZT- (). Виявлено значний вплив зовнiшнього напруження на цi властивостi. Прикладання одновiсного тиску веде до змiни пiку iнтенсивностi електричної проникностi (), частотної дисперсiї i дiелектричного гiстерезису. Пiк iнтенсивностi стає розмитий/загострений i зсувається до вищих/нижчих температур з ростом тиску. Робиться висновок, що прикладання одновiсного тиску iндукує подiбнi ефекти як пiдвищення концентрацiї iонiв Ti в системi PZT. Ми iнтерпретуємо нашi результати на основi процесiв перемикання доменiв пiд дiєю комбiнованого електромеханiчного навантаження.
Ключовi слова: сегнетоелектрик, PLZT-x/65/35, дiелектричнi властивостi, одновiсний тиск
1 Introduction
Single crystals, ceramics, polymers and ceramic-polymer composites which show ferroelectric behavior are used in many applications in electronics and optics. A large number of applications of ferroelectrics exploit dielectric, piezoelectric, pyroelectric and electro-optic properties. Ferroelectric crystals are commonly used in many areas of science and technology. Possibilities of the practical use of these ceramics are associated with their outstanding electro-mechanical properties. A very small amount of dopants may be sufficient to have a noticeable effect on macroscopic properties of these technologically important materials. Ferroelectrics can be modified not only by purposeful doping but also by impurities or by defects formed at high processing temperatures. Softening and hardening of ferroelectrics by acceptor and donor doping are the key tools to control their electrical and mechanical properties. These properties include e.g. switching and hysteresis behavior, frequency dispersion and nonlinearity of electromechanical properties. PZT ceramics can be doped with ions to form soft and hard lead zirconate titanates. The soft one have a higher permittivity, larger electrical losses, higher piezoelectric coefficient and are easy to polarize and depolarize. They can be used for applications requiring very high piezoelectric properties. The hard one have a lower permittivity, smaller electrical losses, lower piezoelectric coefficients and are more difficult to polarize and depolarize. They can be used for rugged applications [1]. Ferroelectrics could be modified by substitutions of Pb2+ ions in PZT ceramics by La2+ one (i.e. PLZT). For PLZT-/65/35 with , a paraelectric to ferroelectric phase transition occurs as the temperature is lowered through the Curie point and a second structural transition occurs at a lower temperature [2]. For PLZT-/65/35 with no paraelectric to ferroelectric transition occurs as the temperature is lowered through and ceramic shows a broad peak in the low frequency dielectric constant, [3]. Compositions /65/35 with exhibits typical relaxor behaviors such as frequency-dependent electric permittivity maximum, existence of polar nanoregions at temperatures above the diffuse phase transition point and broad distribution of relaxation times [4]. The incorporation of aliovalent lanthanum into the lattice enhances the densification rates of the PZT ceramics, leading to pore-free homogeneous microstructures. In many device applications, ceramics are subjected to combined electric and stress fields, so a better understanding of phenomena occurring under electromechanical loading is essential. In the present study the results of dielectric properties measurements of PLZT ceramics with a Zr/Ti ratio of 65/35 and variable La content (2–13 at.%) under uniaxial pressure applied parallel to the ac electric field were presented.
2 Experimental procedure
2.1 Material
PLZT- with a different content of lanthanum powders were acquired by two-stage co-precipitation method from mixed solution of inorganic salts ZrOClH2O, TiCl4, La(NO2)H2O and Pb(NO3)2 well described in paper [5]. At the first stage, the hydroxypolymer of TiO2-ZrO2-La2O3 is obtained by co-precipitation with 25% NH4OH from a mixed solution of the corresponding metallic salts. At the second stage, PbO was introduced into the mixture of TiO2-ZrO2-La2O3. Ceramic samples were prepared by a two-stage hot-pressing technology [5]. The first stage was performed at for hour in vacuum at pressure 200 MPa. The second stage was performed at for hours depending on the size ( mm diameter) at pressure 200 MPa in the air or in O2 rich atmosphere. As a result, high density and transparent ceramics were obtained.
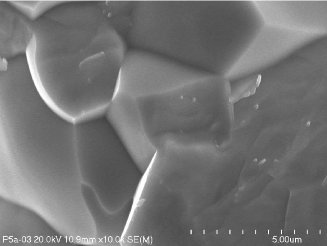
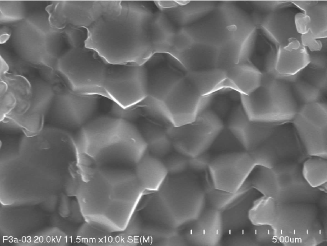
(a) (b)
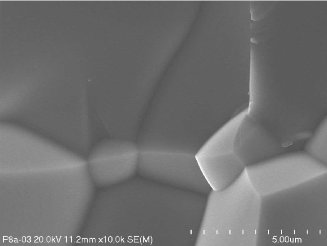
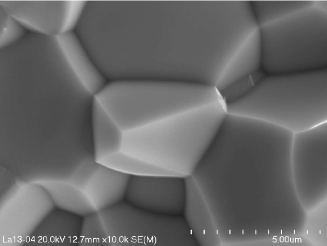
(c) (d)
2.2 Microstructure measurements
The scanning electron microscope (SEM) Hitachi S-4700, equipped with an energy dispersive X-ray spectrometer (EDS) having Si(Li) X-ray detector, was used for the investigation of the microstructure of ceramics. The EDS analysis was performed using the Noran-Vantage system.
2.3 Dielectric measurements
The dielectric measurements were carried out in a weak electric field (30 V/cm) using BM 595A LCR meter in a temperature range from room temperature to 460. The samples were previously electroded by silver paste. The temperature of samples was controlled by a thermocouple with the accuracy of 0.1. Prior to the experiments, the samples were heated for at least 1h at about 500 to release both internal strains and those at the electrode/sample interface. The temperature dependence of the permittivity was measured during heating and cooling processes at the rate of l00/h. Compressive stress within the range of () bar was applied parallel to the measuring electric field with the use of a lever and a weight.
3 Results and discussion
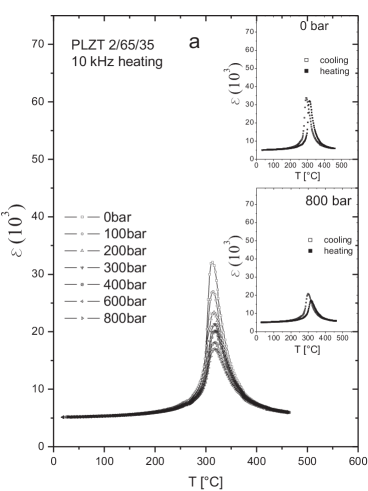
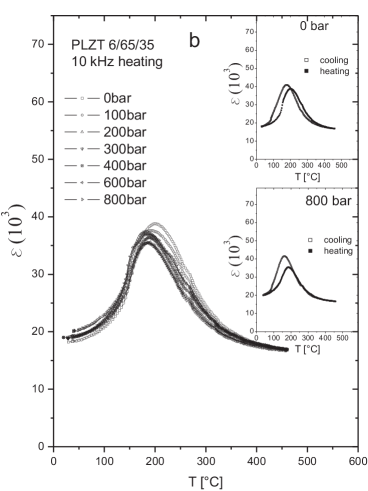
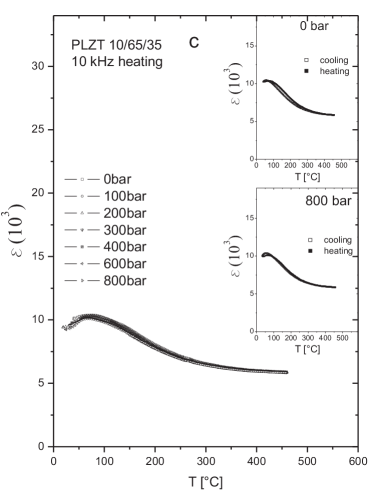
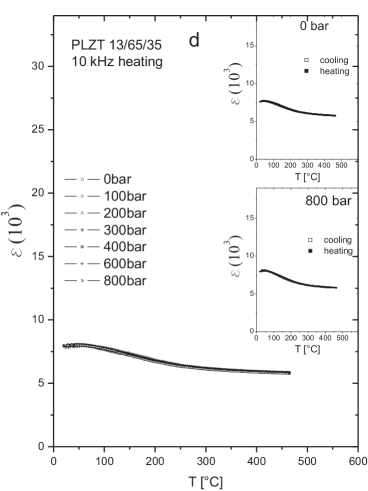
Figure 1 shows the cross-section morphological feature of PLZT- with and . As can be seen from this figure, dense and crack-free ceramics without second phases were sintered. The average grain size of the regular crystal-shape ceramics is ca. for PLZT- with and . The crystalline boundaries are clearly observed. The EDS analyses completed for individual grains in different compositions indicated a homogenous distribution of all elements in ceramics. Chemical analysis of the obtained samples performed by emission microanalyzer for Pb, Zr, Ti and La agreed well with the nominal composition of PLZT.
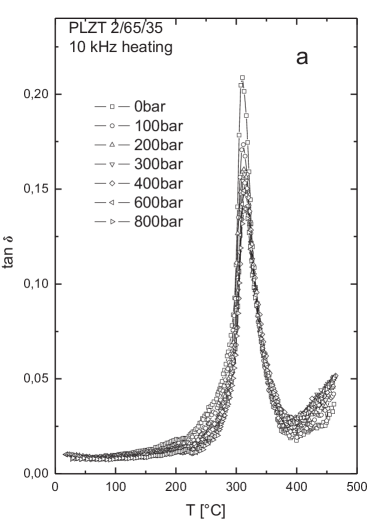
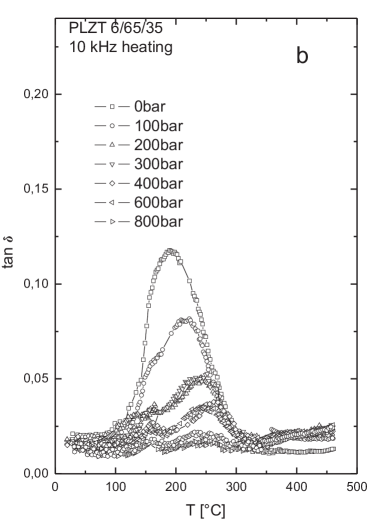
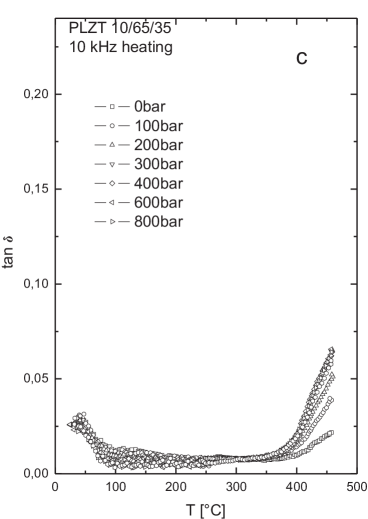
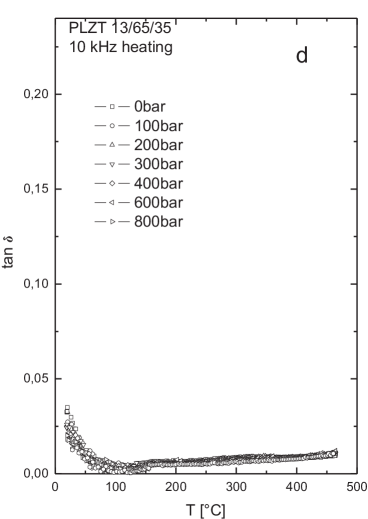
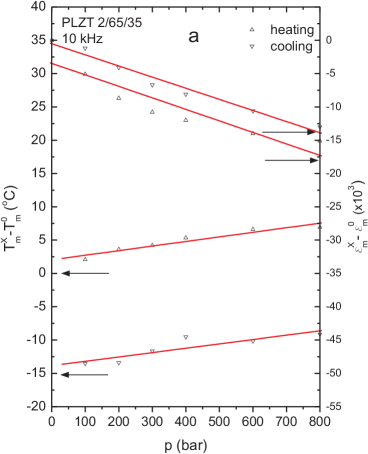
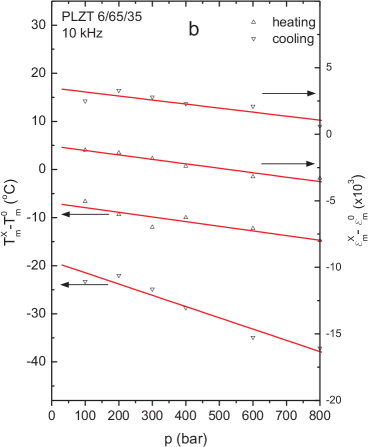
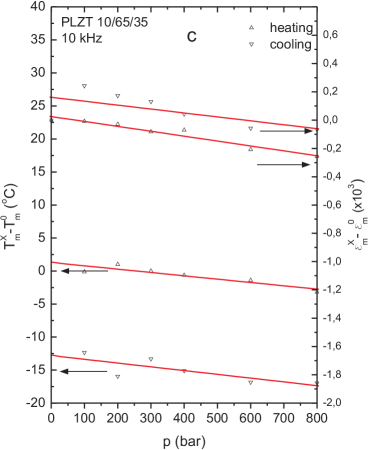
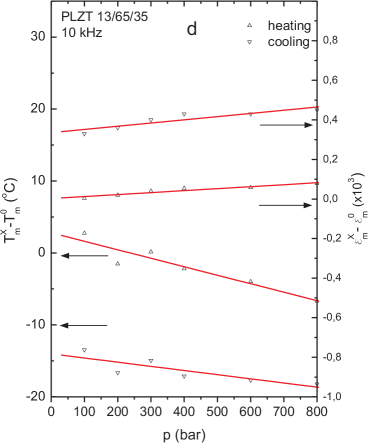
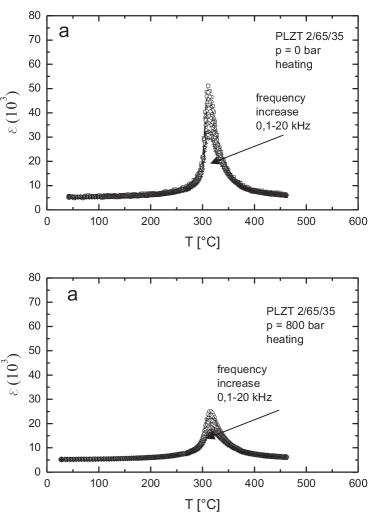
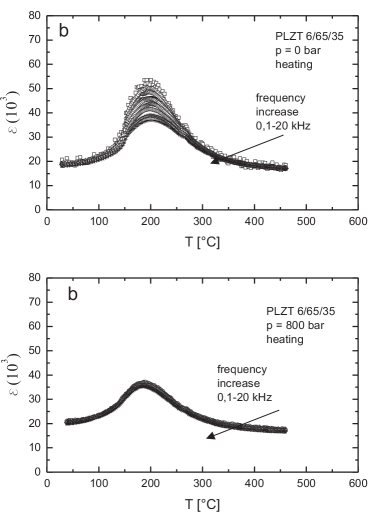
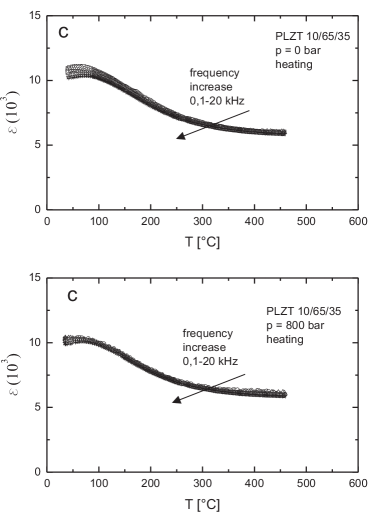
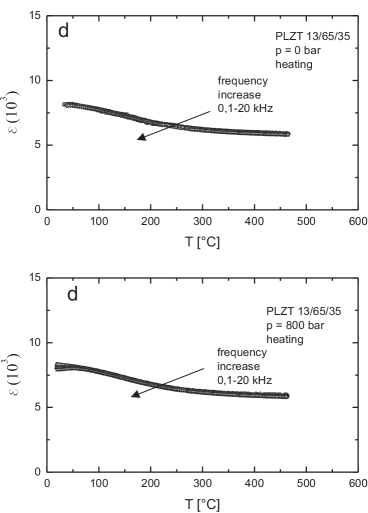
The temperature/frequency dependence of the electric permittivity for the pressure applied parallel to the ac electric field for the PLZT ceramics analyzed are presented in figures 2–5. The main outcome obtained from these dependences show that with an increase of pressure:
-
1.
The maximum becomes more diffuse. The results in figure 2 reveal a remarkable reduction of the temperature of the maximum dielectric permittivity () and an increase in the diffuseness of the dielectric permittivity peak by increasing the La3+ content on the Pb2+ site. A further result of the pressure application is the reduction of thermal hysteresis (inserts in figure 2). These can suggest the character of the transformation change to the second order.
-
2.
The temperature of maximum () shifts toward higher temperature of approximately /kbar for PLZT- with and downward toward lower temperature of approximately /kbar, /kbar and /kbar for PLZT- with and , respectively, on heating. The temperature of maximum () shifts toward higher temperature of approximately /kbar for PLZT- with and downward toward lower temperature of approximately /kbar, /kbar and /kbar, for PLZT- with and , respectively, on cooling. The up and down shifts are nearly linear in the range of pressure from 0 to 1kbar for the analyzed PLZT- ceramics ( and ) (figure 4 and table 1).
- 3.
-
4.
The maximum value of the electric permittivity decreases gradually with an increasing applied pressure for PLZT- with and , and increases gradually with an increasing applied pressure for PLZT- with . The maximum values of the electric permittivity change approximately /kbar, /kbar, /kbar and /kbar for PLZT- with and , respectively, on heating. The maximum value of the electric permittivity changes approximately /kbar, /kbar, /kbar and /kbar for PLZT- with and , respectively, on cooling. The changes of maximal value of permittivity caused by the uniaxial pressure show that shifts are nearly linear in the range of pressure from 0 to 1 kbar for all the PLZT ceramics analyzed.
-
5.
The dielectric dispersion decreases with an increasing La3+ content for PLZT- with and . The values of the electric dispersion change approximately from /kHz at bar to about 540/kHz at kbar, from /kHz at bar to about 90/kHz at kbar, from /kHz at bar to about 18/kHz at kbar, and from /kHz at bar to about 8/kHz at kbar for PLZT- with and , respectively.
-
6.
The dielectric dispersion decreases with an increasing applied pressure for PLZT- with and .
-
7.
Dielectric losses change in a way similar to dielectric constant. The maximum intensity of the curve decreases, becomes more diffuse and shifts toward lower temperature for PLZT- with and (figure 3).
The samples, which are more sensitive to pressure are PLZT- with (the highest on cooling) and PLZT- with (the highest on heating). The sample, which is also more sensitive to the frequency of the measured electric field (the highest ) is PLZT- with (figure 5 and table 1).
| Sample | (heating) | ||
|---|---|---|---|
| (heating/cooling) | (heating/cooling) | bar/ kbar | |
| PLZT 2/65/35 | /kbar | /kbar | 955/540/kHz |
| PLZT 6/65/35 | /kbar | /kbar | 830/90/kHz |
| PLZT 10/65/35 | /kbar | /kbar | 39/18/kHz |
| PLZT 13/65/35 | /kbar | /kbar | 0/8/kHz |
The changes in properties of ceramics under the mechanical load ( bars) can be attributed to the creation or annihilation of detects, an elastic change of distances between ions in the crystal structure and to a change in the domain structure. It is difficult to estimate the contribution of each mechanism. The contribution coming from the changes in the density of defects can be negligible because the changes of the properties are reversible after heating to high temperature followed by cooling [1]. Changes in the distance between ions can lead to the variations of phase transition temperature by changes of interaction constants or by changes of dipole moments. The phase transition temperature will increase or decrease depending on which mechanism is predominant [6]. Changes in the domain structure, i.e., induced domain wall movement and domain switching may be derived from applying a mechanical stress. Mechanical load in the investigated materials is large enough to reduce the density of the domains in the direction parallel to the stress by non- domain switching and to increase the density of the domain in perpendicular direction. This implies a decrease of the domain ordering in one direction and an increase of the domain ordering in the opposite direction. Electric and elastic nanoregions in PLZT can be reoriented by uniaxial pressure in the direction in which pressure is applied for PLZT- with 6. Nanoregions are forced in the new positions and their contribution to the electric permittivities is smaller, and thus and tan decrease (figures 2–5). A further effect of the applied pressure can be an increase in sizes of nanoregions and their combination into larger complexes, which results in a weaker dielectric response. These effects can cause a narrowing distribution of relaxation time, which in turn can lead to a suppression of dispersion in the frequency range used.
For a normal ferroelectric above the temperature of the phase transition (), the electric permittivity falls off with temperature according to:
| (1) |
where is the Curie constant and is the Curie-Weiss temperature. Both and decrease with an increasing pressure. It was found that for our samples ( bar), starts to obey the Curie-Weiss law at temperatures higher than (e.g. temperature at which reaches the maximum). Deviation degree of from the Curie-Weiss law can be defined by as follows: , where is the temperature, at which starts to obey the Curie-Weiss law. It is found that for bar, , 14, 18, and 23 for PLZT- with and , respectively. For bar: , 13, 26, and 32 for PLZT- with and , respectively. This implies that the applied uniaxial pressure weakens (for PLZT- with and ) or enhances (for PLZT- with and ) the diffuse phase transformation behavior.
A modified expression of Curie-Weiss law explains the diffuseness of ferroelectric phase transition described by:
| (2) |
where and are constants, value is between 1 and 2. The limiting value =1 reduces the equation to normal Curie-Weiss law (for classical ferroelectrics) and reduces the equation to quadratic (for relaxor ferroelectrics) [7]. The dependence of on according to equation (2) for the analyzed ceramics shows the slope of the curve giving the diffuseness constant . A nearly linear correlation is observed on heating for kHz and for bar there is obtained , , and, for PLZT-, and , respectively. However, for higher pressures, increases indicating that a classical ferroelectric seems to change to a relaxor one. For bar there is obtained , , , for PLZT-, and , respectively.
PLZT ceramics have perovskite-type ABO3 structure with Zr/Ti ions located at the place of the B cations and Pb/La ions occupying the A-sites. Pb ions displace in the direction of smaller Ti ions. The positive charge of the Ti ion, whose atomic radius is smaller than that of Zr ion, is better screened by surrounding oxygen ions and allows a shorter Pb-Ti distance [8]. The incorporation of Ti ions instead of Zr to PbZrO3 leads to an increase of the phase transition temperature in PZT system. Due to a smaller ionic radius of the Ti ion than Zr one, the material was subjected to compressive stress with an increased Ti content. This could explain why the compressive stress induces a similar effect as that from an increase of the concentrations of Ti ions in PZT.
4 Conclusions
High density PLZT- ( and ) ceramics with the average grain size of ca. was obtained by a two-stage hot-pressing technology. The effect of the uniaxial pressure on dielectric response of these ceramics has been examined. There is a diffuse transition in the examined PLZT ceramics, and the diffuseness constant depends on pressure. With an increase of pressure, the phase transition temperature, the frequency dispersion and the thermal hysteresis change, and the dielectric behavior characteristics spread. Applying uniaxial pressure or increasing the Ti content in a PZT system would induce similar effects.
References
- [1] Suchanicz J., Kim-Ngan N.T., Konieczny K., Jankowska-Sumara I., Balogh A.G., J. Appl. Phys., 2011, 109, 104105; doi:10.1063/1.3585826.
- [2] Simpson G., Keve E., Ferroelectrics, 1976, 12, 229–231; doi:10.1080/00150197608241435.
- [3] Carl K., Geisen K., Proc. IEEE, 1973, 61, 967–974; doi:10.1109/PROC.1973.9186.
- [4] Kamba S., Bovtun V., Petzelt J., Rychetsky I., Mizaras R., Brilingas A., Banys J., Grigas J., Kosec M., J. Phys.: Condens. Matter, 2000, 12, 497–519; doi:10.1088/0953-8984/12/4/309.
- [5] Dambekalne M., Antonova M., Livinsh M., Garbarz-Glos B., Smiga W., Sternberg A., J. Eur. Cer. Soc., 2006, 26, 2963–2966; doi:10.1016/j.jeurceramsoc.2006.02.012.
- [6] Suchanicz J., Wojcik K., Mat. Sci. Eng. B, 2003, 104, 31–35; doi:10.1016/S0921-5107(03)00263-0.
- [7] Uchino K., Nomura S., Ferroelectrics, 1982, 44, 55–61; doi:10.1080/00150198208260644.
- [8] Kuzmin A., Purans J., Sternberg A., In: Proceeding of the NATO Advanced Research Workshop ‘‘Defects and Surface-Induced Effects in Advanced Perovskites’’ (Jurmala, 1999), Vol. 77, Kluwer Academic Publishers, Dordrecht, 2000, p. 145–150.
Ukrainian \adddialect\l@ukrainian0 \l@ukrainian
Дiелектричнi властивостi PLZT- () пiд впливом механiчного напруження, електричного поля i температурного навантаження
К. Питель, Я. Суханич, М. Лiвiнш, А. Стернберг
Iнститут технологiї, Педагогiчний унiверситет, 30–084
Кракiв, Польща
Iнститут фiзики, Педагогiчний унiверситет,
30–084 Кракiв, Польща
Iнститут фiзики твердого тiла,
Унiверситет Латвiї, 1063 Рига, Латвiя