11email: gcastell@iafe.uba.ar 22institutetext: National Centre for Radio Astrophysics (NCRA), Pune, India
A hadronic scenario for HESS J1818154
Abstract
Aims. G15.4+0.1 is a faint supernova remnant (SNR) that has recently been associated with the -ray source HESS~J1818$-$154. We investigate a hadronic scenario for the production of the -ray emission.
Methods. Molecular 13CO (J=10) taken from the Galactic Ring Survey (GRS) and neutral hydrogen (HI) data from the Southern Galactic Plane Survey (SGPS) have been used in combination with new 1420 MHz radio continuum observations carried out with the Giant Metrewave Radio Telescope (GMRT).
Results. From the new observations and analysis of archival data we provided for the first time a reliable estimate for the distance to the SNR G15.4+0.1 and discovered molecular clouds located at the same distance. On the basis of HI absorption features, we estimate the distance to G15.4+0.1 in 4.81.0 kpc. The 13CO observations clearly show a molecular cloud about 5′ in size with two bright clumps, labeled A and B, clump A positionally associated with the location of HESS J1818154 and clump B in coincidence with the brightest northern border of the radio SNR shell. The HI absorption and the 13CO emission study indicates a possible interaction between the molecular material and the remnant. We estimate the masses and densities of the molecular gas as (1.20.5)103M⊙ and (1.5 0.4)103 cm-3 for clump A and (3.00.7103M⊙ and (1.10.3)103 cm-3 for clump B. Calculations show that the average density of the molecular clump A is sufficient to produce the detected -ray flux, thus favoring a hadronic origin for the high-energy emission.
Key Words.:
ISM: individual objects: SNR G15.4+0.1, HESS J1818154-ISM: supernova remnants-Gamma rays: ISM-Radio continuum: ISM1 Introduction
The source G15.4+0.1 was first identified as a faint supernova remnant (SNR) during a survey of the Galactic plane carried out with the Very Large Array (VLA) at 330 MHz (Brogan et al. 2006). It is characterized by an almost circular shell with a diameter of nearly 15′. The emission is brighter on the northern side of the radio shell and decreases toward the south, where a break-out morphology is observed. Based on data acquired with H.E.S.S., Hofverberg et al. (2011) report the discovery of the TeV source HESS J1818154 (size 8′.5) in spatial coincidence with the interior of the SNR shell. The -ray source has a hard energy spectrum with a photon index =-2.1 and a total integral flux above 1 TeV of 4.0 10-13 cm-2 s-1. On the basis of the morphological correspondence between the brightest hotspot of HESS J1818154 and the inner part of radio emission from G15.4+0.1, the authors propose that the high energy radiation originates in a pulsar wind nebula (PWN) of a still undetected pulsar.
To investigate the origin of the TeV -ray emission, we undertook a combined study that includes new observations of the radio continuum emission associated with G15.4+0.1, a search for pulsations from a possible pulsar, and a characterization of the surrounding interstellar medium (ISM). In this Letter, we present a new radio continuum image of G15.4+0.1 at 1.4 GHz obtained using the Giant Metrewave Radio Telescope (GMRT, India) and the first study of the atomic and molecular gas distribution in the vicinity of G15.4+0.1. The search for pulsations will be reported elsewhere. We also determine the distance to the remnant and investigate a possible hadronic scenario to explain the high energy emission in the G15.4+0.1/HESS J1818154 system.
2 Data
The continuum image of G15.4+0.1 was constructed using new data acquired with the GMRT on 2012 May 10 and 11. To recover the large-scale structure missing in the interferometric image, we added single-dish data from the Effelsberg 100m telescope. We employed a standard procedure to reduce the data using the NRAO Astronomical Image Processing System (AIPS) package. The resulting image has a sensitivity of 0.11 mJy beam-1 with a synthesized beam of 3′′.53. A detailed study of the radio emission from G15.4+0.1 will be reported separately.
The molecular 13CO (J=10) line data come from the Galactic Ring Survey (GRS) (Jackson et al. 2006) while the 21 cm HI observations were taken from the Southern Galactic Plane Survey (SGPS) (McClure-Griffiths et al. 2005). On the basis of these data, we have identified molecular material that we propose is physically associated with SNR G15.4+0.1.
3 Results
In Fig. 1 we present the distribution of the molecular gas integrated from 46.0 to 50.3 km s-1, the range where the CO emission is more intense (LSR radial velocities), with superposed contours of the radio emission at 1420 MHz. The left hand frame displays the 1420 MHz continuum image of G15.4+0.1 for comparison.
The analysis of the whole 13CO (J=10) data cube shows evidence of a nonuniform density distribution of the ISM in the region around G15.4+0.1. We identify two clumps of molecular gas, named in what follows as clumps A and B, which are apparently part of the same cloud (see Fig. 1b). The molecular clump A, centered at R.A.(J2000), dec.(J2000), appears projected onto the TeV source, while clump B at the position R.A., dec. coincides with the bright northern portion of the remnant. In what follows we analyze whether the high energy emission is related to these two clumps.

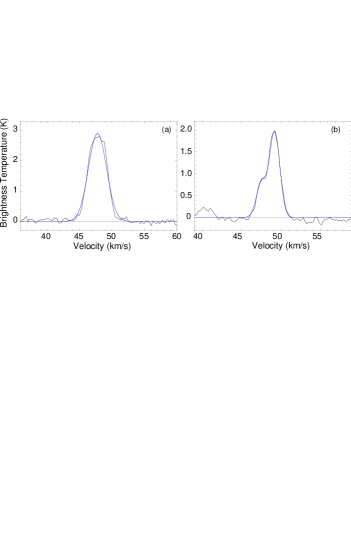
The 13CO spectra observed toward clumps A and B (in an area of 1.46 square arcminutes) are shown in Fig. 2. The average spectrum for clumps A and B are displayed in Fig. 3 in which the Gaussian fit to each spectrum is indicated by the blue curve. For clump A, the best fit, made with a single function, yields a central velocity vc and line FWHM v of 47.800.80 and 6.520.75 km s-1, respectively. For clump B the CO profile reveals a shoulder at “blueshift” velocities. This spectrum can be fitted by two Gaussian curves, with central velocities vc and line FWHM v of 49.210.65 and 6.120.84, and 47.530.46 and 6.160.75 km s-1, respectively. The presence of two velocity components might be evidence of a molecular cloud disrupted by the passage of a SNR shock front. Similar kinematical features have been observed in several cases of SNR/molecular cloud interactions, as for example in the remnants G349.7+0.2 (Dubner et al. 2004), Kes 69 (Zhou et al. 2009), and G20.00.2 (Petriella et al. 2013). Of course, an alternative explanation based on the presence of multiple molecular components along the line of sight cannot be entirely ruled out.

3.1 HI, 13CO spectra and distance constraints
To date there has not been a reliable estimate for the distance to SNR G15.4+0.1. From the Galactic - relation (surface brightness vs. diameter), Hofverberg et al. (2011) place the remnant at a distance of 10 3 kpc. However, the application of the - method to establish distance to individual SNRs has been long questioned because of the severe uncertainties caused by its dependence on considerations about intrinsic and extrinsic factors related to the supernova explosion and the evolution of the remnant. Here, in order to better constrain the distance to G15.4+0.1 we used HI absorption features seen against this SNR. In Fig. 4 we present the HI emission spectrum in the line of sight toward the brightest portion of the SNR shell, along with an absorption spectrum obtained by subtracting the emission profile from a spectrum averaged over different regions adjacent to the remnant. The maximum velocity at which we observe absorption is 60 km s-1. According to the circular rotation curve of the Milky Way by Fich et al. (1989) (assuming =220 km s-1, R0=8.5 kpc), this feature is associated with the near and far kinematical distances of 4.8 and 11.7 kpc, respectively. The distance to the SNR can be further constrained by the fact that only HI emission features are observed in the spectrum beyond 60 km s-1. If G15.4+0.1 were located farther away than 4.8 kpc, then one should observe absorption features at velocities greater than 60 km s-1 in the spectrum of the source (because in the first quadrant of the Galaxy the velocity increases with distance up to the tangent point). As a consequence, we conclude that G15.4+0.1 is located at the near distance of 4.81.0 kpc.
To establish a physical association between the SNR and the 13CO molecular material we also determined the kinematical distance to the cloud containing clumps A and B to be 4.2 and 12.3 kpc, for the near and far distances. To unambiguously establish the distance to the cloud, we used the 13CO (J=) observations in conjunction with HI data. The technique takes the atomic HI hydrogen within the cold interior of molecular clouds into account (Roman-Duval et al. 2009). As shown in Fig. 1, both clumps are embedded in the radio continuum emission from the remnant. Usually, the brightness temperature of the 21 cm continuum radiation is higher than the temperature of the cold HI coexisting with molecular clouds. If the clumps A and B are located at the near kinematical distance, all the foreground molecular clouds along the same line of sight absorb the continuum radiation. Consequently, features will be observed in the HI 21 cm spectrum coincident with 13CO emission lines up to the velocities of the clumps.
Conversely, if clumps A and B lie at the far kinematical distance, the foreground molecular clouds absorb the 21 cm continuum radiation embedded within the clumps at velocities up to the velocity of the tangent point, the maximum velocity that can have the foreground clouds. Therefore, the HI 21 cm spectrum toward the clumps will exhibit absorption lines corresponding to a 13CO emission line from the foreground molecular clouds up to the velocity of the tangent point. Figure 5 displays the HI 21 cm and 13CO spectra in the direction of clumps A and B. For both clumps, the HI 21 cm spectrum shows absorption lines that correspond to molecular emission lines up to the central velocities derived for each clump. Therefore, we can assign the near kinematical distance (4.21.2 kpc) to both clumps. The weak absorption features at 140 km s-1 (clump A) and at 125 km s-1 (clump B) are of very low significance since they have the same magnitude as does the uncertainty that we adopted in the HI absorption spectra (2.8 K). We thus provided a reliable estimate for the first time for the distance to the SNR and proved that the molecular clouds are located at the same distance.

3.2 The SNR G15.4+0.1/HESS 1818154 system
G15.4+0.1 is among the faintest SNRs detected yet at TeV energies. Up to the present, it has been suggested that the discovered -ray emission originates in a PWN of a still undetected rotating neutron star (Hofverberg et al. 2011). In this section we attempt to use the 13CO data to infer the physical properties of the molecular material that we suggest is interacting with SNR G15.4+0.1. We adopt a distance of 4.2 kpc to estimate the total mass for the molecular clump and its density. All the subsequent quantities are scaled in terms of d4.2=d/4.2 kpc.
For clump A we consider the 13CO intensity from a circular region of about 0∘.06 in diameter. We use the 13CO distribution to calculate the H2 column density by adopting the molecular mass calibration ratio N(H2)/N(13CO)=5.62 105 (Simon et al. 2001), where N(13CO) is obtained from the following relation (Wilson et al. 2009)
| (1) |
where Tex represents the excitation temperature of the 13CO (J=10) transition, which is assumed to be 10 K, and 13 is the optical depth of the line. For an optically thin line, the integral in Eq. 1 can be expressed as , with =, TB the brightness temperature of the line, and Tb fixed at the typical value of 2.7 K.
By using the estimation made for N(H2) we obtain the mass for the central cloud through the relation,
| (2) |
where is the mean molecular weight equal to 2.8 if a relative helium abundance of 25% is assumed, mH represents the hydrogen mass, is the distance to the cloud, and is the solid angle subtended by the 13CO cloud. We thus derive a total mass for the molecular clump A of (1.20.5 103 d4.22 M⊙. The corresponding density (for neutral hydrogen) is (1.50.4 103 d4.2-1 cm-3.
The volume density of the molecular gas can also be inferred by using an alternative method based on estimating the dust content. Particularly, this clump matches the Bolocam111The Version 2.0 of the Bolocam GPS catalog is available at http://milkyway.colorado.edu/bgps/ millimeter continuum source BGPS~G015.433+00 about 0.035∘ in diameter. Following Rosolowsky et al. (2010), we analyze the properties of this source and estimate its mass from the flux density of the continuum emission at 1.1 mm (=271.1 GHz, =2.5140.315 Jy). We obtain a density of (0.990.12) 103 d4.2-1 cm-3 for clump A, which agrees well with our estimate from 13CO data. Similarly, the total mass of the northern clump B is estimated in (3.00.7)103 d4.22 M⊙ from an elliptical area of axis 0∘.03 and 0.∘05, and the density is (1.1 0.3) 103 d4.2-1 cm-3.
In what follows we analyze whether the -ray emission is related to the interaction of the SN shocks with the molecular gas, particularly with clump A based on the good positional match. It is possible that the emission of HESS J1818154 is produced through the decay of 0 mesons created in the interaction between accelerated protons/nuclei and dense ambient gas. The required energy injected into accelerated hadrons to obtain the observed -ray flux can be estimated from the equation (Aharonian et al. 2007), where 4.5 1015 s = 4.5 1012 s is the characteristic cooling time of protons through the 0 production channel that corresponds to a mean proton density 1000 cm-3, and = 3.21033 erg s-1 is the luminosity of the HESS source, where is the -ray energy flux between 1 and 10 TeV, and kpc is the adopted distance to the source. Assuming that the power law energy spectrum, with index =-2.1, extends up to energies of GeV (Aharonian et al. 2005), we find that the total energy of cosmic rays required to generate the observed -ray flux is erg. Thus for G15.4+0.1, the conversion of a few percent of the explosion energy to the acceleration of protons up to 100 TeV would be enough to explain the observed -ray flux in HESS J1818154 by nucleonic interactions in a medium with the calculated density.
4 Conclusions
Based on absorption techniques we have estimated the kinematical distance to G15.4+0.1 in 4.8 kpc. This is significantly closer than the 10 kpc proposed by Hofverberg et al. (2011) on the basis of the - relation. Additionally, we explored the radio emission and the ISM toward the SNR G15.4+0.1 and proved for the first time that there is a roughly elliptical molecular cloud, about 5′ in size, which consists of two bright clumps: clump A matching the location of the -ray emission from HESS J1818154 and clump B in coincidence with the northern border of the radio shell of the remnant, with masses of 1.2 103 M⊙ and 3 103 M⊙, and densities of 1.5103 and 1.1103 cm-3, respectively. We demonstrated that the kinematical distances derived for the SNR G15.4+0.1 and to the molecular complex agree within errors and that the molecular cloud shows evidence of disruption by a strong shock.
Further energetic arguments confirm that a hadronic scenario is the most likely one to explain the observed -ray emission. The detection of -radiation in the MeV-GeV energy range would be a signature for pion-generated gammas, providing beyond doubt the hadronic origin, while on the other hand, the discovery of a pulsar associated with G15.4+0.1, would favor a possible leptonic contribution. New searches for a pulsating source are being conducted with the GMRT.
Acknowledgements.
This publication makes use of molecular line data from the Boston University-FCRAO Galactic Ring Survey (GRS). This research was partially funded by Argentina Grants awarded by ANPCYT: PICT 0902/07, 0795/08 and 0571/11 and CONICET PIP: 2166/08, 0736/12. G. C. and G. D. are Members of the Carrera of Investigador Científico of CONICET, Argentina. L. S. is a PhD Fellow of CONICET, Argentina. We thank the staff of the GMRT who have made these observations possible. GMRT is run by the National Centre for Radio Astrophysics of the Tata Institute of Fundamental Research, India.References
- Aharonian et al. (2005) Aharonian, F., Akhperjanian, A. G., Bazer-Bachi, A. R., et al. 2005, A&A, 437, L7
- Aharonian et al. (2007) Aharonian, F., Akhperjanian, A. G., Bazer-Bachi, A. R., et al. 2007, ApJ, 661, 236
- Brogan et al. (2006) Brogan, C. L., Gelfand, J. D., Gaensler, B. M., Kassim, N. E., & Lazio, T. J. W. 2006, ApJ, 639, L25
- Dubner et al. (2004) Dubner, G., Giacani, E., Reynoso, E., & Parón, S. 2004, A&A, 426, 201
- Fich et al. (1989) Fich, M., Blitz, L., & Stark, A. A. 1989, ApJ, 342, 272
- Hofverberg et al. (2011) Hofverberg, P., Chaves, R. C. G., Méhault, J., & de Naurois, M. 2011, in International Cosmic Ray Conference, Vol. 7, International Cosmic Ray Conference, 247
- Jackson et al. (2006) Jackson, J. M., Rathborne, J. M., Shah, R. Y., et al. 2006, ApJS, 163, 145
- McClure-Griffiths et al. (2005) McClure-Griffiths, N. M., Dickey, J. M., Gaensler, B. M., et al. 2005, ApJS, 158, 178
- Petriella et al. (2013) Petriella, A., Paron, S. A., & Giacani, E. B. 2013, A&A, 554, A73
- Roman-Duval et al. (2009) Roman-Duval, J., Jackson, J. M., Heyer, M., et al. 2009, ApJ, 699, 1153
- Rosolowsky et al. (2010) Rosolowsky, E., Dunham, M. K., Ginsburg, A., et al. 2010, ApJS, 188, 123
- Simon et al. (2001) Simon, R., Jackson, J. M., Clemens, D. P., Bania, T. M., & Heyer, M. H. 2001, ApJ, 551, 747
- Wilson et al. (2009) Wilson, T. L., Rohlfs, K., & Hüttemeister, S. 2009, Tools of Radio Astronomy (Springer-Verlag)
- Zhou et al. (2009) Zhou, X., Chen, Y., Su, Y., & Yang, J. 2009, ApJ, 691, 516