A search for enhanced very-high-energy gamma-ray emission from the March 2013 Crab Nebula flare
Abstract
In March 2013, a flaring episode from the Crab Nebula lasting weeks was detected by the Fermi-LAT (Large Area Telescope on board the Fermi Gamma-ray Space Telescope). VERITAS provides simultaneous observations throughout this period. During the flare, the Fermi-LAT detected a 20-fold increase in flux above the average synchrotron flux MeV seen from the Crab Nebula. Simultaneous measurements with VERITAS are consistent with the non-variable long-term average Crab Nebula flux at TeV energies. Assuming a linear correlation between the very-high-energy flux change TeV and the flux change seen in the Fermi-LAT band MeV during the period of simultaneous observations, the linear correlation factor can be constrained to be at most with 95% confidence.
1 Introduction
The Crab Nebula is one of the best-studied cosmic particle accelerators. Its distance of kpc and absolute luminosity of erg s-1 allow the study of the nebula in great detail across the entire electromagnetic spectrum. From radio to GeV energies, the emission is consistent with synchrotron emission of relativistic electrons (Hester, 2008). However, at higher energies, the dominant emission mechanism is thought to be inverse-Compton upscattering of low-energy photons by the same population of electrons (Gould, 1965; Weekes et al., 1989; de Jager & Harding, 1992; Aharonian et al., 2004).
The energy source powering the nebula is believed to be the Crab pulsar located at its center (Staelin & Reifenstein, 1968). With the pulsar as the central engine, a self-consistent magnetohydrodynamic model can be developed that explains the main features of the nebula (Rees & Gunn, 1974; Kennel & Coroniti, 1984). The discovery of flaring episodes by the AGILE (Tavani et al., 2011) and Fermi-LAT (Abdo et al., 2011) teams was unexpected in this framework. The Crab Nebula flux was seen to increase by more than a factor of ten in less than a day between 100 MeV and 1 GeV in the most extreme of these flares.
Determining the cause of these flares is a major experimental and theoretical challenge. The observed flaring timescales of 12 hours (Balbo et al., 2011) and 8 hours (Buehler et al., 2012) imply that the emission region is less than pc in diameter. This size constraint coupled with the observation that the emitted isotropic power peaks at about 1% of the pulsar spin-down power argues in favor of an emission region that moves mildly relativistically (Buehler et al., 2012; Clausen-Brown & Lyutikov, 2012; Lyutikov et al., 2012; Bednarek & Idec, 2011). As no enhancement of the pulsed emission has been observed during flares, it has been concluded that the emission region likely resides outside the corotating magnetosphere (Buehler et al., 2012; Balbo et al., 2011).
The investigation of the origin of the flares is complicated because no correlated enhancements have been observed at other wavelengths to date (Balbo et al., 2011; Striani et al., 2011, 2013; Buehler et al., 2012). Multiwavelength campaigns have been executed every time a flare has been observed since the detection of the September 2010 flare (Tavani et al., 2011). Extensive simultaneous coverage over the entire synchrotron emission from radio to X-rays did not reveal correlated activity (Horns et al., 2010; Weisskopf, 2012) that could have shed light on the location of the flares due to better angular resolution at these energies.
The non-detection of correlated activity favors a monoenergetic population of relativistic electrons as the origin of the observed flares. While multiwavelength coverage has been excellent in radio, optical, and X-rays, it has been rather sparse at energies above 100 GeV, i.e., in the inverse-Compton component. No enhancement of the TeV emission was reported by MAGIC or VERITAS during the September 2010 flare (Mariotti, 2010; Ong, 2010). The ARGO-YBJ Collaboration have reported enhanced signals with a median energy of 1 TeV from the direction of the Crab Nebula contemporaneous to GeV-band flares, although these enhancements did not reach the level (Aielli et al., 2010; Bartoli et al., 2012; Vernetto, 2013).
The electrons responsible for the flares should also upscatter soft photons in the nebula to produce TeV photons, which enables constraining the dynamics of the electrons. In this paper we present the most sensitive observations at TeV energies performed during a flare of the Crab Nebula to date. These observations with VERITAS are discussed in the context of observations with the Fermi-LAT.
2 Observations and analysis
2.1 VERITAS
The Very Energetic Radiation Imaging Telescope Array System (VERITAS) is an array of four 12 m diameter imaging atmospheric Cherenkov telescopes (IACTs) located at the base of Mt. Hopkins in southern Arizona, USA that observes very-high-energy (VHE; GeV) gamma rays. Each telescope in the array has a reflector that is composed of 345 hexagonal mirror facets that focus light onto a 499-pixel photomultiplier tube (PMT) camera at the focal plane with a field of view (FoV) of . The array operates in the energy range TeV with an energy resolution of at energies above 1 TeV and an angular resolution of (Holder et al., 2008).
VERITAS observations of the Crab Nebula in its flaring state were triggered by an automated Fermi-LAT analysis pipeline at Barnard College-Columbia University (Errando et al., 2011) on 2013 March 02, two days prior to the ATel from the Fermi-LAT collaboration announcing the gamma-ray flare (Ojha et al., 2013). The VERITAS data during the flare are composed of ten nights of observations in the period MJD 56353 to 56366 (2013 March 02 to 2013 March 15, henceforth referred to as the flare time window, FTW). Observations of the Crab Nebula as part of the standard observing schedule from 2012 October 13 to 2013 April 02 excluding the FTW comprise a data set on the source in its non-flaring state, which is used as a baseline with which to compare the flare data.
All VERITAS Crab observations were taken in wobble mode with an offset of from the source position alternately in each of the four cardinal directions, so that the background can be estimated from simultaneously gathered data, and systematic effects in the background estimation cancel out (Aharonian et al., 2001; Berge et al., 2007). Observations were conducted using the full four-telescope array in a range of zenith angles , giving a total of 10.3 hours of live time on the source during the FTW and 17.4 hours during the rest of the season. Two nights of flare observations (MJD 56353 and 56358) were conducted at large zenith angles, which has the effect of increasing the effective energy threshold of the array. Due to this dependence of the energy threshold, the low-energy threshold for the spectral analysis is set to a common value of 1 TeV.
The recorded images are first flat-fielded using information from nightly calibration runs taken with a pulsed UV LED (Hanna et al., 2010). The images are cleaned using a form of the picture/boundary method (Daniel, 2008) and parameterized (Hillas, 1985) to suppress the cosmic ray background. The shower direction is reconstructed from the data in each telescope, and a set of selection criteria is applied to reject background events (Konopelko, 2001; Daniel, 2008).
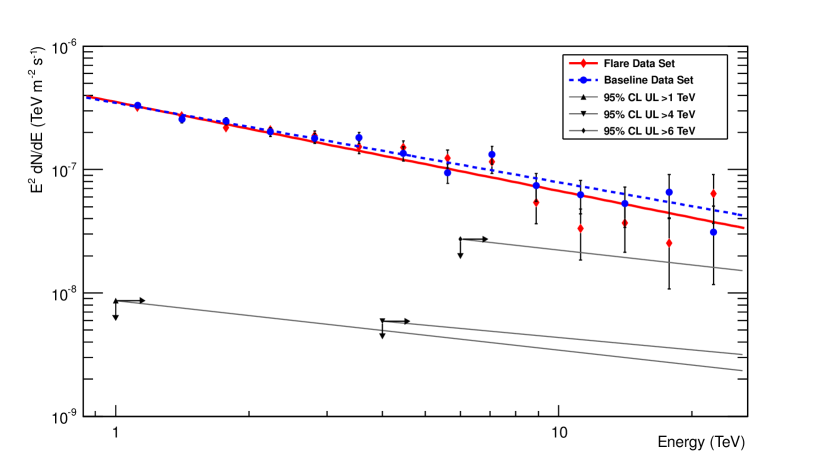
Energy spectra are calculated TeV both for the FTW and the baseline observations and are shown in Figure 1. The spectra are parameterized as power laws of the form
| (1) |
The baseline spectral fit gives a normalization of and , with a value of 16.6 with 12 degrees of freedom (dof). The FTW spectral fit gives a normalization of and a spectral index , with a value of 10.1 with 12 dof. The fit probabilities are 16% and 61%, respectively. These spectral parameters are mutually consistent, implying no change of the TeV flux during the FTW. The systematic uncertainties on the flux normalization and spectral index are expected to vary slowly with time, and a paper containing a proper treatment of these uncertainties is currently in preparation.
2.2 Fermi-LAT
The Fermi-LAT is a pair-conversion telescope sensitive to gamma-ray photons with energies between 20 MeV and 300 GeV. It has a wide FoV of sr and surveys the entire sky every three hours. For a complete description of the instrument, see Atwood et al. (2009); Ackermann et al. (2012).
In order to extract spectral parameters of the Crab, the Fermi-LAT Science Tools v9r27p1 with P7V6 instrument response functions (IRFs) and the standard quality cuts described in Nolan et al. (2012) are used. Two years of “source”-class events with energies between 100 MeV and 300 GeV collected between MJD 54832 and 55562 within of the Crab are processed with the maximum likelihood fitting routine. A model of the background is obtained in a binned likelihood analysis by fitting spectral models for all sources in the 2FGL catalog within of the Crab in addition to the galactic and isotropic diffuse backgrounds (gal_2yearp7v6_v0.fits, iso_p7v6source.txt). Photon arrival times are barycentered with Tempo2 (Hobbs et al., 2006) using a publicly-available Jodrell Bank radio ephemeris for the Crab pulsar (Lyne et al., 1993) to allow a selection of the off-pulse phase region . Under the assumption that emission from the pulsar is negligible in the off-pulse region, spectral parameters for the synchrotron and inverse-Compton components of the Crab Nebula are calculated. These parameters are fixed in the model to allow fitting of the pulsar spectral component after undoing the selection on pulsar phase.
The Crab Nebula synchrotron differential spectrum is parameterized as a power law (PowerLaw2 in the Fermi-LAT Science Tools) of the form
| (2) |
The fit of the quiescent state yields a synchrotron integral flux above 100 MeV of and photon index of , which are consistent with previously published results (e.g., Buehler et al., 2012).
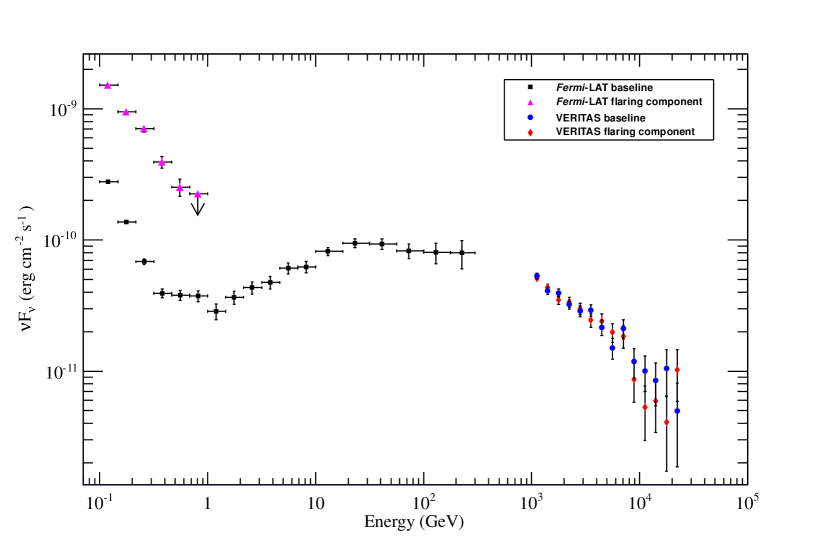
A similar analysis is done for the FTW. Since the Fermi-LAT carried out a targeted observation of the Crab during the flare, the recommended P7V6MC IRFs and pointed mode data selection criteria are used in this analysis111http://fermi.gsfc.nasa.gov/ssc/data/analysis/documentation/Cicerone/Cicerone_Likelihood/Exposure.html. The synchrotron integral flux above 100 MeV for the FTW is found to be with a harder photon index of . A combined spectral energy distribution (SED) showing the Fermi-LAT and VERITAS spectra is given in Figure 2.
3 Results
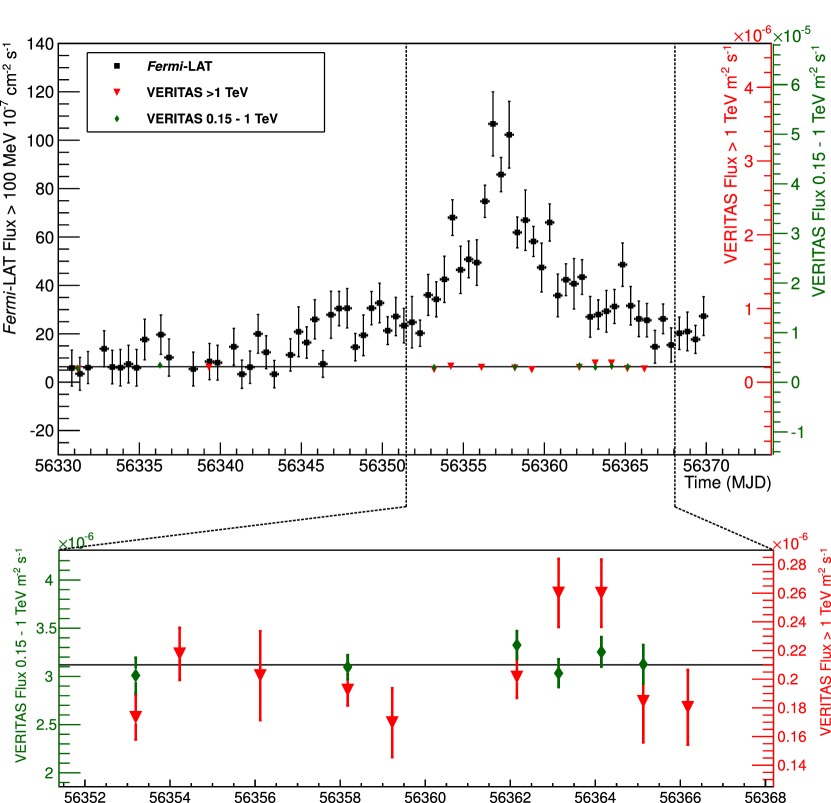
A test for variability in the VERITAS FTW light curve (shown in Figure 3) is performed by fitting the light curve with a constant flux. This fit gives a flux TeV of with a value of 19.1 with 9 dof (probability ). By fitting a light curve of data taken outside of the FTW, the Crab Nebula is detected with a baseline VHE flux TeV of with a value of 21.7 with 22 dof (probability %). The FTW flux is thus consistent with the baseline flux and with no statistically significant variability during the flare. An analysis of a subset of the data with energies extending down to GeV was also conducted (shown in Figure 3), however no variability is revealed at these energies.
In order to test for correlated Fermi-LAT and VERITAS ( TeV) flux variability in the light curves shown in Figure 3, a publicly available implementation of the -transformed discrete correlation function (ZDCF) is employed (Alexander, 1997, 2013). The ZDCF method requires a minimum of 12 observations in each light curve for a statistically valid analysis, so two nights of pre-flare VERITAS Crab Nebula observations taken on MJD 56331 and 56339 (February 8 and 16, respectively) are added before the cross-correlation is performed. The zero time-lag bin reported a ZDCF correlation coefficient of
| (3) |
which is consistent with no correlation at zero lag. Results for all other time-lag bins are also consistent with no statistically significant correlation.
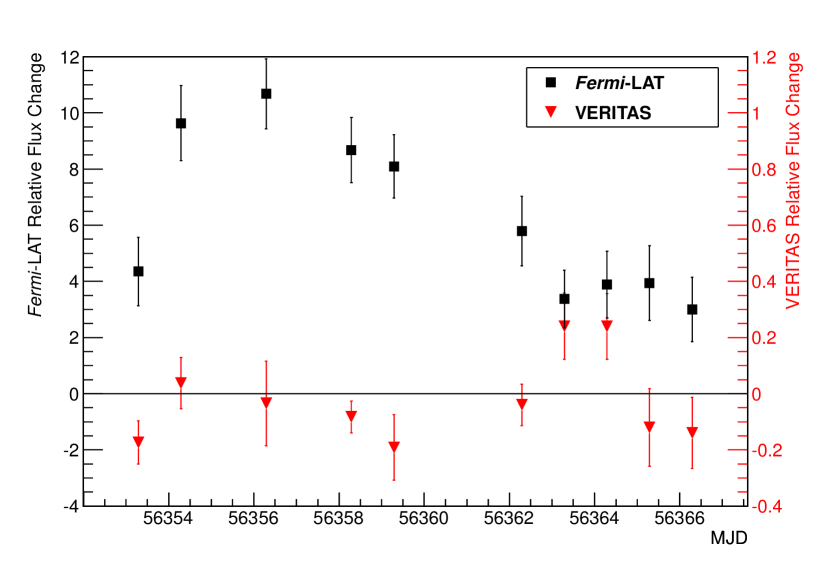
Relative flux changes during the FTW are calculated for VERITAS and Fermi-LAT. The relative flux change for both VERITAS and Fermi-LAT observations on the night is computed as
| (4) |
For VERITAS, is the average flux for one night. For Fermi-LAT, is the average flux in one 12-hour time bin centered on midnight Arizona time (MST, 0700 UTC). is the average non-flare flux from the nebula. The VERITAS and Fermi-LAT relative flux changes for simultaneous observations are shown in Figure 4. Averaged over the simultaneous observations in the FTW, the relative flux changes are
| (5) | ||||
| (6) |
From , a 95% confidence level upper limit (UL) is computed for an elevated VHE flux. Given the assumption of a positive and non-zero correlation of Fermi-LAT and VERITAS flux changes, a Bayesian prior is introduced in the limit calculation that is zero for negative relative flux changes and one elsewhere. This prior is equivalent to invoking the physical constraint that all of the VHE flux changes are at least zero. The upper limit is calculated over the Bayesian interval such that
| (7) |
where is the error on , and the CL upper limit is given by , which is obtained by solving the equation numerically. Limits are calculated for three different energy thresholds shown in Table 1.
| Energy band (TeV) | CL UL | CL integral UL at threshold (TeV m-2 s-1) |
By adopting the assumption that the relative flux change seen by VERITAS is linearly related to that seen by the Fermi-LAT during the flare:
| (8) |
a constraint on the linear correlation factor can be calculated, which can be used to test model predictions. Taking the ratio of the TeV upper limit and the average Fermi-LAT relative flux change, we find that for the average of the ten nights of simultaneous observations. The constraint on is also computed night-by-night, though only MJD 56358 gives the slightly better constraint of .
4 Discussion
In this paper we present observations of the Crab Nebula with VERITAS and the Fermi-LAT during the March 2013 flare. The light curve and reconstructed energy spectrum between 1 TeV and 10 TeV do not indicate any flux enhancement at TeV energies, while the flux above 100 MeV was six times elevated during our observations.
Earlier flares had very hard spectra with peak energy reaching up to MeV (Buehler et al., 2012), though in the present flare, a peak could not be resolved in the MeV – GeV spectrum leaving the electron spectrum unconstrained at lower energies. The synchrotron spectrum above 100 MeV is slightly harder than for the quiescent Crab, which may reflect a separate electron population and/or an increase in the magnetic-field strength in the emission zone that shifts a harder section of a curved synchrotron spectrum into the frequency band accessible with the Fermi-LAT. Neglecting the weak modifications arising from the possibility of mildly relativistic bulk motion, we suggest that some excess electron acceleration took place.
From classical electrodynamics, the Lorentz factor of electrons that would emit 200 MeV synchrotron radiation is
| (9) |
and their energy-loss rate and life time are
| (10) |
Assuming a magnetic field of 1 mG in the emission region, similar to that deduced in Bednarek & Idec (2011), the flare duration is on the order of a few days, which is consistent with observed flares at a few hundred MeV. If the magnetic field were significantly stronger than 1 mG, the synchrotron lifetime would become very short compared to the flare duration, and so the electron population would need to be continuously replenished to sustain the flare. Thus, the main cause of the synchrotron flare was likely the injection of a large number of excess electrons at PeV energies.
Bednarek & Idec (2011) consider a model in which electrons are injected into the magnetic field of the pulsar wind zone and produce synchrotron gamma rays through acceleration in reconnection regions of the magnetic field. Assuming the electrons reach an equilibrium spectrum described by a differential power law with index between and with a characteristic cut-off at for flares, they suggest variability above TeV of roughly with more substantial changes above TeV as a result of inverse-Compton scattering. However, inverse-Compton scattering of soft photons by electrons with Lorentz factors is heavily Klein-Nishina suppressed and would provide gamma rays in the PeV band, beyond the reach of VERITAS. Excess electrons with Lorentz factors of may produce a flux enhancement at TeV energies, but the non-detection with VERITAS poses challenges for this model and thus constrains the number of electrons with Lorentz factors of .
The number of electrons with Lorentz factors of can be estimated as
| (11) |
where is the synchrotron luminosity at 200 MeV. To calculate the number of electrons that may inverse-Compton scatter soft (infrared, IR) photons into the TeV band, we need to know the density of low-frequency radiation in the nebula. To this end we use erg s-1 (Marsden et al., 1984) as the pulsar wind nebula (PWN) luminosity in IR photons, eV as the photon energy, and pc as the characteristic size of the Crab Nebula. The density of IR photons is then
| (12) |
Using the upper limit on an extra flux component TeV given in Table 1, we find that the inverse-Compton luminosity . The number of electrons that upscatter photons to TeV energies is given by
| (13) |
where is the Thomson cross-section. Ignoring the moderate Klein-Nishina suppression (the kinematic parameter ), the upper limit derived on excess TeV gamma rays corresponds to at most
| (14) |
Assuming for ease of exposition that the spectrum of excess electrons follows a power law, , the corresponding constraint on the spectral index is
| (15) |
which permits for the fiducial magnetic-field strength of 1 mG. This index is harder than that assumed by Bednarek & Idec (2011) and constrains the number of electrons that may be responsible for the Crab flare. Future observations with VERITAS or next-generation telescope arrays will likely provide more stringent constraints.
References
- Abdo et al. (2011) Abdo, A. A., Ackermann, M., Ajello, M., et al. 2011, Science, 331, 739
- Ackermann et al. (2012) Ackermann, M., Ajello, M., Albert, A., et al. 2012, ApJS, 203, 4
- Aharonian et al. (2001) Aharonian, F., Akhperjanian, A., Barrio, J., et al. 2001, A&A, 370, 112
- Aharonian et al. (2004) Aharonian, F., Akhperjanian, A., Beilicke, M., et al. 2004, ApJ, 614, 897
- Aielli et al. (2010) Aielli, G., Camarri, P., Iuppa, R., et al. 2010, The Astronomer’s Telegram, 2921, 1
- Alexander (1997) Alexander, T. 1997, in Astrophysics and Space Science Library, Vol. 218, Astronomical Time Series, ed. D. Maoz, A. Sternberg, & E. M. Leibowitz, 163
- Alexander (2013) Alexander, T. 2013, arXiv:1302.1508
- Atwood et al. (2009) Atwood, W. B., Abdo, A. A., Ackermann, M., et al. 2009, ApJ, 697, 1071
- Balbo et al. (2011) Balbo, M., Walter, R., Ferrigno, C., & Bordas, P. 2011, A&A, 527, L4
- Bartoli et al. (2012) Bartoli, B., Bernardini, P., Bi, X. J., et al. 2012, The Astronomer’s Telegram, 4258, 1
- Bednarek & Idec (2011) Bednarek, W., & Idec, W. 2011, MNRAS, 414, 2229
- Berge et al. (2007) Berge, D., Funk, S., & Hinton, J. 2007, A&A, 466, 1219
- Buehler et al. (2012) Buehler, R., Scargle, J. D., Blandford, R. D., et al. 2012, ApJ, 749, 26
- Clausen-Brown & Lyutikov (2012) Clausen-Brown, E., & Lyutikov, M. 2012, MNRAS, 426, 1374
- Daniel (2008) Daniel, M. K. 2008, in Proceedings of the 30th International Cosmic Ray Conference, Vol. 3, ed. R. Caballero, J. D’Olivo, & G. Medina-Tanco (Mexico City, Mexico: Universidad Nacional Autónoma de México), 1325–1328
- de Jager & Harding (1992) de Jager, O. C., & Harding, A. K. 1992, ApJ, 396, 161
- de Jager et al. (1996) de Jager, O. C., Harding, A. K., Michelson, P. F., et al. 1996, ApJ, 457, 253
- Edelson & Krolik (1988) Edelson, R. A., & Krolik, J. H. 1988, ApJ, 333, 646
- Errando et al. (2011) Errando, M., Orr, M., & Kara, E. 2011, in Proceedings of the 32nd International Cosmic Ray Conference, Vol. 8, (Beijing, China), 135
- Gould (1965) Gould, R. J. 1965, Physical Review Letters, 15, 577
- Hanna et al. (2010) Hanna, D., McCann, A., McCutcheon, M., & Nikkinen, L. 2010, NIMPA, 612, 278
- Hester (2008) Hester, J. J. 2008, ARA&A, 46, 127
- Hillas (1985) Hillas, A. M. 1985, in Proceedings of the 19th International Cosmic Ray Conference, Vol. 3, ed. F. C. Jones, J. Adams & M. Mason, (La Jolla, USA: NASA Conf. Publ.), 445–448
- Hobbs et al. (2006) Hobbs, G. B., Edwards, R. T., & Manchester, R. N. 2006, MNRAS, 369, 655
- Holder et al. (2008) Holder, J., Acciari, V. A., Aliu, E., et al. 2008, AIP Conference Proceedings, 1085, 657
- Horns et al. (2010) Horns, D., Tennant, A., Ferrigno, C., et al. 2010, The Astronomer’s Telegram, 3058, 1
- Kennel & Coroniti (1984) Kennel, C. F., & Coroniti, F. V. 1984, ApJ, 283, 710
- Konopelko (2001) Konopelko, A. K. 2001, in HIGH ENERGY GAMMA-RAY ASTRONOMY: International Symposium, Vol. 558, ed. F. A. Aharonian & H. J. Völk, (Heidelberg, Germany: AIP Conference Proceedings), 569–573
- Lyne et al. (1993) Lyne, A. G., Pritchard, R. S., & Graham-Smith, F. 1993, MNRAS, 265, 1003
- Lyutikov et al. (2012) Lyutikov, M., Balsara, D., & Matthews, C. 2012, MNRAS, 422, 3118
- Mariotti (2010) Mariotti, M. 2010, The Astronomer’s Telegram, 2967, 1
- Marsden et al. (1984) Marsden, P. L., Gillett, F. C., Jennings, R. E., et al. 1984, ApJ, 278, L29
- Nolan et al. (2012) Nolan, P. L., Abdo, A. A., Ackermann, M., et al. 2012, ApJS, 199, 31
- Ojha et al. (2013) Ojha, R., Hays, E., Buehler, R., & Dutka, M. 2013, The Astronomer’s Telegram, 4855, 1
- Ong (2010) Ong, R. A. 2010, The Astronomer’s Telegram, 2968, 1
- Rees & Gunn (1974) Rees, M. J., & Gunn, J. E. 1974, MNRAS, 167, 1
- Staelin & Reifenstein (1968) Staelin, D. H., & Reifenstein, III, E. C. 1968, Science, 162, 1481
- Striani et al. (2011) Striani, E., Tavani, M., Piano, G., et al. 2011, ApJ, 741, L5
- Striani et al. (2013) Striani, E., Tavani, M., Vittorini, V., et al. 2013, ApJ, 765, 52
- Tavani et al. (2011) Tavani, M., Bulgarelli, A., Vittorini, V., et al. 2011, Science, 331, 736
- Vernetto (2013) Vernetto, S., for the ARGO-YBJ Collaboration 2013, arXiv:1307.7041
- Weekes et al. (1989) Weekes, T. C., Cawley, M. F., Fegan, D. J., et al. 1989, ApJ, 342, 379
- Weisskopf (2012) Weisskopf, M. C. 2012, arXiv:1211.7109