Optical and magnetic excitations of metal-encapsulating Si cages: A systematic study by time-dependent density functional theory
Abstract
Systematic study of the optical and magnetic excitations of twelve MSi12 and four MSi10 transition metal encapsulating Si cages has been carried out by employing real time time-dependent density functional theory. Criteria for the choice of transition metals (M) are clusters’ stability, synthesizability, and diversity. It was found that both the optical absorption and the spin-susceptibility spectra are mainly determined by, in decreasing order of importance: 1) the cage shape, 2) the group in the Periodic Table M belongs to, and 3) the period of M in the Periodic Table. Cages with similar structures and metal species that are close to each other in the Periodic Table possess spectra sharing many similarities, e. g., the optical absorption spectra of the MSi12 (M = V, Nb, Ta, Cr, Mo, and W), which are highly symmetric and belong to groups 4 and 5 of the Periodic Table, all share a very distinctive peak at around 4 eV. In all cases, although some of the observed transitions are located at the Si skeleton of the cages, the transition metal specie is always significant for the optical absorption and the spin-susceptibility spectra. Our results provide finger-print data for identification of gas-phase MSi12 and MSi10 by optical absorption spectroscopy.
I Introduction
After mixed silicon-transition metal clusters (MSin) were obtained and studied by Beck Beck (1987) in the late eighties, the first theoretical calculations indicated the stability of species containing one transition metal atom such as ZrSi20, Jackson and Nellermoe (1996) MSi15 (M = Cr, Mo, W), Han and Shi (2001) and MSi16 (M = Ti, Hf, Zr). Kumar and Kawazoe (2001) In 2001, a major breakthrough in the field of silicon-transition metal clusters was achieved by Hiura et al. Hiura et al. (2001) They successfully synthesized MSi species by employing gas phase reactions of single transition metal atoms with silane (SiH4). Abundance of clusters with 12 silicon atoms (MSi12) for the cases of M = Ta, W, Re, and Ir was measured by mass-spectrometry. Initial computer simulations conducted by the same research team suggested for MSi12 the shape of a regular hexagonal prism. Hiura et al. (2001); Miyazaki et al. (2002) Subsequent theoretical studies by others confirmed similar cage-like geometries for neutral species such as CrSi12, Khanna et al. (2002) as well as for CuSi12, MoSi12, and WSi12. Hagelberg et al. (2003)
In a series of two works, in an attempt to systematize the behavior of a wide variety of neutral MSin clusters, we studied these species Gueorguiev and Pacheco (2003a); Gueorguiev et al. (2006a) by means of first-principles calculations within the framework of density functional theory (DFT). A total of 336 different MSin clusters, for 24 transition elements grouped into the following subgroups: M = [Cr, Mo, W], [Mn, Tc, Re], [Fe, Ru, Os], [Co, Rh, Ir], [Ti, Zr, Hf], [V, Nb, Ta], [Ni, Pd, Pt], and [Cu, Ag, Au], were addressed. The geometries of most MSi12 and of some MSi10 are not only symmetric, but - apart from minor distortions - independent on the transition metal involved. Importantly, the electronic properties of structurally nearly equivalent clusters depend sensitively on M, thus providing diversity of building blocks for synthesizing cluster-assembled materials and for designing nano-devices. In order to investigate cluster-assembled materials, i.e., solids in which the MSi12 clusters play the role of building blocks, we also conducted Langevin molecular dynamics simulations to investigate the possibility of forming NbSi12 and WSi12 solid phases. Pacheco et al. (2002) In an important contribution to this emerging field, Uchida et al. synthesized hydrogenated TaSi10-13 clusters, successfully deposited them onto a Si(111)-(7 x 7) surface, Uchida et al. (2003) and by taking scanning tunneling microscope (STM) observations demonstrated that these units do not decompose after their deposition on the Si surface. The preserved integrity of such cage-like molecules deposited on a surface gives credibility to this first attempt for MSi12 manipulation and assembly into thin films and low-dimensional structures. More recently, we have also predicted nano-wires with metallic properties assembled from MSi12 species and found most stable those containing light transition metal atoms such as Ni, Co, Ti, and V. Gueorguiev et al. (2008) The feasibility of MSi12-based nanowires has been successfully explored also by others for M = Ni, Fe, Menon et al. (2002); Nayak et al. (2006) and even in the case of M = Be. Singh et al. (2002) Cluster-assembled materials are expected to exhibit distinct properties from the pure substances, compounds, and alloys of the chemical elements they contain. Jena et al. (1996) In addition, silicon is the chemical element most worked out in current microelectronics. Logically, the endohedral silicon-metal clusters and the corresponding cluster-assembled materials based on them are expected to exhibit distinct electronic but also optical properties from those of existing Si-based materials. Therefore, the MSin-based materials are seen as prospective compounds for achieving integrated nano-opto-electro-mechanical devices. Cui and Lieber (2001); Kumar (2006)
While structural and ground-state properties of MSin clusters and corresponding extended phases have already attracted significant research effort, Hiura et al. (2001); Miyazaki et al. (2002); Khanna et al. (2002); Hagelberg et al. (2003); Gueorguiev and Pacheco (2003a); Gueorguiev et al. (2006a); Pacheco et al. (2002); Uchida et al. (2003); Gueorguiev et al. (2008); Menon et al. (2002); Nayak et al. (2006); Singh et al. (2002) the excited state properties of MSin units, let alone those of possible extended phases made upon them, are just starting to be investigated. A very appropriate tool for approaching the excited state properties of this type of clusters is the time-dependent density functional theory (TDDFT). Runge and Gross (1984); Marques et al. (2012) Indeed, TDDFT has previously been used to study the optical properties of a wide variety of clusters, including clusters containing transition-metal species and hydrogenated silicon clusters. Yabana and Bertsch (1999a); Harb et al. (2007); Castro et al. (2008); Stener et al. (2008); Vasiliev et al. (2001); Thingna et al. (2011) Nevertheless, the only previous TDDFT studies of MSin clusters is the recent work of He et al. He et al. (2010), in which the second-order hyper-polarizabilities and the optical absorption spectra in the UV-Visible region of (Sc - Zn)Si12 were addressed using TDDFT at the B3LYP and B3PW91 levels of theory.
In the present work, by applying real-time TDDFT methodology, we report systematic results on the optical absorption spectra and dynamical spin susceptibility of a range of stable MSi12 (M = Ti, V, Cr, Ni, Zr, Nb, Mo, Pd, Hf, Ta, W, Pt), and MSi10 (M = Ni, Cu, Ag, Au) species. The choice of the MSin explored is motivated by their structural stability (at DFT level), synthesizability, and our determination to study a wide diversity of metals (M).
II Methodology and Computational Details
A great deal of information can be obtained about the electronic structure of a given system by studying how it interacts with an electromagnetic field. The mathematical objects that describe how the electrons redistribute in a finite system after being perturbed by an external electromagnetic field are called susceptibilities. A susceptibility thus relates some observable of the system to a perturbing field, and, therefore, it can be characterized by both the type of field and the observable. One well known example of such an object is the polarizability of a finite system. In this case, the perturbing field is an electrical field, the observable is the electrical dipole of the system, and the polarizability is just the ratio of the dipole to the field. If the perturbing field is frequency-dependent, the susceptibilities are referred to as being dynamical. Important physical quantities can be related to the susceptibilities. For example, the optical absorption cross-section is trivially related to the imaginary part of the dynamical polarizability :
| (1) |
where the brackets denote orientational averaging.
One method of choice for calculating dynamical susceptibilities of a wide range of physical systems is the time-dependent density functional theory in its real-time formulation. Employing this method, after applying the perturbation to the system, the time-dependent Kohn-Sham equations are used to propagate the wavefunctions up to some finite time, thus allowing the determination of any observable of the system as a function of time. Although this method was initially applied for calculating the polarizability, Yabana and Bertsch (1996) since the methods used to solve the time-dependent Kohn-Sham equations are independent of the applied perturbation and of the observable, this approach is very simple to generalize to other types of susceptibilities. Serra et al. (1993); Torres and Balbás (2000); Yabana and Bertsch (1999b); Varsano et al. (2009)
In this work, we employ real-time TDDFT as implemented in the octopus code Castro et al. (2006); Andrade et al. (2012) to calculate the optical absorption spectra and the spin susceptibility of MSin clusters. Concerning the optical absorption spectra, a dipolar perturbation:
| (2) |
that acts at and equally excites all the frequencies of the system was applied, and we kept track of the dipole moment of the system as a function of time:
| (3) |
where is the time-dependent electronic density. The components of the polarizability tensor are then simply obtained from the induced dipole :
| (4) |
where all the quantities were now moved to the more convenient frequency domain, and the superscript indicates that we are looking at the density variation after a density perturbation.
Computing now the spin-susceptibility spectra, the applied perturbation was made to be spin-dependent in the following way:
| (5) |
where is the usual Pauli matrix, and we kept track of the spin-dipole moment:
| (6) |
where is the time-dependent magnetization density. In this case, the dynamical spin susceptibility tensor is obtained from the induced spin-dipole :
| (7) |
where the superscript indicates that we are looking at the magnetization density variation after a perturbation of the magnetization density. The dynamical spin susceptibility calculated by following this scheme is just the spin contribution to the magnetizability of the system 111The other contribution comes from the orbital angular momentum of the electrons. which, in turn, contains information about the spin-dependent electronic excitations of the system. Serra et al. (1993); Torres and Balbás (2000)
Before performing the TDDFT calculations, the geometries of the MSin clusters (in their ground state) were optimized at the DFT level of theory by employing a plane-wave basis set for the expansion of the Kohn-Sham orbitals. The calculations were performed by using the VASP code. Kresse and Furthmüller (1996) Projector Augmented-Wave (PAW) potentials Blöchl (1994); Kresse and Joubert (1999) were employed and the Generalized Gradient Approximation (GGA) was adopted. The exchange-correlation functional chosen is the PBE (Perdew, Burke and Ernzerhof). Perdew et al. (1996) A cut-off of 300 eV was used for the kinetic energies of the plane waves included in the basis set, and a Gaussian smearing scheme was employed to set the partial occupancies of electronic states, with a width of 0.05 eV. The level of theory employed in the present work has been demonstrated to be successful for addressing the structural and electronic properties of a wide range of nano-structured systems. Xie et al. (2003a, b); Gueorguiev and Pacheco (2003b); Gueorguiev and Pacheco (2001); Gueorguiev et al. (2006b); Furlan et al. (2008); Rivelino et al. (2010)
The geometries of the MSin cages were fully relaxed until the absolute value of the largest projection component of the Hellmann-Feynman forces acting on the atoms became smaller than 1x10⁻² eV/Å. The convergence of the self-consistent electronic cycles was considered to have been achieved when both the Kohn-Sham eigenvalues and the total energies calculated in two consecutive iterations differed by less than 10-5 eV.
In the case of the TDDFT calculations, the core electrons were treated using norm-conserving pseudopotentials of the Troullier-Martins type. Troullier and Martins (1991) For some of the species (Ti, V, Cr, Nb, and Mo), the generation of accurate pseudopotentials required the inclusion of semi-core states in the valence space. For these cases, the corresponding extension of the Troullier-Martins scheme Reis et al. (2003) as implemented in the Atomic Pseudopotentials Engine (APE) code Oliveira and Nogueira (2008) was used. In octopus, all the relevant functions are discretized in a real-space regular rectangular grid, and we chose the simulation box to be composed of spheres around each atom. Therefore, there are essentially two parameters that control the convergence of the spectra: the grid spacing and the radius of the spheres. We found that a radius of 4.5 Å and spacings of 0.10 Å (M = Ti, V, Cr, Ni, Cu), 0.13 Å (M = Zr, Nb, Mo), and 0.14 Å (M = Pd, Ag, Hf, Ta, W, Pt, Au) were required in order to achieve a convergence of better than 0.1 eV in the spectra. Since some of the cage geometries exhibit several spatial symmetries, it was possible to considerably reduce the total number of calculations needed to obtain the full polarizability tensor. Oliveira et al. (2008) As for the choice of the exchange and correlation functional, it has already been shown that only small differences are found in the excited state properties obtained within the Local Density Approximation (LDA) and the GGA for this kind of systems. Marques et al. (2001) Therefore, all TDDFT calculations were performed using the LDA for the exchange and correlation potential. Perdew and Wang (1992) Nevertheless, for some selected clusters we also performed the same calculations using the PBE functional, but found only very minor differences in the spectra, as expected.
A “hydrogenated empty cage” SinHn can be derived from each of the geometrically optimized MSin clusters (n = 12, 10). These hydrogenated empty cages SinHn were obtained by removal of the centrally located transition metal atom, followed by passivation with H atoms of the dangling bonds of the remaining pure silicon cage. The positions of the H atoms were then relaxed by employing the described above method and convergence criteria. The positions of the silicon atoms were kept fixed, thus preserving the skeleton of the corresponding optimized MSin cages.
III Results and Discussion
The detailed study of the structural properties of these clusters has already been done elsewhere. Gueorguiev and Pacheco (2003a); Gueorguiev et al. (2006a) As such, here we will only briefly present our results for the ground-state geometries of the cages insofar as these can influence the optical properties. Indeed, the presence of the metal atom contributes to the optical properties of the cluster in a direct way, through its own electronic structure and its bonds with the silicon atoms, but also in an indirect way, as it will also influence the geometry of the cluster. Concerning this later contribution, the overall shape of the cluster and its symmetries are usually more important for its optical properties than the actual values of the bond-lengths. In particular, the spectral structure of more symmetrical clusters tends to be simpler than the spectral structure of clusters with less symmetries, as the number of available electronic transitions will be reduced by the degeneracies introduced by the symmetries. On the other hand, changes in bond-lengths that keep the overall shape typically only introduce small shifts of the peaks of the observed spectra, and change their relative intensities.

Therefore, in order to make the relationship between the metal species and the computed excited-state properties more obvious, the obtained geometries for the selected MSi12 clusters were divided into three classes. The first class corresponds to geometries with perfect symmetry and includes the clusters with M = V, Cr, Nb, Mo, Pd, Ta, W, and Pt. The second class of geometries includes the clusters with M = Ti, Zr, and Hf, while the third class includes the cluster with M = Ni. Both the second and third classes correspond to two different distortions of the perfect symmetry. In the case of the selected MSi10 clusters, there is only one class of geometries, which corresponds to a small distortion of the perfect endohedral bicapped tetragonal antiprism (). Representative equilibrium geometries for the three differences classes of MSi12 clusters as well as for the single class of MSi10 clusters are shown in Fig. 1.
III.1 MSi12 clusters
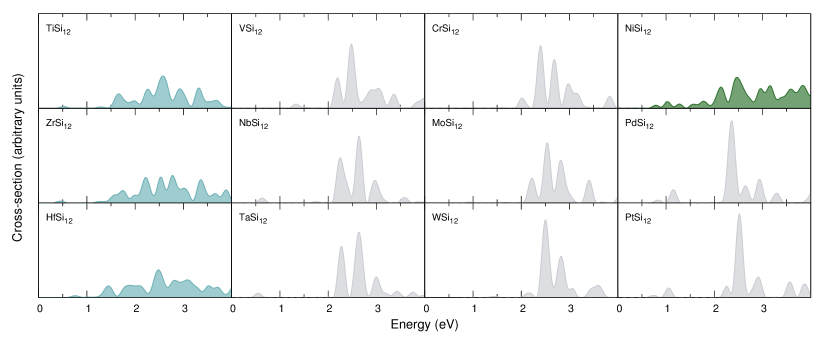
In Fig. 2, we present the calculated optical absorption and spin-susceptibility spectra of the MSi12 clusters studied in this work. In these plots, the spectra are arranged with respect to each other in a similar way as the corresponding metal species are arranged in the Periodic Table. As for the color of the curves, it is used to differentiate the shapes of the cages.
As seen from upper panel of Fig. 2, the optical absorption spectra of cages with perfect symmetry (light gray curves) share significant similarities. Looking in more detail at those spectra, we see that the ones corresponding to cages whose metal species belong to groups 4 and 5 of the Periodic Table (VSi12, NbSi12, TaSi12, CrSi12, MoSi12, and WSi12) all share a very distinctive peak at around 4 eV. A similar peak seems to be present in the absorption spectra of the group 10 cages (PdSi12 and PtSi12), albeit shifted towards lower energy at around 3.5 eV and, in the case of the PtSi12, split in two peaks close in energy. These differences can be explained by the fact that the metal species belonging to groups 4 and 5 (V, Nb, Ta, Cr, Mo, and W) are close to each other in the Periodic Table, while the metal species belonging to group 10 (Pd and Pt) are further away. A smaller peak in the visible region, at around 3 eV, also seems to be shared by all the spectra of these MSi12 clusters. Other peaks are common to several of these spectra, but not to all. We note that such similar features are usually shared by cages for which the metal species are close to each other in the Periodic Table. For example, the VSi12 and CrSi12 absorption spectra are very similar. The same applies to the NbSi12 and TaSi12 cages. At this point, it is worth to consider how the optical absorption spectra change along a given group of the Periodic Table, as elements from the same group have similar electronic configurations. Concerning the elements from group 4 (VSi12, NbSi12, and TaSi12), we see that, with the exception of the peak at around 4 eV, all the other peaks are slightly shifted towards higher energies when increasing the atomic number. There is also a peak that appears at around 3.6 eV in the optical absorption spectra of NbSi12 which increases in intensity when moving to TaSi12. As for the elements from group 5 (CrSi12, MoSi12, and WSi12), the most noticeable changes in their spectra are found in two peaks at around 3.5 eV and 4.5 eV that shift towards higher energies. In the former case, the peak relative intensity also seems to increase when going from CrSi12 to WSi12. Finally, concerning the elements from group 10 (PdSi12 and PtSi12), besides the aforementioned peaks at around 3.0 and 3.5 eV, we also note the existence of similar peaks at around 1 and 4 eV, although slightly shited towards lower energies in the case of PtSi12.
The same kind of analysis can also be provided for the spin-susceptibility spectra shown in the lower panel of Fig. 2, although in this case the similarities are clearly more pronounced among spectra of cages for which the metal species belong to the same group. Concerning this point, we note that the total magnetic moments of the cages with perfect symmetry are the same for metal elements that belong to the same group, but different for cages for which the metal elements belong to different groups (1 , 0 , and 2 for groups 4, 5, and 10 of the Periodic Table, respectively). Looking in more detail at the spin-susceptibility spectra of the group 4 cages (VSi12, NbSi12, and TaSi12), we observe that the structure of the NbSi12 and TaSi12 spectra are almost identical, while some differences are found for the VSi12 spectra outside the 2-3 eV range. These differences include the lowest energy peak, which is shifted almost 1 eV towards higher energy in the case of the VSi12 spectra, and the relative intensities of the peaks found in the 3-3.5 eV range. Nevertheless, there are three peaks between 2 and 3 eV that feature in the spectra of all these cages. We also note that the relative intensity of the peak at around 2.2 eV increases with the increasing of the atomic number of the metal species. As for the group 5 cages (CrSi12, MoSi12, and WSi12), three peaks are also found between 2 and 3 eV in all cases, but there is no clear trend regarding their relative intensities. Finally, in the case of the group 10 cages (PdSi12 and PtSi12), three peaks are again found between 2 and 3 eV for all cases with no clear trend regarding their relative intensities. Furthermore, two peaks with similar intensities are found between 0.8 and 1.2 eV, although slightly shifted towards lower energies in the case of PtSi12.
Concerning the more distorted MSi12 clusters belonging to the second and third classes of geometries shown in Fig. 1, we note that both their optical absorption and spin-susceptibility spectra are clearly distinct from the ones of the clusters with perfect symmetry. In particular, the spectra of these cages have a more complex structure, as expected. Furthermore, we note that the change of the metal species within the group 3 of the Periodic Table (TiSi12, ZrSi12, and HfSi12), which correspond to the clusters belonging to our second class of geometries, does change both the optical absorption and spin-susceptibility spectra in a noticeable way. It is possible that the same peaks appear in the spectra of these three clusters, but the complexity of the spectra does not allow us to ascertain it.
From the discussion above, it is clear that the cage geometry is important in determining the excited-state properties of these clusters. Since the spectra of cages with the same geometry share significant spectral features, it is quite likely that some of the calculated excitations only involve states localized at the cage itself, i.e., at the silicon atoms. In order to verify this hypothesis, we calculated the optical absorption spectra of the corresponding “empty” hydrogenated cages, using the geometries obtained as explained in Sec. II. This also allows for a better understanding of the direct contribution of the metal atom to the excited-state properties of the clusters.
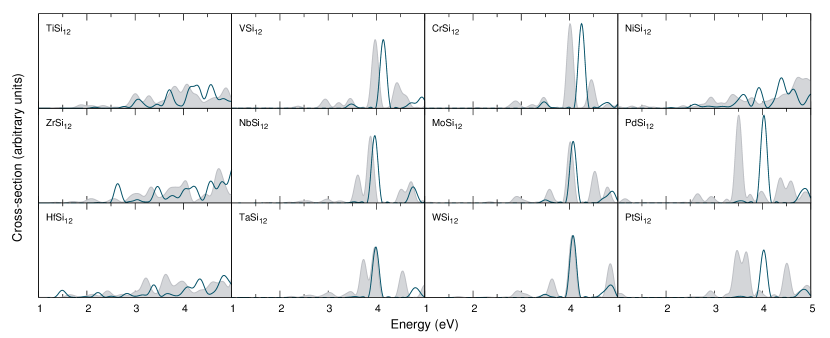
In Fig. 3, a comparison between the optical absorption spectra of the MSi12 clusters and their corresponding hydrogenated “empty” cages is provided. Looking first at the spectra of the cages with perfect symmetry, we note the presence of a distinct peak located between 4.0 and 4.3 eV in all the Si12H12 spectra. These are quite close to the similar peak found at around 4.0 eV in the case of the corresponding MSi12 clusters, with the notable exception of PdSi12 and PtSi12, where the peak is found at around 3.5 eV. Nevertheless, it is well noticeable that in the case of the group 4 and group 5 cages (VSi12, NbSi12, TaSi12, CrSi12, MoSi12, and WSi12), the position of this peak changes a lot more in the case of the corresponding Si12H12 clusters than in the case of the MSi12 clusters. The fact that the peak position changes in the case of the Si12H12 clusters is to be expected, as the distance between the Si atoms increases with increasing atomic number of the metal species of the corresponding MSi12 cluster. This raises the question of why a similar thing does not happen in the case of the corresponding MSi12 clusters. A possible explanation would be that the presence of the metal atom counteracts the change in the spectra induced by the stretching of the Si bonds. A peak at 3.5 eV is also shared by all the Si12H12 cages, although in the case of the Nb and Ta ones, its relative intensity is quite small. We find a peak with similar relative intensity in the spectra of VSi12 and CrSi12. A similar peak also appears in the spectra of MoSi12 and WSi12, but at higher energies and with higher relative intensities. From the results presented in Fig. 3, we conclude that some of the observed transitions are, indeed, located at the silicon atoms, but that the presence of the metal atom cannot be neglected. Once again, the complexity of the spectra of the remaining two classes of equilibrium geometries (TiSi12, ZrSi12, HfSi12, and NiSi12) complicates their analysis, making it difficult to assign specific peaks to the cage itself.
III.2 MSi10 clusters
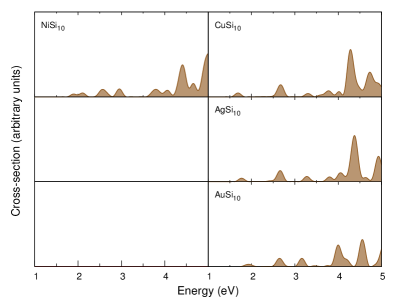
In Fig. 4, the calculated optical absorption and spin-susceptibility spectra of the MSi10 clusters are shown. Like for the MSi12 species, the spectra are arranged with respect to each other in a similar way as the corresponding metal species are arranged in the Periodic Table.
From Fig. 4, several clear trends can be identified in the optical absorption spectra of the group 11 cages (CuSi10, AgSi10, and AuSi10). When going from CuSi10 to AuSi10, i.e., when going to heavier metal species, we observe that the peak found between 1.5 and 2.0 eV is shifted towards higher energies, the peak around 2.6 eV remains practically unchanged, and the peak found between 3.0 and 3.5 eV is shifted towards lower energies and its relative intensity increases. For the spectral features above 3.5 eV the situation is not so clear. Despite this, we note that the overall shapes of the CuSi10 and AgSi10 spectra are quite similar, which is not the case when comparing these spectra to the one of AuSi10. Similarly, in the case for the spin-susceptibility spectra, we observe that the peak found between 1.5 and 2.0 eV is shifted towards higher energies when going to heavier metal species. As for the two peaks found between 2.0 and 2.5 eV in the spin-susceptibility spectra, we observe that the peak at higher energy is shifted towards lower energies when going to heavier metal species, eventually leading to the merging of these two peaks in the AuSi10 spectra. A similar situation is also observed for the two peaks found between 2.5 and 3.0 eV. Finally, the peak found around 3.6 eV remains practically unchanged when going from CuSi10 to AgSi10, while a splitting of the same peak seem to occur when going from AgSi10 to AuSi10. Comparing the NiSi10 spectra with the ones of the group 11 cages, we find many similarities. For the optical absorption spectra, we find peaks at around 2.6, 3.7, 4.0, and 4.3 with similar relative intensities for all the four clusters NiSi10, CuSi10, AgSi10, and AuSi10. As for the spin-susceptibility spectra, we find peaks close to 1.7, 2.3, 2.8, and 3.5 eV with similar relative intensities in all cases. These similarities can be explained by the similar geometry of these cages.
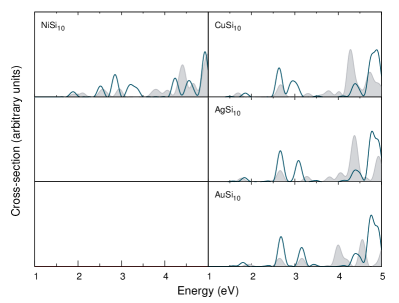
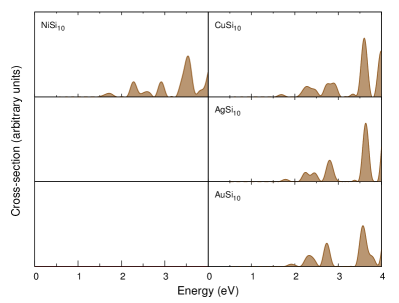
As in the case of the MSi12 clusters, we also calculated the optical absorption spectra of the corresponding “empty“ hydrogenated cages for the MSi10 clusters. The results can be seen in Fig. 5. The spectra of the Si10H10 clusters are more complex than those of MSi10, but it is still possible to identify peaks shared with the spectra of the MSi10 clusters. We observe such peaks at around 1.7, 2.5 eV, and 3.1 eV, although their relative intensities are not quite the same. We also point out that the spectra of the Si10H10 cages corresponding to group 11 metal species (CuSi10, AgSi10, and AuSi10) are almost identical, while some differences are found with respect to the spectra corresponding to the NiSi10 cluster. This confirms our previous conclusion drawn with respect to the MSi12 clusters that some of the observed transitions are, indeed, located at the silicon atoms, but that the presence of the metal atom cannot be neglected.
IV Conclusions
In this work, we have studied optical and magnetic excitations of selected endohedral MSi12 and MSi10 clusters. The geometries of the clusters were determined using density functional theory, while a real-time formulation of time-dependent density functional theory was used to calculate their optical absorption and spin-susceptibility spectra. The obtained results were then analyzed by taking into account the position of the metal species in the Periodic Table. From the calculated spectra, we found that these are mainly determined by, in decreasing order of importance: 1) the cage shape, 2) the group in the Periodic Table the metal specie belongs to, and 3) the period of the metal species in the Periodic Table. This means that cages with similar structures and metal species that are close to each other in the Periodic Table will have spectra that share many similarities. This implies that the fine tuning of the excited-state properties for such cages might be better achieved by replacing the metal atom by one belonging to the same group or, to a lesser extent, to the same period, provided that this substitution does not alter the shape of the cage. In this respect, the MSi10 clusters (M = Ni, Cu, Ag, Au) and the MSi12 clusters with perfect D6h symmetry (M = V, Cr, Zr, Nb, Mo, Pd, Ta, W, Pt) studied in this work seem to be particularly suited as tunable building blocks for self-assembled nano-opto-electro-mechanical devices. Finally, we point out that our results indicate that optical absorption spectroscopy could be a useful tool for the structural identification of MSi10 and MSi12 clusters produced in experiments.
Acknowledgements.
We thankfully acknowledge the computer resources provided by the Laboratory for Advanced Computation of the University of Coimbra. MJTO thankfully acknowledges financial support from the Portuguese FCT (contract #SFRH/BPD/44608/2008). PVCM and GKG gratefully acknowledge support by the Swedish Foundation for International Cooperation in Research and Higher Education (STINT) - Project YR2009-7017, and also by the Swedish Research Council (VR). GKG acknowledges support by the Linkö̈ping Linnaeus Initiative on Novel Functionalized Materials (VR) as well as by Carl Tryggers Foundation for scientific research.References
- Beck (1987) S. M. Beck, J. Chem. Phys. 87, 4233 (1987).
- Jackson and Nellermoe (1996) K. Jackson and B. Nellermoe, Chem. Phys. Lett. 254, 249 (1996).
- Han and Shi (2001) J.-G. Han and Y.-Y. Shi, Chem. Phys. 266, 33 (2001).
- Kumar and Kawazoe (2001) V. Kumar and Y. Kawazoe, Phys. Rev. Lett. 87, 045503 (2001).
- Hiura et al. (2001) H. Hiura, T. Miyazaki, and T. Kanayama, Phys. Rev. Lett. 86, 1733 (2001).
- Miyazaki et al. (2002) T. Miyazaki, H. Hiura, and T. Kanayama, Phys. Rev. B 66, 121403 (2002).
- Khanna et al. (2002) S. N. Khanna, B. K. Rao, and P. Jena, Phys. Rev. Lett. 89, 016803 (2002).
- Hagelberg et al. (2003) F. Hagelberg, C. Xiao, and W. A. Lester, Jr., Phys. Rev. B 67, 035426 (2003).
- Gueorguiev and Pacheco (2003a) G. K. Gueorguiev and J. M. Pacheco, J. Chem. Phys. 119, 10313 (2003a).
- Gueorguiev et al. (2006a) G. K. Gueorguiev, J. M. Pacheco, S. Stafström, and L. Hultman, Thin Solid Films 515, 1192 (2006a).
- Pacheco et al. (2002) J. M. Pacheco, G. K. Gueorguiev, and J. L. Martins, Phys. Rev. B 66, 033401 (2002).
- Uchida et al. (2003) N. Uchida, L. Bolotov, T. Miyazaki, and T. Kanayama, J. Phys. D: Appl. Phys. 36, L43 (2003).
- Gueorguiev et al. (2008) G. K. Gueorguiev, S. Stafström, and L. Hultman, Chem. Phys. Lett. 458, 170 (2008).
- Menon et al. (2002) M. Menon, A. N. Andriotis, and G. Froudakis, Nanoletters 2, 301 (2002).
- Nayak et al. (2006) S. K. Nayak, M. E. Gruner, and P. Entel, Phase Transitions 79, 709 (2006).
- Singh et al. (2002) A. K. Singh, V. Kumar, T. M. Briere, and Y. Kawazoe, Nanoletters 2, 1243 (2002).
- Jena et al. (1996) P. K. Jena, S. N. Khanna, and B. K. Rao, Mat. Sci. Forum 232, 1 (1996).
- Cui and Lieber (2001) Y. Cui and C. M. Lieber, Science 291, 851 (2001).
- Kumar (2006) V. Kumar, Comp. Mat. Science 36, 1 (2006).
- Runge and Gross (1984) E. Runge and E. K. U. Gross, Phys. Rev. Lett. 52, 997 (1984).
- Marques et al. (2012) M. A. L. Marques, N. T. Maitra, F. M. S. Nogueira, E. K. U. Gross, and A. Rubio, eds., Fundamentals of Time-Dependent Density Functional Theory, vol. 837 of Lecture Notes in Physics (Springer Verlag, Berlin, 2012).
- Yabana and Bertsch (1999a) K. Yabana and G. F. Bertsch, Phys. Rev. A 60, 3809 (1999a).
- Harb et al. (2007) M. Harb, F. Rabilloud, and D. Simon, Chem. Phys. Lett. 449, 38 (2007).
- Castro et al. (2008) A. Castro, M. A. L. Marques, A. H. Romero, M. J. T. Oliveira, and A. Rubio, J. Chem. Phys. 129, 144110 (2008).
- Stener et al. (2008) M. Stener, A. Nardelli, and G. Fronzoni, Chem. Phys. Lett. 462, 358 (2008).
- Vasiliev et al. (2001) I. Vasiliev, S. Ögüt, and J. R. Chelikowsky, Phys. Rev. Lett. 86, 1813 (2001).
- Thingna et al. (2011) J. Thingna, R. Prasad, and S. Auluck, J. Phys. Chem. Solids 72, 1096 (2011).
- He et al. (2010) J. He, K. Wu, R. Sa, Q. Li, and Y. Wei, Chem. Phys. Lett. 490, 132 (2010).
- Yabana and Bertsch (1996) K. Yabana and G. F. Bertsch, Phys. Rev. B 54, 4484 (1996).
- Serra et al. (1993) L. Serra, R. A. Broglia, M. Barranco, and J. Navarro, Phys. Rev. A 47, R1601 (1993).
- Torres and Balbás (2000) M. B. Torres and L. C. Balbás, J. Phys.: Condens. Matter 12, 4365 (2000).
- Yabana and Bertsch (1999b) K. Yabana and G. F. Bertsch, Phys. Rev. A 60, 1271 (1999b).
- Varsano et al. (2009) D. Varsano, L. A. Espinosa-Leal, X. Andrade, M. A. L. Marques, R. D. Felice, and A. Rubio, Phys. Chem. Chem. Phys. 11, 4481 (2009).
- Castro et al. (2006) A. Castro, H. Appel, M. Oliveira, C. A. Rozzi, X. Andrade, F. Lorenzen, M. A. L. Marques, E. K. U. Gross, and A. Rubio, Phys. Stat. Sol. B 243, 2465 (2006).
- Andrade et al. (2012) X. Andrade, J. Alberdi-Rodriguez, D. A. Strubbe, M. J. T. Oliveira, F. Nogueira, A. Castro, J. Muguerza, A. Arruabarrena, S. G. Louie, A. Aspuru-Guzik, et al., J. Phys.: Condens. Matter 24, 233202 (2012).
- Kresse and Furthmüller (1996) G. Kresse and J. Furthmüller, Phys. Rev. B 54, 11169 (1996).
- Blöchl (1994) P. E. Blöchl, Phys. Rev. B 50, 17953 (1994).
- Kresse and Joubert (1999) G. Kresse and D. Joubert, Phys. Rev. B 59, 1758 (1999).
- Perdew et al. (1996) J. P. Perdew, K. Burke, and M. Ernzerhof, Phys. Rev. Lett. 77, 3865 (1996).
- Xie et al. (2003a) R.-H. Xie, G. W. Bryant, L. Jensen, J. Zhao, and V. H. Smith, J. Chem. Phys. 118, 8621 (2003a).
- Xie et al. (2003b) R.-H. Xie, G. W. Bryant, and V. H. Smith, Jr., Chem. Phys. Lett. 368, 486 (2003b).
- Gueorguiev and Pacheco (2003b) G. K. Gueorguiev and J. M. Pacheco, Phys. Rev. B 68, 241401 (2003b).
- Gueorguiev and Pacheco (2001) G. K. Gueorguiev and J. M. Pacheco, J. Chem. Phys. 114, 6068 (2001).
- Gueorguiev et al. (2006b) G. K. Gueorguiev, A. Furlan, H. Högberg, S. Stafström, and L. Hultman, Chem. Phys. Lett. 426, 374 (2006b).
- Furlan et al. (2008) A. Furlan, G. K. Gueorguiev, Z. Czigány, H. Högberg, S. Braun, S. Stafström, and L. Hultman, Phys. Stat. Sol. RRL 2, 191 (2008).
- Rivelino et al. (2010) R. Rivelino, R. B. D. Santos, F. d. B. Mota, and G. K. Gueorguiev, J. Phys. Chem. C 114, 16367 (2010).
- Troullier and Martins (1991) N. Troullier and J. L. Martins, Phys. Rev. B 43, 1993 (1991).
- Reis et al. (2003) C. L. Reis, J. M. Pacheco, and J. L. Martins, Phys. Rev. B 68, 155111 (2003).
- Oliveira and Nogueira (2008) M. J. T. Oliveira and F. Nogueira, Comp. Phys. Comm. 178, 524 (2008).
- Oliveira et al. (2008) M. J. T. Oliveira, A. Castro, M. A. L. Marques, and A. Rubio, J. Nanosci. Nanotechnol. 8, 3392 (2008).
- Marques et al. (2001) M. A. L. Marques, A. Castro, and A. Rubio, J. Chem. Phys. 115, 3006 (2001).
- Perdew and Wang (1992) J. P. Perdew and Y. Wang, Phys. Rev. B 45, 13244 (1992).