11email: alessandro.pizzella@unipd.it 22institutetext: INAF-Osservatorio Astronomico di Padova, vicolo dell’Osservatorio 5, I-35122 Padova, Italy.
The external origin of the polar gaseous disk of the S0 galaxy IC 5181 ††thanks: Based on observation collected at the European Southern Observatory for the programme 63.N-0327(A). ††thanks: Tables 1—3 are available in electronic form at http://www.aanda.org.
Abstract
Context. Galaxies accrete material from the environment through acquisition and merging events. These processes contribute to galaxy assembly and leave their fingerprints on the galactic morphology, internal kinematics of gas and stars, and stellar populations.
Aims. We study the nearby S0 galaxy IC 5181 to address the origin of the ionized-gas component orbiting the galaxy on polar orbits.
Methods. We measure the surface brightness distribution of the stars and ionized gas of IC~5181 from broad and narrow-band imaging. The structural parameters of the galaxy are obtained with a photometric decomposition assuming a Sérsic and exponential profile for the bulge and disk, respectively. We measure the ionized-gas and stellar kinematics and the line strengths of the Lick indices of the stellar component along both the major and minor axis. The age, metallicity, and [] enhancement of the stellar populations are derived using single stellar population models with variable element abundance ratios. The ionized-gas metallicity is obtained from the equivalent width of the emission lines.
Results. IC 5181 is a morphologically undisturbed S0 galaxy with a classical bulge made by old stars with super solar metallicity and overabundance. Stellar age and metallicity decrease in the disk region. The galaxy hosts a geometrically and kinematically decoupled component of ionized gas. It is elongated along the galaxy minor axis and in orthogonal rotation with respect to the galaxy disk.
Conclusions. We interpret the kinematical decoupling as suggestive of a component of gas, which is not related to the stars and having an external origin. It was accreted by IC 5181 on polar orbits from the surrounding environment.
Key Words.:
galaxies: individual: IC 5181 – galaxies: photometry – galaxies: kinematics and dynamics – galaxies: formation – galaxies: stellar content.1 Introduction
It is widely accepted that galaxies undergo a number of acquisition and merging events during their assembly and growth. Depending on the nature and mass of the accreted material and the geometry and duration of the accretion process, such events may leave temporary or permanent signatures in the morphology, kinematics, and stellar populations of the host galaxy (see the reviews by Rubin 1994, Schweizer 1998, and Bertola & Corsini 1999). Some examples of the features observed in lenticular and spiral galaxies are the counter-rotating disks of gas (Ciri et al. 1995; Chung et al. 2012) and stars (Rubin et al. 1992; Bertola et al. 1996), nuclear polar disks (Corsini et al. 2003; Sil’chenko & Afanasiev 2004) and large-scale polar rings (Whitmore et al. 1990; Moiseev et al. 2011), polar bulges (Bertola et al. 1999; Matthews & de Grijs 2004), and nuclear stellar disks (Krajnović & Jaffe 2004; Corsini et al. 2012).
Lenticular galaxies are gas-poor systems (Haynes et al. 1984). Several pieces of evidence suggest that the origin of gas is external, in at least a fair fraction of S0s, and not only in some peculiar cases. Assuming gas infall with randomly oriented angular momentum, Bertola et al. (1992) found that the ionized gas is of external origin in about of the S0 galaxies in their sample. This result has been confirmed by Kuijken et al. (1996) who set the fraction of S0s with retrograde gas to . More recently, studying a large sample of fast-rotating early-type galaxies, Davis et al. (2011) found that of galaxies show decoupling between the stellar and gaseous components.
Counter-rotating gaseous disks are observed in less than of spiral galaxies and only a few of them host a significant fraction of counter-rotating stars (Kannappan & Fabricant 2001; Pizzella et al. 2004). The comparison with S0 galaxies suggests that the retrograde acquisition of small amounts of external gas gives rise to counter-rotating gaseous disks only in S0s, while in gas-rich spirals the newly acquired gas is swept away by the pre-existing gas. The gas from the environment interacts and dissipates with that of the host galaxy and in most of cases it will not survive to build a counter-rotating component. Indeed, counter-rotating gaseous and stellar disks in spirals are formed only from the retrograde acquisition of large amounts of gas exceeding that of pre-existing gas and fuelling a subsequent in situ star formation. The two counter-rotating stellar components are expected to have different stellar populations (Coccato et al. 2013; Katkov et al. 2013).
In addition, there are disk galaxies where the angular momenta of the main stellar body and decoupled gaseous component are even orthogonal to each other. This is the case of polar ring galaxies. The accretion of external material through the capture of gas clouds or merging (Spavone et al. 2010; Combes et al. 2013) is invoked also to explain the formation of this class of relatively rare objects (Moiseev et al. 2011). The infall of massive gas clouds gives rise to the formation of large-scale polar disks of stars (Iodice et al. 2002). Inclined disks of stars and gas are also observed in lenticular galaxies (Sil’chenko et al. 2009). The stability of polar and inclined orbits in axisymmetric and triaxial potentials have been addressed both from the theoretical (e.g., Friedli & Benz 1993; Athanassoula 2003) and observational point of view (Pizzella et al. 1997; Emsellem et al. 2006; Bureau et al. 2006).
IC~5181 is a large (; de Vaucouleurs et al. 1991, hereafter RC3), and bright (; RC3) early-type disk galaxy. It is classified as edge-on SA0 in RC3 and S01(7) in Sandage & Bedke (1994) due to the presence of a flattened thick disk. Its total absolute magnitude is corrected for inclination and extinction (RC3) and adopting a distance of 24.8 Mpc (Tully 1988). IC 5181 is a member of the loose NGC 7213 group (Maia et al. 1989; Garcia 1993). It forms a pair with the edge-on spiral galaxy NGC 7232A at separation corresponding to a projected linear distance of 58.4 kpc.
In the framework of acquisition events occurred in the lifetime of galaxies, we present IC 5181 as a new case of a disk galaxy characterized by a geometric and kinematic orthogonal decoupling between its stellar body and the ionized-gas component. This paper is organized as follows. The photometric and spectroscopic observations of IC 5181 are presented in Sect. 2. The results about the measurements of the distribution, kinematics, and chemical properties of the stars and ionized gas are discussed in Sect. 3. The conclusions are given in Sect. 4.
2 Observations and data reduction
2.1 Narrow and broad-band imaging
The photometric observations of IC 5181 were carried out at European Southern Observatory (ESO) in La Silla with the 2.2-m MPG/ESO telescope equipped with the Wide Field Imager (WFI) on July 22, 1999.
The galaxy was centered on the No. 51 EEV CCD which has pixels of . It yielded a field of view of with an image scale of pixel-1. The gain and readout noise are 2.1 count-1 and 5.2 (rms), respectively. Two 300-s narrow-band images were obtained with the No. 856 filter in order to isolate the spectral region characterized by the redshifted and [N II] emission lines according to the galaxy systemic velocity. One 30-s, two 300-s, and one 600-s images were taken with the Ic/Iwp No. 845 broad-band filter in order to subtract off the stellar continuum from the emission-band images. The shortest exposure was taken to deal with the saturation of the galaxy nucleus resulting in the deeper broad-band exposures. Since the night was characterized by good photometric conditions, some photometric standards were observed to calibrate the flux of broad-band images.
The data reduction was performed using standard MIDAS111The Munich Image Data Analysis System (MIDAS) is developed and maintained by the European Southern Observatory (ESO). routines. All the images were bias subtracted and flat-field corrected. The sky level was determined in a number of regions selected to be empty areas far from IC 5181 to avoid the contamination of the target galaxy as well as of foreground and background sources. The broad-band images were affected by fringing, which was corrected by subtracting the fringing-pattern frame made available to this aim by the ESO calibration plan of WFI. This reduced the fringing level from to less than of the sky level. No fringing correction was needed for the narrow-band images. Then the images were shifted and aligned to an accuracy of a few hundredths of a pixel using common field stars as a reference. After checking their point-spread functions (PSFs) were comparable, the frames obtained with the same filter were combined to obtain a single narrow and single broad-band image. The cosmic rays were identified and removed during the averaging process. The seeing FWHM of the resulting narrow and broad-band image as measured by fitting a two-dimensional Gaussian to the field stars is and , respectively. The broad-band image was flux calibrated to the Cousins -band. The photometric calibration constant includes only the correction for atmospheric extinction, which is taken from the differential aerosol extinction for ESO (Burki et al. 1995). No colour term has been considered and no attempt was made to correct for internal and Galactic extinction.
Finally, the broad-band image was convolved with a Gaussian PSF to yield the same PSF FWHM of the narrow-band image. The broad-band image was suitably scaled and subtracted from the narrow-band image to obtain a continuum-free map of the [N II] emission of the galaxy. The scale factor was estimated by comparing the surface brightness measured in the two pass-bands between and from the center.
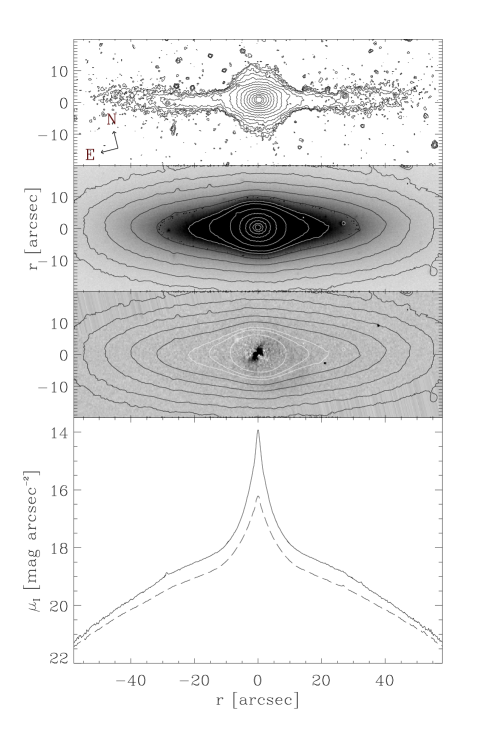
The resulting -band and continuum-free images of IC 5181 are shown in Fig. 1.
2.2 Long-slit spectroscopy
The spectroscopic observations of IC 5181 were carried out at ESO in La Silla with the 1.52-m ESO telescope on June 9-11, 1999. The telescope was equipped with the Cassegrain Boller & Chivens spectrograph. The No. 33 grating with 1200 grooves mm-1 was used in the first order in combination with a slit, and the No. 39 Loral/Lesser CCD which has pixels of . The gain and readout noise are 1.2 count-1 and 5.4 (rms), respectively. The spectral range between about Å and Å was covered with a reciprocal dispersion of Å pixel-1. The spatial scale was pixel-1. The instrumental resolution was 2.75 Å (FWHM) and it was derived as the mean of the Gaussian FWHM’s measured for a dozen unblended arc-lamp lines distributed over the whole spectral range of a wavelength-calibrated comparison spectrum. It corresponds to km s-1 at .
IC 5181 was observed along the major () and minor axis (). At the beginning of each exposure the galaxy was centered on the slit using the guiding camera. Repeated exposures of 2700 s each ensured 1.5 and 3.0 hours of effective integration along the major and minor axis, respectively without storing up too many cosmic rays. Some spectro-photometric standard stars were observed to calibrate the flux of the spectra before line-strength indices were measured. Spectra of the comparison arc lamp were taken before and/or after object exposures. The value of the seeing FWHM during the observing nights, measured by the La Silla Differential Image Motion Monitor (DIMM) ranged between and .
All the spectra were bias subtracted, flat-field corrected, cleaned of cosmic rays, corrected for bad columns, and wavelength and flux calibrated using MIDAS. Each spectrum was rebinned using the wavelength solution obtained from the corresponding arc-lamp spectrum. All the galaxy and stellar spectra were corrected for CCD misalignment. The sky contribution was determined by interpolating along the outermost at the two edges of the slit, where the galaxy or stellar light was negligible, and then subtracted. A sky subtraction better than was achieved. Each spectrum was flux-calibrated using the sensitivity function obtained from the flux standard star spectrum of the corresponding night. The spectra obtained for the same galaxy along the same axis were coadded using the center of the stellar continuum as a reference, thus improving the signal-to-noise ratio () of the final two-dimensional spectrum.
The stellar kinematics was measured from the galaxy absorption features present in the wavelength range and centered on the Mg I line triplet ( 5164, 5173, 5184 Å) using the Gas and Absorption Line Fitting (GANDALF; Sarzi et al. 2006) IDL222The Interactive Data Language (IDL) is distributed by ITT Visual Information Solutions. code adapted for dealing with the spectra of the 1.52-m ESO telescope. The galaxy spectra were rebinned along the dispersion direction to a logarithmic scale, and along the spatial direction to obtain a per resolution element. At each radius a linear combination of template stellar spectra from the MILES library by Sánchez-Blázquez et al. (2006) was convolved with the line-of-sight velocity distribution (LOSVD) and fitted to the observed galaxy spectrum by minimization in pixel space. The LOSVD was assumed to be a Gaussian plus third- and fourth-order Gauss-Hermite polynomials, which describe the asymmetric and symmetric deviations of the LOSVD from a pure Gaussian profile (van der Marel & Franx 1993; Gerhard 1993). This allowed us to derive the radial profiles of the line-of-sight velocity, velocity dispersion, and third- and fourth-order Gauss-Hermite moments of the stellar component.
The ionized-gas kinematics was measured with GANDALF from the emission lines present in the spectra, namely , [O III], [N II], , and [S II]. The low of the stellar continuum prevented us to use GANDALF for measuring the gas kinematics for along the galaxy minor axis. In this radial range the lines of the [N II] doublet and were fitted by Gaussians, while describing the stellar continuum with a low-order polynomial. We averaged adjacent spectral rows to increase the of the relevant emission lines. The Gaussians were assumed to share the same velocity and velocity dispersion which correspond to the line-of-sight velocity and velocity dispersion of the ionized gas, respectively. A flux ratio of 1:2.96 was assumed for the [N II] doublet, as dictated by atomic physics (e.g., Osterbrock 1989). The best-fitting Gaussian parameters were derived using a non-linear least-squares minimization based on the robust Levenberg-Marquardt method using the MPFIT algorithm (Markwardt 2009) under the IDL environment as done in Pizzella et al. (2008). This allowed us to trace the radial profiles of the line-of-sight velocity and velocity dispersion of the ionized-gas component.
The uncertainties on the kinematic parameters of the stars and ionized gas were estimated by rescaling the formal errors given as outputs from the least-squares fitting routines to a reduced .
The Mg, Fe and line-strength indices along the major and minor axes were measured following Morelli et al. (2012b). The flux-calibrated spectra were rebinned in the radial direction to achieve a per resolution element. The spatial binning is therefore different from the one used for the kinematical measurements. The average iron index (Gorgas et al. 1990), and the combined magnesium-iron index (Thomas et al. 2003) were computed too. Errors on indices were derived from photon statistics and CCD readout noise, and calibrated by means of Monte Carlo simulations. The contamination of the line-strength index by the emission line due to the ionized gas present in the galaxy is a problem when deriving the properties of the stellar populations. To address this issue, the index was measured from the galaxy spectrum after subtracting the contribution of the emission line. Only emission lines detected with a were subtracted from the observed spectra.
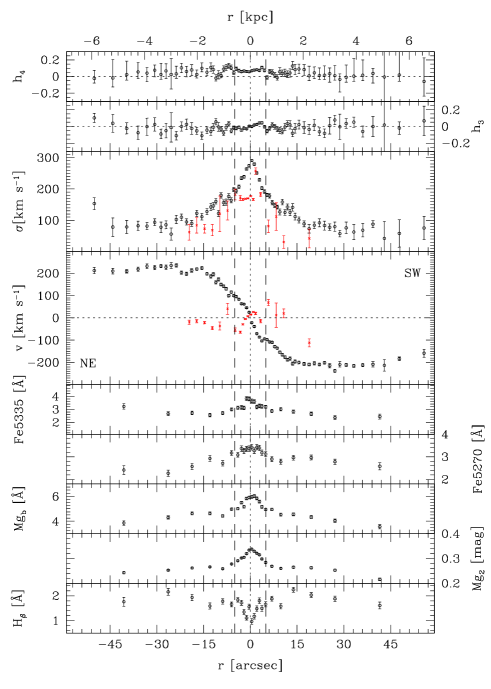
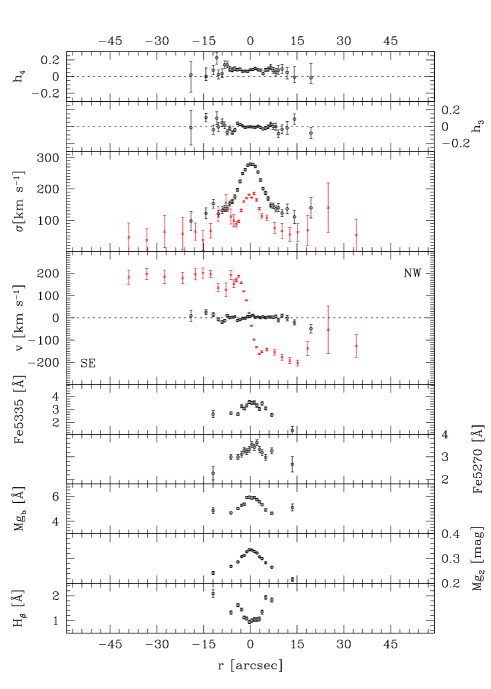
The stellar and ionized-gas kinematics as well as the line-strength indices measured along the major and minor axis of IC 5181 are plotted in Fig. 2 and Fig. 3, respectively. The kinematical measurements are available in Tables 1 and 2 for the stellar and ionized gas, respectively. The line-strength indices measurements are available in Table 3.
3 Results
3.1 Surface photometry
Isophote-fitting with ellipses, after masking foreground stars and residual bad columns, was carried out on the broad-band image using the IRAF333The Imaging Reduction and Analysis Facility (IRAF) is distributed by the National Optical Astronomy Observatory, which is operated by the Association of Universities for Research in Astronomy (AURA), Inc., under cooperative agreement with the National Science Foundation. task ELLIPSE. First isophotes were fitted by ellipses allowing their centers to vary. Within the errors, no variation in the ellipses center was found. Therefore, the final ellipse fits were done at a fixed ellipse center out to a distance of from the center where the galaxy surface brightness is larger than 0.5 times the standard deviation of the sky surface brightness. The ellipse-averaged profiles of surface brightness, position angle, and ellipticity are plotted in Fig. 4.

The position angle of the isophotes peaks to at from the center. At this radius the ellipticity peaks at . Further out, the position angle and ellipticity decrease to at and at , respectively. At larger radii, both the position angle and ellipticity smoothly increase. The position angle reaches a constant value at radii larger than , the ellipticity rises to a maximum at and then decreases to at the outermost observed point. The total magnitude of IC 5181 () was obtained by extrapolating the surface-brightness radial profile. Our measurements are fully consistent with those by Ho et al. (2011).
The observed change in the position angle of the isophotes between and is not expected for an S0 galaxy hosting an axisymmetric bulge. Therefore, a two-dimensional photometric decomposition of the surface-brightness distribution of IC 5181 was performed to better investigate the structure of the galaxy. Two different parametric fitting algorithms were used to this aim, but neither GALFIT (Peng et al. 2010) nor GASP2D (Méndez-Abreu et al. 2008) returned a reliable description of the galaxy. Adding one or more extra axisymmetric components or adopting a thick disk do not improve the result. This suggests the presence of a non-axisymmetric component (either a bar or a triaxial bulge) which can not be properly decomposed due to the high inclination of the galaxy.
Following Bureau et al. (2006), the unsharp-masked image of the broad-band frame was built to first gauge the structure and extent of such a non-axisymmetric structure (Fig. 1). The unsharp-mask image was obtained by median-filtering the broad-band image, that is, by replacing the value of each pixel by the difference between it and that of the median within a centered circular aperture of . The size of the aperture was held fixed across the image, but it was chosen to best highlight the features of interest. The surface-brightness distribution of the unsharp-masked image is remarkably similar to that of the median-filtered image of the -body simulations performed by Athanassoula (2005) to investigate to light distribution of a strong bar seen end on.
In addition, the continuum-subtracted image shows the presence of a faint and featureless ionized-gas emission within the inner from the galaxy center (Fig. 1). The flux of the ionized-gas emission is only a few percents with respect to that of the underlying continuum and the gaseous structure is elongated almost perpendicularly with respect to the galaxy major axis.
We decided to perform a standard one-dimensional photometric decomposition similar to that adopted by several authors (e.g., Kormendy 1977; Prieto et al. 2001; Méndez-Abreu et al. 2008) in order to interpret the radial trends of the kinematic and chemical properties measured for the stars and ionized gas in IC 5181. The radial profile of the surface brightness was modeled as the sum of the contribution of a Sérsic bulge and an exponential disk. The effective surface brightness , effective radius , and shape parameter of the bulge and the central surface brightness and scale-length of the disk were estimated by minimization of the surface brightnesses in counts pixel-1 using the MPFIT algorithm. Each data point was weighted according to the variance of its total observed counts due to the contribution of both galaxy and sky, and determined assuming photon noise limitation and taking the detector gain and read-out noise into account. Seeing effects were also taken into account by convolving the model surface brightness with a Gaussian PSF with an FWHM matching the observed one. The convolution was performed as a product in Fourier domain before the least-squares minimization. The uncertainties on the structural parameters were estimated by rescaling the formal errors of the fit to a reduced . The best-fitting values and their errors are mag arcsec-2, , for the bulge and mag arcsec-2, for the disk. The bulge-to-disk luminosity ratio was derived from the total luminosity after subtracting the disk contribution. The bulge and disk provide the same contribution to the total surface brightness at . The result of the photometric decomposition is shown in Fig. 4. As far as the other structural parameters of the galaxy concern, the innermost peak values of the isophotal position angle and ellipticity were adopted as the observed axial ratio () and position angle () of the bulge, whereas the observed axial ratio () and position angle () of the disk were determined averaging the outer isophotes (). The disk inclination () was calculated by assuming an intrinsic axial ratio of (Padilla & Strauss 2008).
3.2 Stellar and ionized-gas kinematics
The stellar kinematics is measured out to more than on both sides along the galaxy major axis (Fig. 2). The velocity curve of the stars is characterized by a steep gradient in the bulge-dominated region () rising to a maximum observed rotation of about 220 km s-1 at a distance of about . At larger radii the velocity is almost constant, or even declining in the two farthest radii measured on the approaching SW side. The stellar velocity dispersion peaks to a maximum of about 300 km s-1 in the center. Further out it decreases reaching a constant value of 80 km s-1 for radii larger than . The major-axis velocity curve of the ionized gas has a more uncertain behaviour. It is asymmetric and extends only out to from the center. The gaseous component counter-rotates with respect to the stars in the bulge-dominated region. But, the observed rotation velocity is small ( km s-1) and it declines to zero at larger radii. The gas velocity dispersion is roughly constant to about 170 km s-1 for decreasing to about 60 km s-1 outwards.
The stellar kinematics extends to about on each side of the nucleus along the galaxy minor axis (Fig. 3). No rotation is measured for the stars and their velocity dispersion falls from a central value of 300 km s-1 to about 100 km s-1 at the last observed radius. The kinematics of the ionized gas was measured out to larger radii and it is characterized by a sharp rotation. The gas velocity rises to about 180 km s-1 in the inner . Outwards it remains constant out to about on the SE side, whereas it rises and declines on the NW side. The gas velocity dispersion displays a central peak of about 180 km s-1 and it falls to an almost constant value of 60 km s-1 for .
The analysis of the interplay between the kinematics of the ionized-gas and stars along both the major and minor axis of IC 5181 shows that its gaseous and stellar components are kinematically decoupled to each other and their projected rotation axes are almost perpendicular.
3.3 Stellar populations
The line-strength indices Fe5335, Fe5270, Mg, and Mg2 measured along the major axis peak in the center and decrease to an almost constant value for . Conversely, the radial profile of shows a central minimum and increases outwards (Fig. 2). This is likely to be due to differences of the stellar populations of bulge and disk which mostly contribute to the galaxy surface brightness within and outside , respectively (Fig. 4). Indeed, the radial profiles of the line-strength indices do not show any flat portion along the minor axis (Fig. 3), where the galaxy light is less significantly contaminated by the disk contribution due to its high inclination.
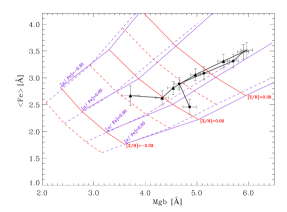
Usually diagrams of different pairs of line-strength indices are adopted for studying the properties of stellar populations. Here, we use the line-strength indices , , and Mg measured in Sect. 2 as done in Morelli et al. (2012b). Balmer lines of hydrogen are the most sensitive probes of the main sequence turn off temperature (Worthey 1994), while the metal lines (like Mg and ) probe the temperature of the red giant branch (Trager et al. 2000) and the abundances of these elements. The models of Thomas et al. (2003) predict the values of these line-strength indices as a function of the mean age , total metallicity [] , and total [] enhancement of a single stellar population.
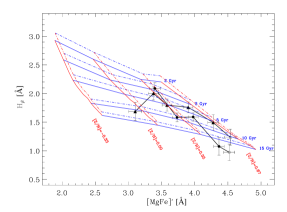
In Fig. 5 we compare the prediction of the single stellar population models and the line-strength measurements of , , and Mg we obtained by folding their radial profiles and averaging contiguous measurements. The radial bins were centered at , and along the major axis and at and along the minor axis.
In the left panel of Fig. 5 the values of and []′ are compared with the model predictions for two stellar populations with solar ([] dex) and super-solar [] enhancement ([] dex), respectively. In this parameter space, the mean age and total metallicity appear to be almost insensitive to the variations of the [] enhancement. In the right panel of Fig. 5, the values of Mg and are compared with the model predictions of Thomas et al. (2003) for two stellar populations with old (8 Gyr) and very old age (12 Gyr), respectively. In this parameter space, the total metallicity and total [] enhancement appear to be almost insensitive to the variations of the ages.
The stellar populations in the very center of IC 5181 are very old ( Gyr). The values of the age measured along both the major and minor axis are consistent within errors. Along the major axis, the age decreases from 12 to 3 Gyr going from the central to the outer () regions of the galaxy where the disk contribution starts to dominate the galaxy light. This is an indication that the stellar population of the disk is younger than that of the bulge and it has a lower metallicity. This result is consistent with the findings by MacArthur et al. (2009) for a sample of 8 spiral galaxies. No clear differences are found for the [] enhancement between the bulge and disk-dominated regions. As expected for an edge-on galaxy, the disk contamination is significantly smaller along the minor axis on account of the inclination of the galaxy. Therefore, the corresponding age gradient is much shallower (from 10 to 7 Gyr). The metallicity in the bulge-dominated region has a super-solar value in the center ([] dex) as it results from the values measured along both major and minor axis. It is characterized by a negligible gradient in the inner along the major axis ([] dex). In the disk-dominated region the metallicity decreases to reach a solar value at about . The [] enhancement displays a constant super-solar value ([] dex) along both the major and minor axis.
The absence of radial gradients of both metallicity and [] enhancement in the inner regions of IC 5181 () suggests a bulge formation through merging events (Bekki & Shioya 1999) with a very short timescale ( Gyr) for the last burst of star formation (Thomas et al. 2005), probably coeval with the epoch of the merging.
3.4 Ionized-gas metallicity
To better characterize the nature of the ionized gas we investigate its metal content and compare it to the stellar component metallicity.
We first have to disentangle between the different sources of ionization. To this aim we used the BPT diagnostic diagrams (Baldwin et al. 1981) adopting the [O III]/, [N II]/, and [S II]/ ratios. The emission line fluxes and their ratios were measured along the minor axis on the same spatial bins adopted for the measurements of the line-strength indices. Data were folded around the center and we averaged the line ratios measured at similar radii on the two sides of the galaxy. The errors were computed as the RMS of the average. The results are shown in Fig.6.
The value of [N II]/= 1.6 found in the central regions is consistent with Phillips et al. (1986) and suggests a Seyfert-type ionization mechanism. However, the last measured points on both sides (″) fall on the limit of the starburst region of the BPT diagram implying that in the outer part of the gaseous disk the ionization due to star formation is dominant. Therefore, only for this region, we derived the gas-phase metallicity from the empirical relation with the emission-lines ratio parameter (Liang et al. 2006) where the intensity of the nebular lines and [O III] was replaced with their equivalent widths following the prescriptions by Kobulnicky & Phillips (2003). This method has the advantage of being insensitive to reddening. Thus, the equivalent width of the and [O III] emission lines was measured in the two radial bins at r=″on the minor-axis spectrum. For each emission line, a central bandpass covering the feature of interest and two adjacent bandpasses, at the red and blue side, tracing the local continuum were defined following González (1993) as done in Morelli et al. (2012a). The continuum level underlying the emission line was estimated by interpolating a straight line in the continuum bandpasses of the spectra. The errors associated with the measured equivalent widths were derived from photon statistics and CCD read-out noise, and calibrated by means of Monte Carlo simulations.
We obtained a value for the gas-phase metallicity of corresponding to a dex which was obtained as done by Sommariva et al. (2012) and Coccato et al. (2013). The latter allows a straightforward comparison with the metallicity of the stellar populations in the disk region. The metal content of the ionized gas is lower with respect to the stars ( dex). We remark that we apply the above analysis to the measurement done at ″ were the emission lines are mainly due to star formation, but contamination by AGN/Liners is present. Anyway, we interpret the difference between the gas phase and stellar component as an additional suggestion of the external origin of the ionized gas, which is not related to the stars and which could have been captured by IC 5181 during an acquisition event from the surrounding environment or neighbouring galaxy.

4 Discussion and conclusions
The morphology of IC 5181 shows no remarkable peculiarity. The galaxy disk has a high inclination with respect to the line of sight () and it has a regular stellar body without any evidence of warp or dust lanes. A quantitative analysis of the photometric and spectroscopic properties showed that IC 5181 can be considered a typical S0 galaxy with a classical bulge according to the prescription by Kormendy & Kennicutt (2004). The colour index and total magnitude are within the ranges measured for S0 galaxies by Bernardi et al. (2005, magnitudes are taken from () and transformed to the SDSS photometric system following ()). The bulge has a central velocity dispersion km s-1 (derived as the mean of the values measured along the major and minor axis), an absolute magnitude , and an effective radius kpc. It follows the Faber-Jackson correlation and lies on the fundamental plane as the most of the bulges of S0 and SB0 galaxies (Aguerri et al. 2005). In addition, it rotates as fast as the bulges of early-type disk galaxies and it is consistent with being an isotropic rotator (adopting and ; see Morelli et al. 2004 and Aguerri et al. 2005 for a comparison). The age (10 Gyr), metallicity ([] dex), and overabundance ([] dex) of the stellar populations in the bulge-dominated region match the typical values of passively evolving S0 bulges, as derived by Thomas et al. (2003). Finally, IC 5181 fits within the scatter the Mg- relation for early-type galaxies by Jørgensen et al. (1999, adopting Mg2).
The presence of a velocity gradient along the galaxy minor axis is the kinematic signature that ionized gas is not moving onto circular orbits in a disk which is coplanar to that of the stars. This is confirmed by the narrow-band imaging showing the distribution of the gas in the innermost regions of IC 5181. Moreover, the short dynamical time (few Myr) we derived for the galaxy regions where we observe the velocity gradient and the regular velocity field of the ionized gas implies that it is already settled in an equilibrium configuration (e.g., Bertola et al. 1985). Since the intrinsic shape of bulges is triaxial (Bertola et al. 1991; Méndez-Abreu et al. 2008, 2010) and two equilibrium planes are allowed for the gaseous component (e.g., de Zeeuw & Franx 1989), we can explain the observed kinematics of IC 5181 as due to ionized gas settled on the equilibrium plane perpendicular to the long axis of a triaxial bulge. The ionized gas is in orthogonal rotation with respect to the galaxy disk and we measure zero velocity (or at least a shallower velocity gradient) along the disk major axis and a sharp velocity gradient along the disk minor axis.
To constrain the orientation of the triaxial bulge we derived the orientation of the gaseous disk with respect to the line of sight. To this aim we compared the circular velocity obtained from the major-axis stellar kinematics with the rotation velocity of the ionized gas measured along the minor axis. The comparison is restricted where the pressure support of the gas is small and therefore the gas velocity is supposed to trace the circular velocity (Bertola et al. 1995; Pignatelli et al. 2001; Dalcanton & Stilp 2010). All the observed velocities were subtracted of systemic velocity and folded around the galaxy center. For radii larger than we obtained a nearly flat circular velocity curve with km s-1 by applying the asymmetric drift correction to the major-axis stellar kinematics as done by Aguerri et al. (2003) after dealing with the effects of integration along the line of sight following Neistein et al. (1999). The ionized-gas rotation curve was derived from the data measured along the minor axis at radii larger than where km s-1. It is flat and shows a constant value km s-1. We deprojected into as done by Wegner et al. (2012), and assuming that the gaseous component is moving onto circular orbits in an infinitesimally thin disk perpendicular to the galaxy disk. For the gaseous disk we derived the inclination () and position angle of its angular momentum (). The small difference () between the position angles of the disk major axis and bulge long axis (which coincides with ) prevented us to successfully model the surface brightness distribution of the triaxial bulge and properly derive its intrinsic shape and contribution to the total light of the galaxy (e.g., as done by Méndez-Abreu et al. 2010; Corsini et al. 2012).
As an alternative, the gas is moving on anomalous orbits in a triaxial bulge (or bar) that is tumbling about its short axis (see van Albada & Sanders 1982; Friedli & Benz 1993, for details). This is the case of the lenticular galaxy NGC 128, which hosts a counter-rotating disk of ionized gas (Emsellem & Arsenault 1997; Chung et al. 2012). Like for IC 5181, the orientation of the ionized gas is not aligned with the stellar disk. This is due to the presence of a tumbling triaxial bar associated with the peanut morphology. In IC 5181 we do not observe gas in retrograde motion relative to stars at large radii from the galaxy center, where the anomalous gas orbits are expected to be highly inclined with respect to the figure rotation axis since the triaxial bulge (or bar) is seen close to end-on. In this scenario the gas is settled into a stable configuration forming a strongly warped disk, whose innermost portion corresponds to an inner polar disk (Corsini et al. 2003; Sil’chenko & Afanasiev 2004). For IC 5181 there is no evidence of stars associated to the orthogonally-rotating gas neither from the observed kinematics nor from the analysis of the stellar populations.
Disentangling between the two alternative geometric configurations with either the innermost or all the ionized-gas component in orthogonal rotation with respect to the stellar disk requires the analysis of the full velocity field of the galaxy measured with integral-field spectroscopy (Coccato et al. 2007). Nevertheless, the kinematical decoupling between the gaseous and stellar components of IC 5181 suggests the occurrence of an accretion event or merging (Bertola & Corsini 1999). Therefore, it is straightforward to explain the existence of the orthogonally rotating gas in IC 5181 as the end result of the acquisition of external gas by the pre-existing galaxy. The nearby environment of IC 5181 shows no strong evidence for such an event. IC 5181 is not interacting with its closest companion, NGC 7232A, and it is one of the few galaxies of the NGC 7213 group to be undetected in H I. However, all these arguments do not exclude an external origin of the ionized-gas component of IC 5181. Bettoni et al. (2001) proved that the environment of galaxies that experienced past gas accretion do not appear statistically different from those of normal galaxies. In addition, the polar orientation of the ionized gas and its possible low metal content fits well with the scenario proposed for the formation of polar ring galaxies, where the gaseous ring is formed by the accretion of material from a cosmic filament (Macciò et al. 2006; Brook et al. 2008).
Acknowledgements.
We thank Michela Mapelli and Marilena Spavone for useful discussions. This work was supported by Padua University through grants 60A02-1283/10, 60A02-5052/11, and 60A02-4807/12. MC and LM acknowledge financial support from Padua University grant CPDR115539/11 and CPS0204, respectively.References
- Aguerri et al. (2003) Aguerri, J. A. L., Debattista, V. P., & Corsini, E. M. 2003, MNRAS, 338, 465
- Aguerri et al. (2005) Aguerri, J. A. L., Elias-Rosa, N., Corsini, E. M., & Muñoz-Tuñón, C. 2005, A&A, 434, 109
- Athanassoula (2003) Athanassoula, E. 2003, MNRAS, 341, 1179
- Athanassoula (2005) Athanassoula, E. 2005, MNRAS, 358, 1477
- Baldwin et al. (1981) Baldwin, J. A., Phillips, M. M., & Terlevich, R. 1981, PASP, 93, 5
- Bekki & Shioya (1999) Bekki, K. & Shioya, Y. 1999, ApJ, 513, 108
- Bernardi et al. (2005) Bernardi, M., Sheth, R. K., Nichol, R. C., Schneider, D. P., & Brinkmann, J. 2005, AJ, 129, 61
- Bertola et al. (1992) Bertola, F., Buson, L. M., & Zeilinger, W. W. 1992, ApJ, 401, L79
- Bertola et al. (1996) Bertola, F., Cinzano, P., Corsini, E. M., et al. 1996, ApJ, 458, L67
- Bertola et al. (1995) Bertola, F., Cinzano, P., Corsini, E. M., Rix, H.-W., & Zeilinger, W. W. 1995, ApJ, 448, L13
- Bertola & Corsini (1999) Bertola, F. & Corsini, E. M. 1999, in IAU Symposium, Vol. 186, Galaxy Interactions at Low and High Redshift, ed. J. E. Barnes & D. B. Sanders, (Kluwer, Dordrecht), 149
- Bertola et al. (1999) Bertola, F., Corsini, E. M., Vega Beltrán, J. C., et al. 1999, ApJ, 519, L127
- Bertola et al. (1985) Bertola, F., Galletta, G., & Zeilinger, W. W. 1985, ApJ, 292, L51
- Bertola et al. (1991) Bertola, F., Vietri, M., & Zeilinger, W. W. 1991, ApJ, 374, L13
- Bettoni et al. (2001) Bettoni, D., Falomo, R., Fasano, G., et al. 2001, A&A, 380, 471
- Brook et al. (2008) Brook, C. B., Governato, F., Quinn, T., et al. 2008, ApJ, 689, 678
- Bureau et al. (2006) Bureau, M., Aronica, G., Athanassoula, E., et al. 2006, MNRAS, 370, 753
- Burki et al. (1995) Burki, G., Rufener, F., Burnet, M., et al. 1995, The Messenger, 80, 34
- Chung et al. (2012) Chung, A., Bureau, M., van Gorkom, J. H., & Koribalski, B. 2012, MNRAS, 422, 1083
- Ciri et al. (1995) Ciri, R., Bettoni, D., & Galletta, G. 1995, Nature, 375, 661
- Coccato et al. (2007) Coccato, L., Corsini, E. M., Pizzella, A., & Bertola, F. 2007, A&A, 465, 777
- Coccato et al. (2013) Coccato, L., Morelli, L., Pizzella, A., et al. 2013, A&A, 549, A3
- Combes et al. (2013) Combes, F., Moiseev, A., & Reshetnikov, V. 2013, A&A, 554, A11
- Corsini et al. (2012) Corsini, E. M., Méndez-Abreu, J., Pastorello, N., et al. 2012, MNRAS, 423, L79
- Corsini et al. (2003) Corsini, E. M., Pizzella, A., Coccato, L., & Bertola, F. 2003, A&A, 408, 873
- Dalcanton & Stilp (2010) Dalcanton, J. J. & Stilp, A. M. 2010, ApJ, 721, 547
- Davis et al. (2011) Davis, T. A., Alatalo, K., Sarzi, M., et al. 2011, MNRAS, 417, 882
- de Vaucouleurs et al. (1991) de Vaucouleurs, G., de Vaucouleurs, A., Corwin, Jr., H. G., et al. 1991, Third Reference Catalogue of Bright Galaxies Vol. 1-3 (New York: Springer)
- de Zeeuw & Franx (1989) de Zeeuw, T. & Franx, M. 1989, ApJ, 343, 617
- Emsellem & Arsenault (1997) Emsellem, E. & Arsenault, R. 1997, A&A, 318, L39
- Emsellem et al. (2006) Emsellem, E., Fathi, K., Wozniak, H., et al. 2006, MNRAS, 365, 367
- Friedli & Benz (1993) Friedli, D. & Benz, W. 1993, A&A, 268, 65
- Garcia (1993) Garcia, A. M. 1993, A&AS, 100, 47
- Gerhard (1993) Gerhard, O. E. 1993, MNRAS, 265, 213
- González (1993) González, J. J. 1993, PhD thesis, University of California
- Gorgas et al. (1990) Gorgas, J., Efstathiou, G., & Aragon Salamanca, A. 1990, MNRAS, 245, 217
- Haynes et al. (1984) Haynes, M. P., Giovanelli, R., & Chincarini, G. L. 1984, ARA&A, 22, 445
- Ho et al. (2011) Ho, L. C., Li, Z.-Y., Barth, A. J., Seigar, M. S., & Peng, C. Y. 2011, ApJS, 197, 21
- Iodice et al. (2002) Iodice, E., Arnaboldi, M., Sparke, L. S., Gallagher, J. S., & Freeman, K. C. 2002, A&A, 391, 103
- Jester et al. (2005) Jester, S., Schneider, D. P., Richards, G. T., et al. 2005, AJ, 130, 873
- Jørgensen et al. (1999) Jørgensen, I., Franx, M., Hjorth, J., & van Dokkum, P. G. 1999, MNRAS, 308, 833
- Kannappan & Fabricant (2001) Kannappan, S. J. & Fabricant, D. G. 2001, AJ, 121, 140
- Katkov et al. (2013) Katkov, I. Y., Sil’chenko, O. K., & Afanasiev, V. L. 2013, ApJ, 769, 105
- Kewley et al. (2001) Kewley, L. J., Dopita, M. A., Sutherland, R. S., Heisler, C. A., & Trevena, J. 2001, ApJ, 556, 121
- Kobulnicky & Phillips (2003) Kobulnicky, H. A. & Phillips, A. C. 2003, ApJ, 599, 1031
- Kormendy (1977) Kormendy, J. 1977, ApJ, 217, 406
- Kormendy & Kennicutt (2004) Kormendy, J. & Kennicutt, Jr., R. C. 2004, ARA&A, 42, 603
- Krajnović & Jaffe (2004) Krajnović, D. & Jaffe, W. 2004, A&A, 428, 877
- Kuijken et al. (1996) Kuijken, K., Fisher, D., & Merrifield, M. R. 1996, MNRAS, 283, 543
- Liang et al. (2006) Liang, Y. C., Yin, S. Y., Hammer, F., et al. 2006, ApJ, 652, 257
- MacArthur et al. (2009) MacArthur, L. A., González, J. J., & Courteau, S. 2009, MNRAS, 395, 28
- Macciò et al. (2006) Macciò, A. V., Moore, B., & Stadel, J. 2006, ApJ, 636, L25
- Maia et al. (1989) Maia, M. A. G., da Costa, L. N., & Latham, D. W. 1989, ApJS, 69, 809
- Markwardt (2009) Markwardt, C. B. 2009, in Astronomical Society of the Pacific Conference Series, Vol. 411, Astronomical Data Analysis Software and Systems XVIII, ed. D. A. Bohlender, D. Durand, & P. Dowler, (San Francisco, CA: ASP), 251
- Matthews & de Grijs (2004) Matthews, L. D. & de Grijs, R. 2004, AJ, 128, 137
- Méndez-Abreu et al. (2008) Méndez-Abreu, J., Aguerri, J. A. L., Corsini, E. M., & Simonneau, E. 2008, A&A, 478, 353
- Méndez-Abreu et al. (2010) Méndez-Abreu, J., Simonneau, E., Aguerri, J. A. L., & Corsini, E. M. 2010, A&A, 521, A71
- Moiseev et al. (2011) Moiseev, A. V., Smirnova, K. I., Smirnova, A. A., & Reshetnikov, V. P. 2011, MNRAS, 418, 244
- Morelli et al. (2012a) Morelli, L., Calvi, V., Cardullo, A., et al. 2012a, A&A, 544, A74
- Morelli et al. (2012b) Morelli, L., Corsini, E. M., Pizzella, A., et al. 2012b, MNRAS, 423, 962
- Morelli et al. (2004) Morelli, L., Halliday, C., Corsini, E. M., et al. 2004, MNRAS, 354, 753
- Neistein et al. (1999) Neistein, E., Maoz, D., Rix, H.-W., & Tonry, J. L. 1999, AJ, 117, 2666
- Osterbrock (1989) Osterbrock, D. E. 1989, Astrophysics of gaseous nebulae and active galactic nuclei (Mill Valley, CA: University Science Books)
- Padilla & Strauss (2008) Padilla, N. D. & Strauss, M. A. 2008, MNRAS, 388, 1321
- Peng et al. (2010) Peng, C. Y., Ho, L. C., Impey, C. D., & Rix, H.-W. 2010, AJ, 139, 2097
- Phillips et al. (1986) Phillips, M. M., Jenkins, C. R., Dopita, M. A., Sadler, E. M., & Binette, L. 1986, AJ, 91, 1062
- Pignatelli et al. (2001) Pignatelli, E., Corsini, E. M., Vega Beltrán, J. C., et al. 2001, MNRAS, 323, 188
- Pizzella et al. (1997) Pizzella, A., Amico, P., Bertola, F., et al. 1997, A&A, 323, 349
- Pizzella et al. (2008) Pizzella, A., Corsini, E. M., Sarzi, M., et al. 2008, MNRAS, 387, 1099
- Pizzella et al. (2004) Pizzella, A., Corsini, E. M., Vega Beltrán, J. C., & Bertola, F. 2004, A&A, 424, 447
- Prieto et al. (2001) Prieto, M., Aguerri, J. A. L., Varela, A. M., & Muñoz-Tuñón, C. 2001, A&A, 367, 405
- Rubin (1994) Rubin, V. C. 1994, AJ, 108, 456
- Rubin et al. (1992) Rubin, V. C., Graham, J. A., & Kenney, J. D. P. 1992, ApJ, 394, L9
- Sánchez-Blázquez et al. (2006) Sánchez-Blázquez, P., Peletier, R. F., Jiménez-Vicente, J., et al. 2006, MNRAS, 371, 703
- Sandage & Bedke (1994) Sandage, A. & Bedke, J. 1994, The Carnegie Atlas of Galaxies. Volumes I, II., (Washington, DC: Carnegie Inst. of Washington)
- Sarzi et al. (2006) Sarzi, M., Falcón-Barroso, J., Davies, R. L., et al. 2006, MNRAS, 366, 1151
- Schweizer (1998) Schweizer, F. 1998, in Saas-Fee Advanced Course 26: Galaxies: Interactions and Induced Star Formation, ed. R. C. Kennicutt, Jr., F. Schweizer, J. E. Barnes, D. Friedli, L. Martinet, & D. Pfenniger, (New York: Springer), 105
- Sil’chenko & Afanasiev (2004) Sil’chenko, O. K. & Afanasiev, V. L. 2004, AJ, 127, 2641
- Sil’chenko et al. (2009) Sil’chenko, O. K., Moiseev, A. V., & Afanasiev, V. L. 2009, ApJ, 694, 1550
- Sommariva et al. (2012) Sommariva, V., Mannucci, F., Cresci, G., et al. 2012, A&A, 539, A136
- Spavone et al. (2010) Spavone, M., Iodice, E., Arnaboldi, M., et al. 2010, ApJ, 714, 1081
- Thomas et al. (2003) Thomas, D., Maraston, C., & Bender, R. 2003, MNRAS, 339, 897
- Thomas et al. (2005) Thomas, D., Maraston, C., Bender, R., & Mendes de Oliveira, C. 2005, ApJ, 621, 673
- Trager et al. (2000) Trager, S. C., Faber, S. M., Worthey, G., & González, J. J. 2000, AJ, 120, 165
- Tully (1988) Tully, R. B. 1988, Nearby galaxies catalog, (Cambridge: Cambridge Univ. Press)
- van Albada & Sanders (1982) van Albada, T. S. & Sanders, R. H. 1982, MNRAS, 201, 303
- van der Marel & Franx (1993) van der Marel, R. P. & Franx, M. 1993, ApJ, 407, 525
- Wegner et al. (2012) Wegner, G. A., Corsini, E. M., Thomas, J., et al. 2012, AJ, 144, 78
- Whitmore et al. (1990) Whitmore, B. C., Lucas, R. A., McElroy, D. B., et al. 1990, AJ, 100, 1489
- Worthey (1994) Worthey, G. 1994, ApJS, 95, 107
On-line tables
| PA | r | VdV | hdh3 | hdh4 | |||||
| ° | ″ | km s-1 | km s-1 | ||||||
| 76 | -50.0 | 213 | 14 | 153 | 19 | 0.103 | 0.056 | -0.022 | 0.096 |
| 76 | -44.1 | 210 | 12 | 78 | 30 | 0.038 | 0.107 | -0.017 | 0.221 |
| 76 | -39.6 | 210 | 8 | 79 | 21 | -0.023 | 0.066 | 0.023 | 0.162 |
| 76 | -36.0 | 219 | 9 | 82 | 14 | -0.075 | 0.080 | 0.056 | 0.111 |
| 76 | -33.2 | 232 | 11 | 82 | 11 | -0.002 | 0.102 | 0.041 | 0.065 |
| 76 | -30.7 | 226 | 10 | 94 | 11 | 0.025 | 0.081 | 0.076 | 0.064 |
| 76 | -28.7 | 233 | 7 | 78 | 17 | -0.090 | 0.058 | 0.025 | 0.135 |
| 76 | -27.0 | 228 | 10 | 86 | 13 | -0.049 | 0.088 | 0.068 | 0.086 |
| 76 | -25.4 | 236 | 14 | 56 | 20 | -0.012 | 0.176 | 0.025 | 0.191 |
| 76 | -23.7 | 236 | 8 | 103 | 13 | -0.110 | 0.052 | 0.032 | 0.092 |
| 76 | -22.1 | 204 | 8 | 110 | 10 | 0.000 | 0.056 | 0.104 | 0.056 |
| 76 | -20.5 | 198 | 8 | 95 | 10 | 0.026 | 0.063 | 0.061 | 0.062 |
| 76 | -18.8 | 213 | 8 | 90 | 10 | -0.023 | 0.070 | 0.079 | 0.063 |
| 76 | -17.2 | 220 | 6 | 122 | 10 | -0.052 | 0.042 | 0.025 | 0.055 |
| 76 | -15.5 | 224 | 6 | 112 | 10 | -0.110 | 0.044 | 0.100 | 0.063 |
| 76 | -13.9 | 198 | 6 | 128 | 9 | -0.044 | 0.040 | 0.051 | 0.048 |
| 76 | -12.7 | 186 | 8 | 143 | 12 | -0.061 | 0.045 | 0.110 | 0.054 |
| 76 | -11.9 | 196 | 8 | 146 | 11 | -0.009 | 0.044 | 0.083 | 0.045 |
| 76 | -11.0 | 160 | 7 | 161 | 8 | 0.057 | 0.036 | -0.019 | 0.039 |
| 76 | -10.2 | 173 | 7 | 122 | 10 | -0.005 | 0.052 | 0.023 | 0.049 |
| 76 | -9.4 | 150 | 6 | 180 | 9 | -0.031 | 0.029 | 0.013 | 0.036 |
| 76 | -8.6 | 142 | 6 | 156 | 9 | -0.079 | 0.031 | 0.089 | 0.040 |
| 76 | -7.8 | 131 | 6 | 158 | 10 | -0.009 | 0.035 | 0.107 | 0.040 |
| 76 | -6.9 | 100 | 6 | 176 | 9 | 0.032 | 0.027 | 0.126 | 0.034 |
| 76 | -6.1 | 116 | 5 | 164 | 8 | -0.053 | 0.025 | 0.106 | 0.032 |
| 76 | -5.3 | 100 | 5 | 199 | 7 | -0.015 | 0.022 | 0.046 | 0.025 |
| 76 | -4.5 | 96 | 4 | 194 | 6 | -0.021 | 0.019 | 0.092 | 0.023 |
| 76 | -3.7 | 84 | 4 | 207 | 6 | -0.012 | 0.016 | 0.070 | 0.019 |
| 76 | -2.8 | 63 | 4 | 235 | 5 | -0.044 | 0.013 | 0.058 | 0.016 |
| 76 | -2.0 | 62 | 3 | 239 | 4 | -0.020 | 0.011 | 0.067 | 0.014 |
| 76 | -1.2 | 46 | 3 | 264 | 4 | -0.029 | 0.009 | 0.061 | 0.011 |
| 76 | -0.4 | 25 | 3 | 274 | 4 | 0.004 | 0.009 | 0.057 | 0.010 |
| 76 | 0.4 | -21 | 3 | 291 | 4 | -0.002 | 0.008 | 0.069 | 0.010 |
| 76 | 1.3 | -38 | 3 | 280 | 4 | 0.019 | 0.009 | 0.078 | 0.011 |
| 76 | 2.1 | -70 | 3 | 251 | 4 | 0.025 | 0.010 | 0.082 | 0.012 |
| 76 | 2.9 | -86 | 3 | 229 | 5 | 0.042 | 0.013 | 0.074 | 0.015 |
| 76 | 3.7 | -103 | 4 | 203 | 6 | 0.044 | 0.015 | 0.107 | 0.019 |
| 76 | 4.5 | -94 | 4 | 192 | 5 | -0.003 | 0.017 | 0.074 | 0.020 |
| 76 | 5.4 | -98 | 4 | 181 | 5 | -0.055 | 0.020 | -0.011 | 0.022 |
| 76 | 6.2 | -108 | 5 | 178 | 7 | -0.021 | 0.023 | 0.060 | 0.026 |
| 76 | 7.0 | -110 | 5 | 156 | 7 | 0.018 | 0.026 | 0.052 | 0.030 |
| 76 | 7.8 | -129 | 5 | 148 | 7 | -0.002 | 0.030 | 0.017 | 0.031 |
| 76 | 8.6 | -136 | 5 | 142 | 6 | -0.030 | 0.031 | -0.013 | 0.033 |
| 76 | 9.5 | -154 | 6 | 127 | 9 | -0.047 | 0.037 | 0.057 | 0.049 |
| 76 | 10.3 | -166 | 6 | 158 | 9 | -0.056 | 0.033 | 0.037 | 0.040 |
| 76 | 11.1 | -176 | 6 | 125 | 9 | -0.006 | 0.043 | 0.044 | 0.044 |
| 76 | 11.9 | -188 | 6 | 143 | 9 | 0.034 | 0.036 | 0.024 | 0.045 |
| 76 | 12.7 | -182 | 7 | 125 | 10 | 0.020 | 0.051 | 0.043 | 0.050 |
| 76 | 13.6 | -206 | 7 | 141 | 12 | -0.081 | 0.043 | 0.127 | 0.054 |
| 76 | 14.4 | -196 | 8 | 112 | 11 | -0.024 | 0.057 | 0.083 | 0.059 |
| 76 | 15.6 | -200 | 6 | 101 | 9 | 0.023 | 0.054 | 0.090 | 0.060 |
| 76 | 17.2 | -207 | 8 | 89 | 9 | -0.013 | 0.070 | 0.083 | 0.061 |
| 76 | 18.9 | -209 | 6 | 73 | 14 | -0.035 | 0.059 | 0.009 | 0.115 |
| 76 | 20.5 | -204 | 7 | 84 | 10 | 0.015 | 0.068 | 0.045 | 0.071 |
| 76 | 22.2 | -209 | 6 | 92 | 13 | -0.063 | 0.047 | 0.013 | 0.090 |
| 76 | 23.8 | -201 | 6 | 83 | 14 | -0.082 | 0.052 | 0.016 | 0.111 |
| 76 | 25.4 | -214 | 10 | 78 | 10 | 0.009 | 0.100 | 0.033 | 0.069 |
| 76 | 27.1 | -238 | 6 | 80 | 15 | 0.078 | 0.055 | 0.011 | 0.120 |
| 76 | 28.7 | -209 | 12 | 58 | 10 | -0.004 | 0.152 | -0.033 | 0.064 |
| 76 | 30.8 | -211 | 6 | 76 | 18 | 0.036 | 0.058 | -0.008 | 0.147 |
| 76 | 33.2 | -215 | 6 | 63 | 24 | 0.052 | 0.060 | 0.004 | 0.213 |
| 76 | 36.1 | -212 | 7 | 68 | 21 | -0.059 | 0.066 | 0.015 | 0.184 |
| 76 | 39.3 | -209 | 12 | 88 | 12 | -0.000 | 0.118 | 0.038 | 0.063 |
| 76 | 43.0 | -213 | 26 | 42 | 54 | 0.018 | 0.410 | -0.006 | 0.557 |
| 76 | 47.8 | -183 | 8 | 58 | 44 | -0.019 | 0.075 | 0.019 | 0.389 |
| 76 | 55.7 | -159 | 18 | 76 | 36 | 0.067 | 0.177 | -0.058 | 0.282 |
| 164 | -19.0 | 10 | 25 | 98 | 30 | -0.015 | 0.208 | 0.021 | 0.157 |
| 164 | -14.2 | 26 | 10 | 122 | 18 | 0.107 | 0.052 | 0.001 | 0.101 |
| 164 | -11.9 | 15 | 10 | 153 | 14 | -0.039 | 0.055 | 0.077 | 0.057 |
| 164 | -10.2 | -7 | 7 | 121 | 10 | -0.005 | 0.052 | 0.025 | 0.054 |
| 164 | -9.0 | -18 | 7 | 132 | 12 | 0.045 | 0.045 | 0.035 | 0.058 |
| 164 | -8.2 | -12 | 6 | 138 | 10 | 0.014 | 0.040 | 0.141 | 0.049 |
| 164 | -7.4 | 11 | 5 | 137 | 9 | -0.071 | 0.032 | 0.140 | 0.045 |
| 164 | -6.6 | 1 | 5 | 153 | 8 | -0.024 | 0.028 | 0.088 | 0.035 |
| 164 | -5.8 | 3 | 4 | 160 | 7 | -0.076 | 0.023 | 0.081 | 0.031 |
| 164 | -5.0 | 5 | 4 | 175 | 6 | -0.041 | 0.020 | 0.092 | 0.026 |
| 164 | -4.1 | -12 | 3 | 197 | 5 | 0.039 | 0.015 | 0.081 | 0.018 |
| 164 | -3.3 | -8 | 3 | 225 | 5 | 0.026 | 0.012 | 0.088 | 0.015 |
| 164 | -2.5 | -2 | 3 | 250 | 4 | 0.007 | 0.010 | 0.062 | 0.012 |
| 164 | -1.7 | -2 | 3 | 262 | 4 | -0.010 | 0.009 | 0.066 | 0.011 |
| 164 | -0.8 | 7 | 3 | 276 | 4 | -0.005 | 0.009 | 0.062 | 0.010 |
| 164 | -0.0 | 7 | 3 | 280 | 4 | -0.003 | 0.008 | 0.082 | 0.010 |
| 164 | 0.8 | 12 | 3 | 278 | 4 | -0.007 | 0.008 | 0.083 | 0.010 |
| 164 | 1.6 | 3 | 3 | 272 | 4 | -0.011 | 0.009 | 0.097 | 0.011 |
| 164 | 2.4 | 4 | 3 | 254 | 4 | 0.003 | 0.010 | 0.081 | 0.012 |
| 164 | 3.2 | 1 | 3 | 229 | 5 | -0.010 | 0.012 | 0.078 | 0.015 |
| 164 | 4.1 | 6 | 3 | 202 | 5 | -0.030 | 0.015 | 0.035 | 0.017 |
| 164 | 4.9 | 1 | 4 | 187 | 6 | -0.018 | 0.018 | 0.079 | 0.022 |
| 164 | 5.7 | 4 | 4 | 170 | 7 | -0.003 | 0.022 | 0.085 | 0.028 |
| 164 | 6.5 | 3 | 5 | 148 | 8 | 0.025 | 0.027 | 0.111 | 0.036 |
| 164 | 7.4 | 3 | 6 | 146 | 9 | 0.001 | 0.034 | 0.072 | 0.039 |
| 164 | 8.8 | 7 | 7 | 136 | 10 | -0.002 | 0.043 | 0.051 | 0.044 |
| 164 | 9.0 | -9 | 8 | 140 | 13 | -0.087 | 0.046 | 0.076 | 0.061 |
| 164 | 10.2 | 10 | 8 | 123 | 11 | -0.034 | 0.053 | 0.092 | 0.052 |
| 164 | 11.8 | -1 | 13 | 137 | 16 | -0.018 | 0.079 | 0.050 | 0.059 |
| 164 | 14.1 | -20 | 11 | 111 | 21 | 0.088 | 0.062 | -0.009 | 0.129 |
| 164 | 19.4 | -48 | 20 | 140 | 32 | -0.080 | 0.068 | -0.016 | 0.172 |
| PA | r | VdV | d | ||
|---|---|---|---|---|---|
| ° | ″ | km s-1 | km s-1 | ||
| 76 | -19.6 | -19 | 10 | 62 | 25 |
| 76 | -17.2 | -14 | 8 | 84 | 25 |
| 76 | -14.7 | -21 | 6 | 73 | 14 |
| 76 | -12.2 | -45 | 7 | 69 | 18 |
| 76 | -9.8 | -37 | 18 | 121 | 57 |
| 76 | -7.3 | 41 | 25 | 131 | 30 |
| 76 | -4.9 | -53 | 8 | 182 | 17 |
| 76 | -3.2 | -64 | 5 | 172 | 9 |
| 76 | -2.4 | -29 | 2 | 167 | 4 |
| 76 | -1.6 | -5 | 1 | 169 | 2 |
| 76 | -0.8 | 7 | 1 | 170 | 1 |
| 76 | 0.1 | 15 | 1 | 178 | 2 |
| 76 | 0.9 | 27 | 2 | 167 | 3 |
| 76 | 1.7 | 20 | 5 | 258 | 10 |
| 76 | 3.3 | -14 | 8 | 183 | 7 |
| 76 | 5.8 | 69 | 14 | 81 | 20 |
| 76 | 8.3 | 12 | 55 | 112 | 44 |
| 76 | 10.7 | 20 | 20 | 31 | 20 |
| 76 | 18.9 | -112 | 18 | 42 | 30 |
| 164 | -39.0 | 182 | 32 | 46 | 46 |
| 164 | -33.2 | 198 | 25 | 37 | 42 |
| 164 | -27.5 | 185 | 30 | 64 | 51 |
| 164 | -21.7 | 178 | 25 | 57 | 51 |
| 164 | -17.6 | 196 | 25 | 64 | 28 |
| 164 | -15.2 | 201 | 22 | 36 | 33 |
| 164 | -12.7 | 197 | 15 | 66 | 23 |
| 164 | -10.3 | 136 | 18 | 121 | 23 |
| 164 | -7.8 | 126 | 31 | 156 | 26 |
| 164 | -6.2 | 192 | 20 | 112 | 24 |
| 164 | -5.3 | 153 | 17 | 99 | 20 |
| 164 | -4.5 | 169 | 7 | 87 | 8 |
| 164 | -3.7 | 187 | 4 | 97 | 4 |
| 164 | -2.9 | 158 | 4 | 132 | 4 |
| 164 | -2.1 | 119 | 2 | 160 | 2 |
| 164 | -1.2 | 79 | 1 | 171 | 2 |
| 164 | -0.4 | 22 | 1 | 182 | 1 |
| 164 | 0.4 | -35 | 1 | 173 | 1 |
| 164 | 1.2 | -97 | 2 | 186 | 4 |
| 164 | 2.0 | -132 | 2 | 166 | 5 |
| 164 | 2.9 | -161 | 2 | 138 | 4 |
| 164 | 3.7 | -152 | 5 | 114 | 7 |
| 164 | 5.3 | -142 | 7 | 108 | 9 |
| 164 | 7.8 | -155 | 12 | 75 | 17 |
| 164 | 10.2 | -176 | 13 | 66 | 24 |
| 164 | 12.7 | -192 | 14 | 55 | 22 |
| 164 | 15.2 | -203 | 13 | 62 | 29 |
| 164 | 18.4 | -137 | 32 | 68 | 48 |
| 164 | 25.0 | -53 | 108 | 141 | 79 |
| 164 | 34.0 | -126 | 52 | 53 | 51 |
| PA | r | Mg2 | Mg | Fe5270 | Fe5335 | ||||||
|---|---|---|---|---|---|---|---|---|---|---|---|
| ° | ″ | ÅdÅ | magdmag | ÅdÅ | ÅdÅ | ÅdÅ | |||||
| 76 | -40.6 | 1.76 | 0.18 | 0.243 | 0.005 | 3.86 | 0.17 | 2.41 | 0.19 | 3.23 | 0.20 |
| 76 | -26.3 | 2.16 | 0.14 | 0.253 | 0.003 | 4.30 | 0.13 | 2.27 | 0.14 | 2.67 | 0.15 |
| 76 | -18.7 | 1.94 | 0.12 | 0.262 | 0.003 | 4.62 | 0.12 | 2.57 | 0.13 | 2.72 | 0.14 |
| 76 | -13.0 | 1.59 | 0.12 | 0.266 | 0.003 | 4.63 | 0.11 | 2.93 | 0.12 | 2.56 | 0.13 |
| 76 | -8.9 | 1.78 | 0.11 | 0.259 | 0.003 | 4.43 | 0.11 | 2.71 | 0.12 | 2.71 | 0.13 |
| 76 | -6.0 | 1.66 | 0.09 | 0.278 | 0.003 | 4.97 | 0.10 | 3.17 | 0.11 | 2.99 | 0.12 |
| 76 | -4.0 | 1.84 | 0.09 | 0.291 | 0.003 | 5.01 | 0.09 | 3.09 | 0.10 | 3.12 | 0.12 |
| 76 | -2.8 | 1.72 | 0.10 | 0.302 | 0.003 | 5.50 | 0.11 | 3.36 | 0.12 | 3.14 | 0.14 |
| 76 | -2.0 | 1.35 | 0.10 | 0.305 | 0.003 | 5.16 | 0.11 | 3.26 | 0.12 | 3.11 | 0.14 |
| 76 | -1.2 | 1.11 | 0.10 | 0.320 | 0.003 | 5.83 | 0.10 | 3.34 | 0.11 | 3.82 | 0.14 |
| 76 | -0.4 | 1.56 | 0.10 | 0.334 | 0.003 | 5.91 | 0.11 | 3.37 | 0.12 | 3.80 | 0.15 |
| 76 | 0.4 | 0.97 | 0.11 | 0.338 | 0.003 | 5.97 | 0.12 | 3.43 | 0.12 | 3.62 | 0.16 |
| 76 | 1.3 | 1.18 | 0.11 | 0.329 | 0.003 | 6.02 | 0.12 | 3.27 | 0.12 | 3.60 | 0.15 |
| 76 | 2.1 | 1.48 | 0.11 | 0.321 | 0.003 | 5.84 | 0.11 | 3.43 | 0.12 | 3.18 | 0.14 |
| 76 | 3.0 | 1.81 | 0.11 | 0.315 | 0.003 | 5.58 | 0.12 | 3.39 | 0.12 | 3.25 | 0.14 |
| 76 | 3.7 | 1.50 | 0.11 | 0.298 | 0.003 | 5.16 | 0.12 | 3.18 | 0.12 | 3.24 | 0.14 |
| 76 | 5.0 | 1.66 | 0.10 | 0.284 | 0.003 | 4.94 | 0.10 | 3.12 | 0.10 | 3.20 | 0.12 |
| 76 | 6.9 | 1.88 | 0.10 | 0.269 | 0.003 | 4.94 | 0.10 | 2.90 | 0.10 | 2.87 | 0.12 |
| 76 | 9.8 | 1.58 | 0.10 | 0.260 | 0.003 | 4.54 | 0.11 | 2.78 | 0.11 | 3.01 | 0.13 |
| 76 | 13.8 | 2.25 | 0.10 | 0.265 | 0.004 | 4.56 | 0.12 | 2.96 | 0.11 | 2.83 | 0.13 |
| 76 | 19.6 | 2.03 | 0.10 | 0.263 | 0.004 | 4.33 | 0.12 | 2.97 | 0.11 | 2.65 | 0.13 |
| 76 | 27.2 | 1.88 | 0.11 | 0.253 | 0.004 | 4.04 | 0.13 | 2.78 | 0.12 | 2.37 | 0.14 |
| 76 | 41.5 | 1.61 | 0.13 | 0.216 | 0.005 | 3.56 | 0.17 | 2.58 | 0.15 | 2.45 | 0.19 |
| 164 | -11.9 | 2.09 | 0.16 | 0.242 | 0.007 | 4.86 | 0.23 | 2.28 | 0.30 | 2.64 | 0.28 |
| 164 | -6.2 | 1.33 | 0.07 | 0.269 | 0.003 | 4.67 | 0.09 | 2.99 | 0.11 | 2.72 | 0.11 |
| 164 | -4.0 | 1.63 | 0.06 | 0.286 | 0.003 | 5.02 | 0.09 | 2.99 | 0.11 | 2.63 | 0.11 |
| 164 | -2.8 | 1.45 | 0.06 | 0.308 | 0.003 | 5.28 | 0.10 | 3.11 | 0.12 | 3.24 | 0.12 |
| 164 | -2.0 | 1.13 | 0.06 | 0.312 | 0.003 | 5.38 | 0.10 | 3.29 | 0.12 | 3.07 | 0.12 |
| 164 | -1.2 | 1.09 | 0.07 | 0.327 | 0.003 | 5.91 | 0.10 | 3.23 | 0.12 | 3.30 | 0.13 |
| 164 | -0.3 | 0.95 | 0.07 | 0.335 | 0.003 | 5.93 | 0.11 | 3.33 | 0.13 | 3.56 | 0.14 |
| 164 | 0.5 | 1.00 | 0.08 | 0.334 | 0.003 | 5.86 | 0.11 | 3.55 | 0.14 | 3.49 | 0.14 |
| 164 | 1.4 | 1.05 | 0.08 | 0.328 | 0.003 | 5.91 | 0.11 | 3.42 | 0.13 | 3.51 | 0.14 |
| 164 | 2.1 | 1.05 | 0.08 | 0.322 | 0.003 | 5.74 | 0.11 | 3.62 | 0.13 | 3.30 | 0.14 |
| 164 | 2.9 | 1.07 | 0.08 | 0.307 | 0.003 | 5.57 | 0.11 | 3.33 | 0.13 | 3.04 | 0.13 |
| 164 | 3.8 | 1.35 | 0.09 | 0.300 | 0.003 | 5.33 | 0.12 | 3.19 | 0.14 | 3.46 | 0.14 |
| 164 | 4.9 | 1.94 | 0.08 | 0.283 | 0.003 | 4.91 | 0.11 | 2.97 | 0.13 | 3.08 | 0.12 |
| 164 | 6.9 | 1.83 | 0.08 | 0.265 | 0.003 | 4.64 | 0.11 | 3.26 | 0.13 | 2.58 | 0.12 |
| 164 | 13.5 | 4.39 | 0.23 | 0.216 | 0.008 | 5.11 | 0.28 | 2.67 | 0.34 | 1.39 | 0.32 |