SEARCH FOR NEW HEAVY NEUTRAL BOSONS DECAYING INTO A DILEPTON PAIR WITH THE CMS DETECTOR AT 8 TEV
Several theories beyond the Standard Model predict the existence of new heavy neutral bosons. Such particles could be produced in significant amounts at the LHC and their decay into a dilepton pair provides a clean signature with low background contamination. The results of the analysis of the whole 2012 dataset collected by the CMS experiment at a center of mass energy of 8 TeV are presented. No evidence for new physics is seen and upper limits on the cross section production of such particles are extracted. These results can be turned into lower limits on the mass of the heavy bosons, reaching values well above 2 TeV/c2 for many models.
1 Introduction
Many scenarios beyond the Standard Model (e.g. Grand Unification Theories , models with extra spatial dimensions ) involve new neutral bosons with masses in the TeV range. Thanks to its high energy proton beams and high integrated luminosity, the LHC could produce such particles in significant amounts to allow to detect them. The dilepton decay channel presents the advantage of a clear signature with small background contamination coming essentially from the Drell-Yan process that is the production of a dilepton pair through a photon or a Z boson (). The existence of these new particles would appear as a peak in the dilepton invariant mass spectrum . The dielectron and dimuon channels present complementary features : the former benefits from an excellent mass resolution (1-2%) while the latter is less contaminated by fakes. In the following, we focus on the dielectron channel. The whole dataset recorded by CMS at a center of mass energy of 8 TeV in year 2012 is analysed. It corresponds to an integrated luminosity of about 20 fb-1.
2 The CMS detector
The central feature of the Compact Muon Solenoid (CMS) apparatus is a superconducting solenoid of 6 m internal diameter, providing a magnetic field of 3.8 T. Within the superconducting solenoid volume are a silicon pixel and strip tracker, a lead tungstate crystal electromagnetic calorimeter (ECAL), and a brass/scintillator hadron calorimeter (HCAL). Muons are measured in gas-ionization detectors embedded in the steel return yoke outside the solenoid. Extensive forward calorimetry complements the coverage provided by the barrel and endcap detectors.
3 Event Selection
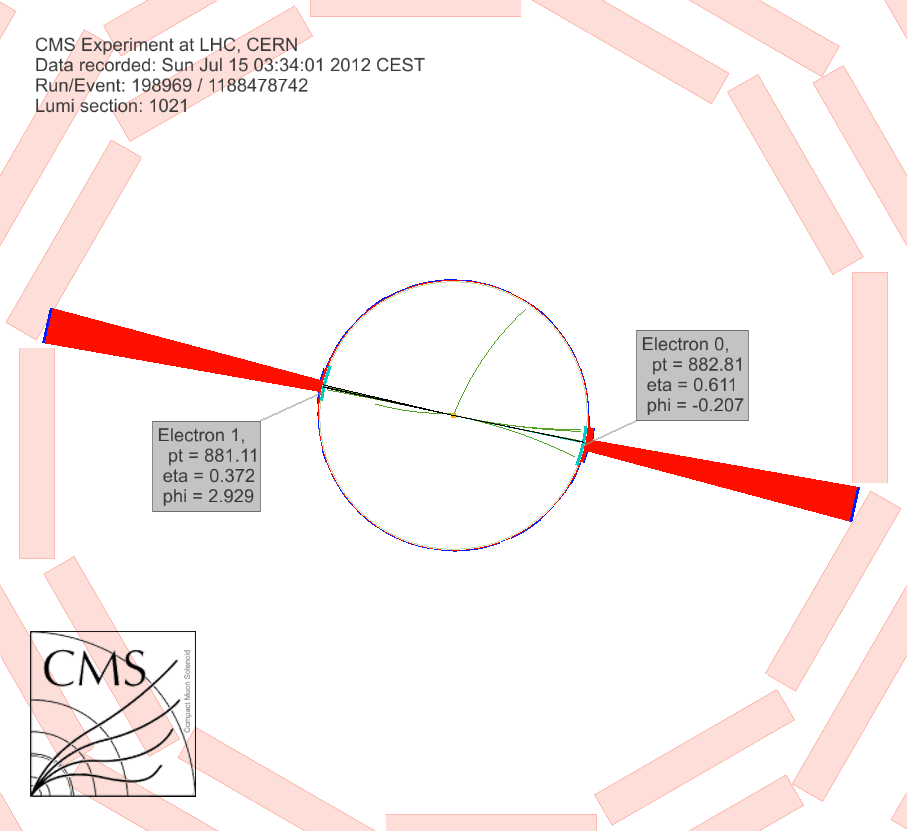
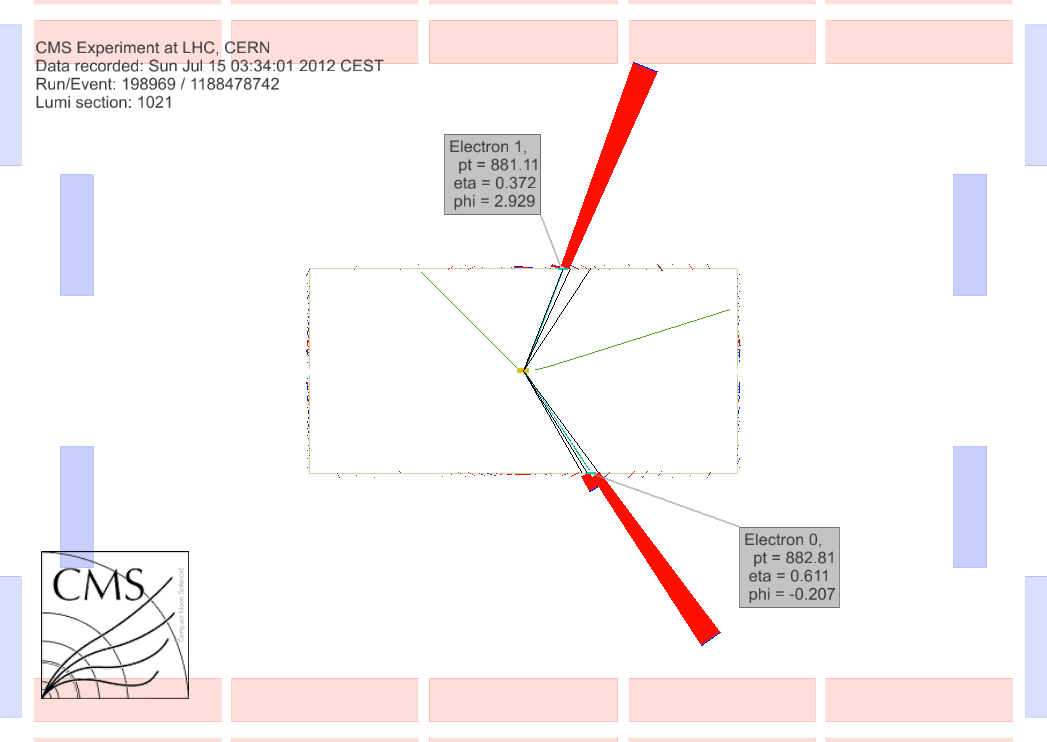
Only events with two high energy electrons candidates are selected. Identification (e.g. shower shape, ratio of energy recorded in the HCAL and ECAL) and isolation (e.g. energy deposit in the calorimeters around the electron candidate) criteria are then applied. The set of requirements for each electron constitutes the High Energy Electron Pairs selection and is specifically optimized to be very efficient for a large range of the electron transverse energy (from = 35 GeV to above 1 TeV). A view of the highest mass event recorded by CMS in 2012 is shown in figure 1.


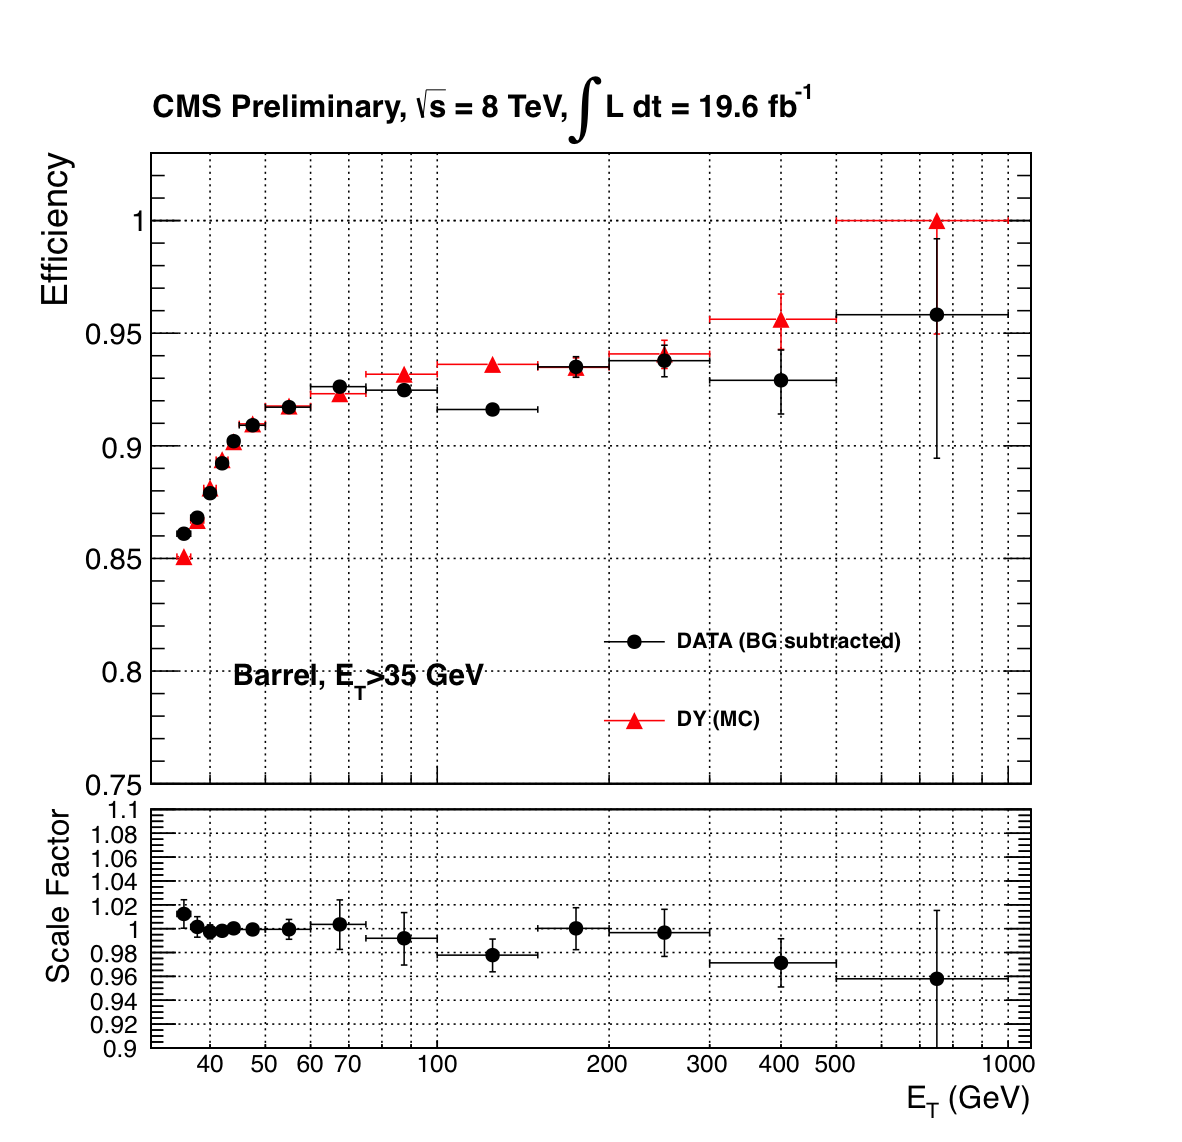
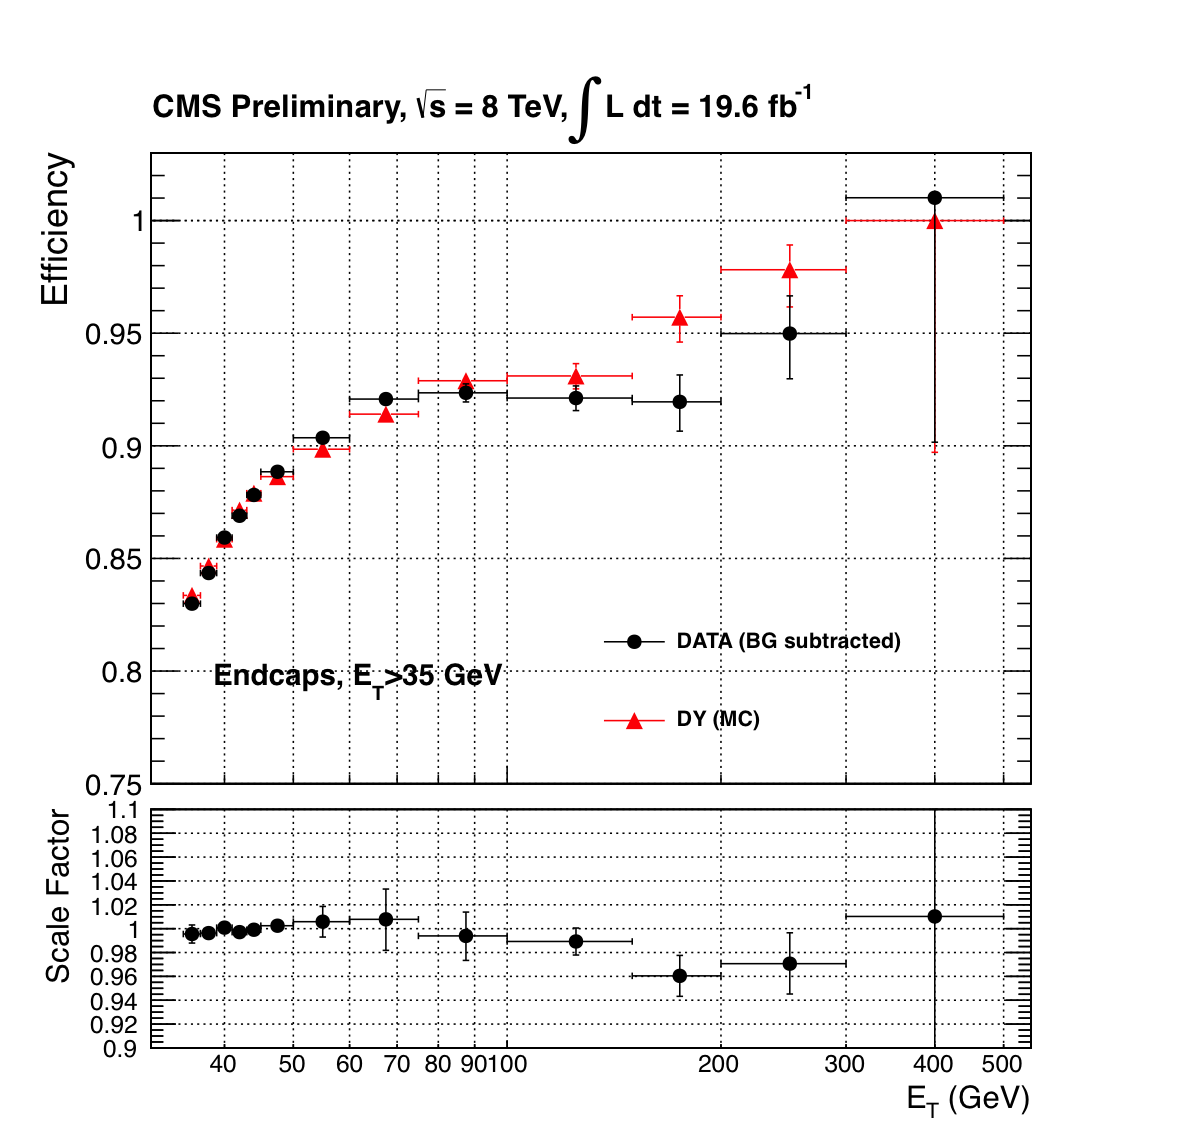
As only very few events are expected in the high dielectron mass region, the selection efficiency is taken from simulation. It is therefore crucial to check that the simulation describes well the data. This is done using the Tag and Probe method. The principle is to select events with two real electrons from the Drell-Yan process and, in order to reduce the background, strong criteria are applied on one of the electron (the Tag). The efficiency of the selection under study is then measured on the second electron (the Probe). The resulting efficiency as a function of the electron transverse energy is shown in figure 2 for events at the Z pole where large statistics is available with low background. Within the uncertainties, a good agreement is obtained up to of several hundreds of GeV.


4 Background
The main background to the signal is the Drell-Yan process, it is irreducible and is therefore estimated from simulations. The second background comes from the leptonic decay of or diboson pairs. Simulations are used to estimate its contribution and are validated by comparing in data and simulations the invariant mass spectrum of pairs (figure 3) for which those processes are dominant. After correcting for the difference in selection efficiency and acceptance between electron and muon, the number of or events from these processes is expected to be half the number of events in the spectrum. Finally, there is also a small contribution from processes where at least one jet fakes an electron in the detector (multijets, W+jets and photon+jets). This faking probability is measured directly from the data and allows to estimate the contribution to the final mass spectrum without using simulation.
The overall background estimation is checked with the data in the dielectron mass tail between 120 and 200 GeV/c2, where no new physics is expected from previous experiments.

5 Results
The final mass spectra obtained with the complete 2012 dataset are shown in figure 4 for the dielectron (left) and dimuon (right) channels. A good agreement between data and background is observed in the whole dilepton mass range.


As no evidence of new physics is seen, generic upper limits on the cross section production of new spin 1 resonances are set. The variable under study is the ratio () of the production cross section times branching ratio to two leptons for a new heavy boson and the Z boson. Results are shown in figure 5; the limits are computed using an extended unbinned likelihood function. The width of the peak is assumed to be dominated by the detector resolution and the signal pdf is taken to be a gaussian. The background shape is fitted to the background estimate in the range GeV/c2. The upper limits on the production cross section are converted into lower limits on the mass of new resonances for specific models using their predicted cross section for events in a window of 40% of the resonance mass following a theoretical prescription . The which has the same coupling than the Z boson and the predicted by E6 GUT model are excluded below 2.96 and 2.60 TeV/c2 respectively.

Acknowledgments
The author is supported by the FNRS (Belgium) and by the Belgian Science Policy office (IAP VII/37).
References
References
- [1] A. Leike, Phys. Rept. 317, 143 (1999)
- [2] L. Randall and R. Sundrum, Phys. Rev. Lett. 83, 3370 (1999)
- [3] S. D. Drell, T-M Yan, Phys. Rev. Lett. 25, 316 (1970)
- [4] The CMS Collaboration, JHEP 10, 007 (2011)
- [5] The CMS Collaboration, Public Analysis Summary, EXO-12-061
- [6] The CMS Collaboration, Phys. Lett. B 720, 63 (2013)
- [7] The CMS Collaboration, JINST 0803, 08004 (2008)
- [8] The CMS Collaboration, Public Analysis Summary, EGM-10-004
- [9] E. Accomando et al., Phys. Rev. D 83, 075012 (2011)