First high-resolution images of the Sun in the Å Mg ii k line
Abstract
We present the first high-resolution solar images in the Mg ii k Å line. The images, taken through a Å broad interference filter, were obtained during the second science flight of Sunrise in June 2013 by the SuFI instrument. The Mg ii k images display structures that look qualitatively very similar to images taken in the core of Ca ii H. The Mg ii images exhibit reversed granulation (or shock waves) in the internetwork regions of the quiet Sun, at intensity contrasts that are similar to those found in Ca ii H. Very prominent in Mg ii are bright points, both in the quiet Sun and in plage regions, particularly near disk center. These are much brighter than at other wavelengths sampled at similar resolution. Furthermore, Mg ii k images also show fibril structures associated with plage regions. Again, the fibrils are similar to those seen in Ca ii H images, but tend to be more pronounced, particularly in weak plage.
Subject headings:
Sun: chromosphere — Sun: faculae, plages — techniques: photometric1. Introduction
A good knowledge and understanding of the chromosphere is essential for making progress in the questions of chromospheric and coronal heating. Studying the chromosphere is made challenging by the fact that only few spectral lines in the visible and IR spectral ranges accessible from the ground are formed there. Of these even fewer sample the middle and upper chromosphere (He i 10830, H, Ca ii lines). Therefore, it is of considerable interest to explore further avenues. Besides lines in the vacuum ultraviolet, e.g. the Ly alpha and neutral carbon and oxygen lines, observed by e.g. SUMER (Wilhelm et al., 1995; Judge et al., 1997; Carlsson et al., 1997) or VAULT (Vourlidas et al., 2010), another source of information on the chromosphere are the h and k lines of Mg ii. These lines are expected to sample a large height range, reaching from the lower to the upper chromosphere, but observations made in these lines are rare due to their inaccessibility from ground. In the mid-1970s, space-based observations of Mg ii h&k spectra were carried out with the LPSP instrument onboard the OSO-8 mission (Bonnet et al., 1978; Kneer et al., 1981), followed in the early 1980s by observations with the Ultraviolet Spectrometer and Polarimeter (UVSP) onboard the Solar Maximum Mission (Woodgate et al., 1980). A somewhat higher spatial resolution (one or more arcsec) was reached with the 30 cm telescopes of the balloon-borne spectrograph RASOLBA (Staath & Lemaire, 1995) in 1986 as well as with the sounding-rocket experiments HRTS-9 in 1995 (Morrill et al., 2001; Morrill & Korendyke, 2008) and the Solar Ultraviolet Magnetograph Investigation (SUMI) in 2010 (West et al., 2007, 2011). Mg ii h&k spectra and slit jaw images are also being recorded with the 20 cm telescope of the Interface Region Imaging Spectrograph (IRIS; Wülser et al., 2012), which was launched on 2013 June 27, i.e. after the images discussed here were taken.
In this paper we present the first high-resolution Mg ii k images of quiet and active solar regions which were recorded with the Sunrise Filter Imager (SuFI; Gandorfer et al., 2011) during the second science flight of the balloon-borne observatory Sunrise (Solanki et al., 2010; Barthol et al., 2011) in June 2013. Its 1 m primary mirror makes Sunrise the largest solar telescope to have left Earth’s surface.
2. Observations and data reduction
The second science flight of the ballon-borne solar observatory Sunrise started on 2013 June 12 from ESRANGE near Kiruna in northern Sweden. It reached a mean float altitude of km, allowing seeing-free observations in the visible and near-ultraviolet spectral range. After a total flight time of 127 hours, the balloon landed safely in Boothia, a peninsula in northern Canada. Technical details of the 1 m aperture Gregory telescope are described by Barthol et al. (2011). Image stabilization and feature tracking were achieved by the gondola’s pointing system in conjunction with a six-element ShackHartmann correlating wavefront sensor (CWS) which controlled the telescope’s focus mechanism, and a tip/tilt mirror (Berkefeld et al., 2011).
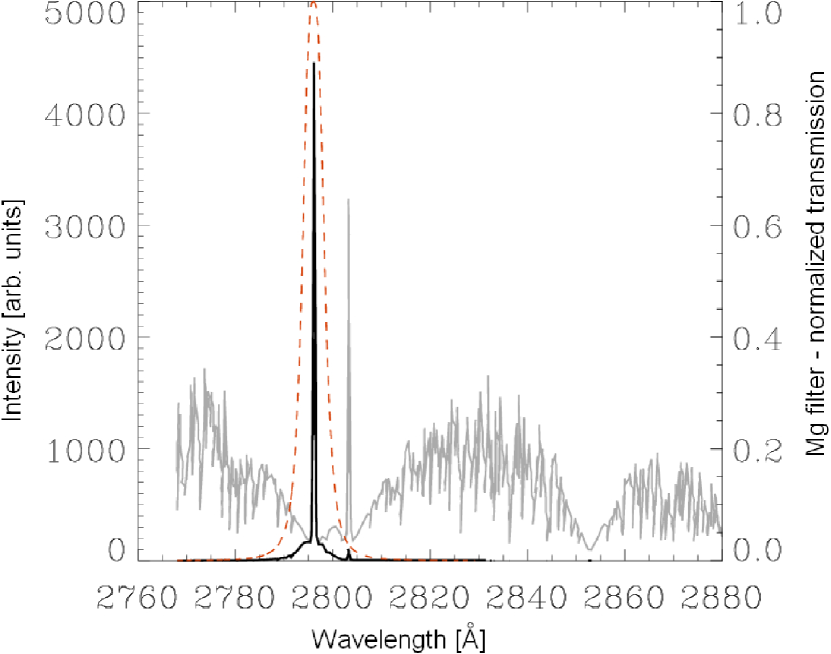
The observations presented here were taken by the Sunrise Filter Imager (SuFI; Gandorfer et al., 2011). Some of the filters from the 2009 flight, described by Gandorfer et al. (2011), were replaced to put more emphasis on the chromosphere. Of greatest interest for the purposes of the present paper is the addition of a filter with a full-width-half-maximum (FWHM) of Å centered on Å. Figure 1 displays the filter profile overplotted on the solar spectrum (average plage; Morrill et al., 2001). The filter covers the core of the Mg ii k line, but also gets a minor contribution from Mg ii h and part of the wings of the two lines, as well as some weak photospheric absorption features. Due to the strength of the emission core, this provides much of the signal in the filter, although the wings also contribute. Note that in the quiet Sun the contribution of photospheric features (reversed granulation) dominates for broad-band filters (e.g. Reardon et al., 2009; Beck et al., 2013). In plage regions the chromospheric contribution is enhanced due to the increased strength of the Mg ii h&k emission peaks.
Another important change was the inclusion of a second wavelength band centered on the core of the Ca ii H Å, in addition to the Å wide filter that already flew on the 2009 flight. The new Å wide filter gets more contribution from the H2 and H3 features.
Here we present first results from the Mg ii k channel. Further descriptions of instrumentation updates relative to the 2009 flight as well as of the flight and the full data set obtained will be given elsewhere.
The Mg ii k line lies in the Hartley absorption band of ozone, close to the maximum of absorption around Å. Even at the float altitude of Sunrise, there is sufficient stratospheric ozone to significantly attenuate the Sunlight reaching the telescope (we estimate roughly by orders of magnitude, based on the modelling by Solomon et al., 2012). To reduce the influence of this absorption, we restricted observations of Mg ii k to times around local noon, when the solar elevation was above , and scheduled ballast drops to the morning hours to ensure that the payload was at maximum altitude around local noon. Since Sunrise’s flight trajectory lay to the north of the arctic circle, the Sun’s elevation never exceeded about . Even after these measures, the Mg ii images needed to be integrated for s and the S/N rarely exceeded 25-30 in the quiet Sun.
We concentrate here on the first presentation of the Mg ii images and compare them with SuFI’s Ca ii H and Å observations. The Å filter was unchanged compared to the 2009 flight and we refer to Gandorfer et al. (2011) for further details.
SuFI is equipped with a phase-diversity (PD) prism. After the images were dark-current corrected and flat-fielded, they were PD reconstructed using individual wavefront errors (level-2 data, see Hirzberger et al., 2010, 2011, for more details). All intensity images were normalized to the intensity level of the mean quiet Sun, , defined as the average of the whole image. SuFI’s plate scale is 00207 pixel-1 and the field of view (FOV) was about 15″39″.
3. Results
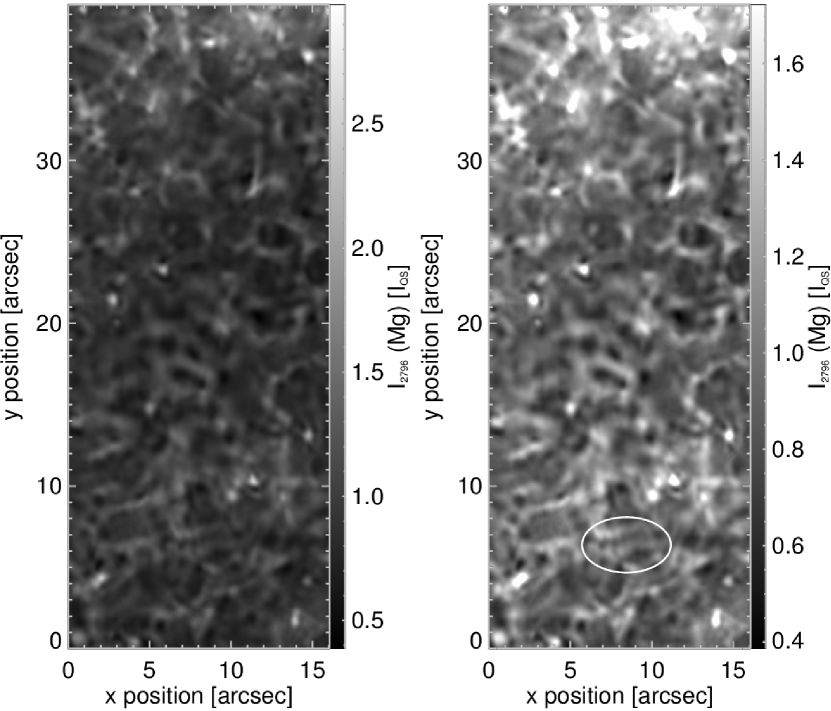
The flight altitude of on average km provided seeing-free observations, nonetheless the pointing accuracy was changing due to varying shear wind strength, so that the CWS control loop could not be closed all the time. In total we got 105 focussed Magnesium images during the 2013 flight from which we show one of the highest resolution ones obtained in a quiet part of the Sun, at solar disk center, in Figure 2. It looks qualitatively similar to high-resolution images recorded in Ca ii H, e.g. during the first Sunrise flight (Solanki et al., 2010; Jafarzadeh et al., 2013): It is criss-crossed by brightenings roughly on the granular scale. In between are bright points present at various locations in the internetwork. These appear to be similar to Ca ii H bright points (see Jafarzadeh et al., 2013, and references therein). A concentration of bright features is visible near the top of the frame in a strong network element. The resolution of the image is approximately 02. This value is deduced from both, measuring the sizes of the smallest visible structures and from the cut-off of the noise filter in the PD reconstruction, which is self-consistently computed from the data (Löfdahl & Scharmer, 1994).
This resolution, although considerably higher than previous images taken in Mg ii h or k, is below the diffraction limit. It is a priori unclear if the low resolution is mainly due to accumulated jitter during the s exposure, or if it is caused by the evolution of the chromospheric structures during the exposure. Note that gondola-jitter was largest around local noon, when the telescope was pointing upward at a slanting angle, a less stable configuration than at times when the Sun was closer to the horizon and the telescope pointed more horizontally.
The rms intensity contrast of the displayed region is 24.2%. This value is higher than the contrasts obtained by Hirzberger et al. (2010) in Ca ii H (21-22%). The comparison is not so clear-cut, however, due to the higher activity level during the 2013 flight, and possibly a difference in spatial resolution. In order to judge the effect of having an increased number and size of network features (possibly enhanced network) in the field of view of the Mg ii k data, we additionally determined the rms contrast exclusively of clearly internetwork features, e.g. the region between 12″ and 30″ in the y direction of Fig. 2. This gave a value of 19.1% which is at the lower end of the Ca ii H intensity contrasts found by Hirzberger et al. (2010), who did not explicitly exclude network features from their data. Therefore, disregarding the different filter widths for Mg ii k and Ca ii H observations, the resulting rms intensity contrasts are very similar.
The grey scale in the right panel of Figure 2 is limited to three times the rms range of the image which leads to a better visibility of reverse granulation (or possibly shock waves) that we find at the Mg wavelength. Note that in the lower part of the figure a similar structure is present as had first been noticed by Solanki et al. (2010) in Ca ii H images obtained during the 2009 flight of Sunrise: there are often 2 parallel bright stripes, between which a dark lane is located (see the encircled example). Obviously the Mg ii k line displays a similar structure. This structure may have to do with the width of the filter, since the monochromatic synthetic Mg ii images computed by Leenaarts et al. (2013a, b) do not display this feature.
We detected 42 bright points (BPs) with the manual method used by Riethmüller et al. (2010) and determined their peak intensities. The mean BP peak intensity in Mg ii k was found to be , the highest value being . These values are considerably higher than the contrasts found by Riethmüller et al. (2010) in the Ca ii H core, with an average contrast of approximately and a maximum value of . Note, however, that the Ca ii H contrasts were obtained in the broad Å filter; as we shall see below the Mg ii k images are more strongly reminiscent of the images recorded with the narrower Å Ca ii H filter. The BPs in Mg ii have a mean width of 055. This value is larger than the mean found in Ca ii images by Keys et al. (2013) (035) and 02 by Jafarzadeh et al. (2013). The latter authors restricted themselves to particularly small BPs (only those with diameters 3 were considered).
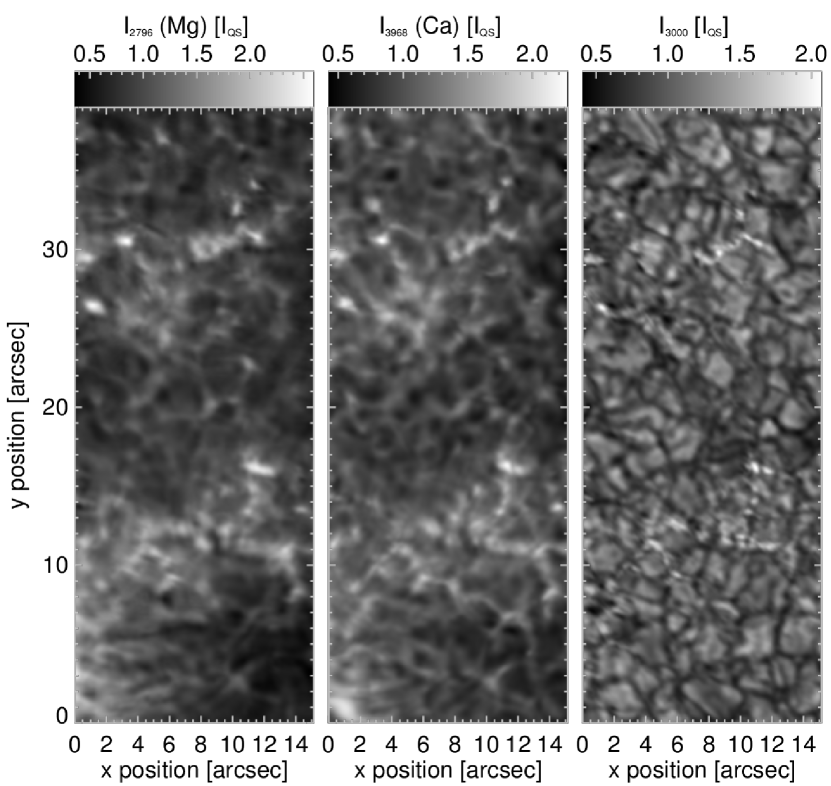
Nearly simultaneous SuFI observations at the wavelengths of Mg ii Å, the narrow ( Å) band Ca ii Å, and Å are displayed in Figure 3. The FOV exhibits, in addition to quiet granulation, two intrusions of plage around y=10″ and y=30″. While the Å wavelength is mainly formed in the deep photosphere and shows normal granulation in the quiet regions, the Mg ii Å and Ca ii Å wavelengths obviously look more chromospheric, i.e. the granulation pattern is reversed, although some of the bright structures may be signatures of shock waves. The contrast is higher and the bright features are more diffuse than in the photosphere. Furthermore, the bright features are also more diffuse in Mg ii k than in Ca ii H. In the lower part, below 10″, of the two chromospheric panels we find first stirrings of loop-like structures. These are clearly more pronounced in the Mg ii line than in Ca ii.
Since the solar scene is not totally quiet, the rms intensity contrast calculated over the entire Mg ii image, 29.8%, is distinctly higher than in Figure 2. For the Ca ii Å and Å image we find 22.5% and 20.4%, respectively. Interestingly, these last two values are not higher than what Hirzberger et al. (2010) found in the quiet Sun. For Å this is acceptable since the density of BPs is relatively low when averaged over the whole FOV. However, for Ca ii it is surprising since the wavelength band of this image is narrower than at the time of the 2009 flight. One implication may be that either the features become more diffuse at the greater heights sampled by Ca ii in the narrower filter, or that this particular image is less sharp than some of the sharpest ones from the first flight of Sunrise.
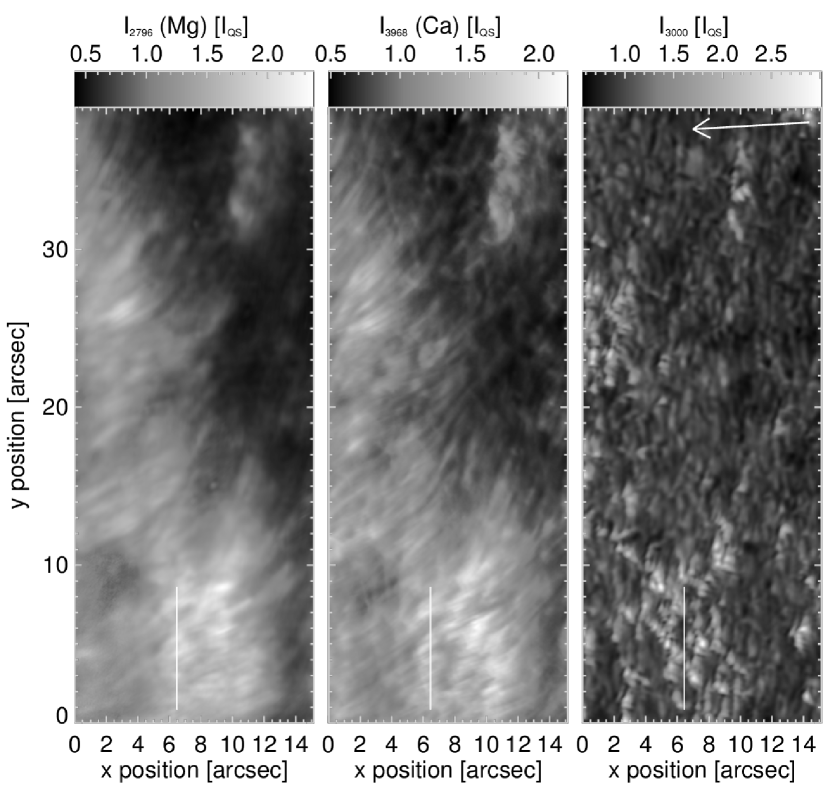
Fibrils become clearly visible when observed nearer to the limb in regions of high magnetic activity. This is displayed in Fig. 4, in which a part of AR11768 is depicted, observed at . The field-of-view was located between the main sunspots of the active region. While the photospheric Å image shows numerous faculae that are typical of active regions at higher heliocentric angles, the two chromospheric images clearly reveal a forest of bright chromospheric fibrils. The fibrils in this figure are more diffuse in Mg ii than in Ca ii as demonstrated by the intensity cuts across fibrils in Fig. 5. Note that the structure along the fibrils (e.g. due to finite length of the fibrils) looks rather similar in both the Mg ii and Ca ii.

4. Discussion and conclusions
We have presented the first high-resolution images of the solar atmosphere taken in the Mg ii k line. These were obtained with the SuFI instrument on the Sunrise balloon-borne solar observatory during its second science flight that took place on 12-17 June 2013. The atmospheric absorption by stratospheric ozone is still very strong, even at altitudes above km, so that long integration times were needed, and only images with relatively low S/N were obtained.
The images display a pattern that may be due to reversed granulation or shock waves in the quiet-Sun internetwork, very similar to interference-filter images taken in the core of Ca ii H. Figure 3 of Leenaarts et al. (2013b), who computed the Mg ii h&k lines in a snapshot from a radiation MHD simulation carried out with the Bifrost code (Gudiksen et al., 2011), displays such a pattern at the Mg ii k2v and k2r wavelengths, but not in the Mg ii k3 image. This suggests that the Sunrise/SuFI Mg ii k filter samples the k2 peaks much more than k3, which is not surprising given the greater strength of the peaks and their larger spectral coverage.
The rms contrast in Mg ii k of these very quiet regions is 19.1%, obtained after masking out network areas in quiet Sun images. This is very close to the rms contrast of the quiet Sun obtained by Hirzberger et al. (2010) in Ca ii H, also with Sunrise/SuFI during its first science flight in 2009.
At disk center Mg ii k also shows bright points at the same locations at which such features are seen in the photospheric Å line and in the core of Ca ii H. These BPs are considerably brighter in Mg ii than at other wavelengths. Mg ii k provides a mean contrast of , which is considerably higher than the values of and found by Riethmüller et al. (2010) in Ca ii H and at Å, respectively, the two wavelengths displaying the largest BP contrasts during the first Sunrise flight. This makes the Mg ii k line very promising for identifying and tracking small-scale magnetic features, although the structures may be more diffuse than at photospheric heights (see below). Note, however, that the computations of Leenaarts et al. (2013b), do not display any particular brightening at the footpoints of the emerging bipole in k2v and k2r. One of the footpoints is bright in k3, but the picture is quite different from the observations. We speculate that the difference has to do with the width of the SuFI filter, which samples also considerable portions of the inner wings of the Mg ii k line. These are formed mainly in the upper photosphere, where kilo-Gauss magnetic features appear as bright point-like structures.
The Mg images also display fibrils emanating from plage regions. The presence of such fibrils had been predicted by Leenaarts et al. (2013a, b). Not unexpectedly, the density of fibrils increases very strongly from k2v and k2r to k3. The density of fibrils in our images is closer to that in k2v and k2r, although only a very qualitative comparison can be carried out, since we find that the density of fibrils depends very strongly on the magnetic activity level (i.e. on how strong the plage is). This is in line with the behaviour of Ca ii H. Also, possibly the fibril density is larger closer to the limb (this will have to be studied in future investigations). At disk center the fibrils seen in Mg ii are more pronounced than in Ca ii H (see, e.g. Pietarila et al., 2009, for a study of the fibrils seen in Ca ii H).
Features in Mg ii k are more diffuse than in Ca ii H. E.g., the BPs have an average size of 055, which is significantly larger than in Ca ii (Keys et al., 2013; Jafarzadeh et al., 2013). We expect the following possible reasons for this: because a) Mg ii is formed higher in the chromosphere than Ca ii (Leenaarts et al., 2013a) or b) because of the much longer exposure time of Mg ii images, which allows the features to evolve during the exposure, or c) due to residual jitter not completely compensated by the image stabilization system. A study of these causes as well as a more detailed and quantitative comparison between Mg ii and Ca ii will be the topic of a separate paper (Danilovic et al. in preparation).
In summary, a very first analysis of some of the images recorded by Sunrise during its 2013 flight has shown that observations of the Mg ii k line with a Å interference filter provide a qualitatively similar picture as obtained from the narrowest interference filter observations of the Ca ii H line core. However, there are considerable quantitative differences, partly due to the different formation of the lines, partly due to observing constraints. It will be interesting to continue such an analysis using data from both Sunrise and the IRIS mission.
References
- Barthol et al. (2011) Barthol, P., Gandorfer, A., Solanki, S. K., Schüssler, M., Chares, B., et al. 2011, Sol. Phys., 268, 1
- Beck et al. (2013) Beck, C., Rezaei, R., & Puschmann, K. G. 2013, A&A, 556, A127
- Berkefeld et al. (2011) Berkefeld, T., Schmidt, W., Soltau, D., Bell, A., Doerr, H. P., et al. 2011, Sol. Phys., 268, 103
- Bonnet et al. (1978) Bonnet, R. M., Lemaire, P., Vial, J. C., Artzner, G., Gouttebroze, P., et al. 1978, ApJ, 221, 1032
- Carlsson et al. (1997) Carlsson, M., Judge, P. G., & Wilhelm, K. 1997, ApJ, 486, L63
- Gandorfer et al. (2011) Gandorfer, A., Grauf, B., Barthol, P., Riethmüller, T. L., Solanki, S. K., et al. 2011, Sol. Phys., 268, 35
- Gudiksen et al. (2011) Gudiksen, B. V., Carlsson, M., Hansteen, V. H., Hayek, W., Leenaarts, J., et al. 2011, A&A, 531, A154
- Hirzberger et al. (2010) Hirzberger, J., Feller, A., Riethmüller, T. L., Schüssler, M., Borrero, J. M., et al. 2010, ApJ, 723, L154
- Hirzberger et al. (2011) Hirzberger, J., Feller, A., Riethmüller, T. L., Gandorfer, A., & Solanki, S. K. 2011, A&A, 529, A132
- Judge et al. (1997) Judge, P., Carlsson, M., & Wilhelm, K. 1997, ApJ, 490, L195
- Jafarzadeh et al. (2013) Jafarzadeh, S., Solanki, S. K., Feller, A., et al. 2013, A&A, 549, A116
- Keys et al. (2013) Keys, P. H., Mathioudakis, M., Jess, D. B., et al. 2013, MNRAS, 428, 3220
- Kneer et al. (1981) Kneer, F., Scharmer, G., Mattig, W., Wyller, A., Artzner, G., et al. 1981, Sol. Phys., 69, 289
- Leenaarts et al. (2013a) Leenaarts, J., Pereira, T. M. D., Carlsson, M., Uitenbroek, H., & De Pontieu, B. 2013a, ApJ, 772, 89
- Leenaarts et al. (2013b) Leenaarts, J., Pereira, T. M. D., Carlsson, M., Uitenbroek, H., & De Pontieu, B. 2013b, ApJ, 772, 90
- Löfdahl & Scharmer (1994) Löfdahl, M. G., & Scharmer, G. B. 1994, A&AS, 107, 243
- Morrill et al. (2001) Morrill, J. S., Dere, K. P., & Korendyke, C. M. 2001, ApJ, 557, 854
- Morrill & Korendyke (2008) Morrill, J. S. & Korendyke, C. M. 2008, ApJ, 687, 646
- Pietarila et al. (2009) Pietarila, A., Hirzberger, J., Zakharov, V., & Solanki, S. K. 2009, A&A, 502, 647
- Reardon et al. (2009) Reardon, K. P., Uitenbroek, H., & Cauzzi, G. 2009, A&A, 500, 1239
- Riethmüller et al. (2010) Riethmüller, T. L., Solanki, S. K., Martínez Pillet, V., Hirzberger, J., Feller, A., et al. 2010, ApJ, 723, L169
- Solanki et al. (2010) Solanki, S. K., Barthol, P., Danilovic, S., Feller, A., Gandorfer, A., et al. 2010, ApJ, 723, L127
- Solomon et al. (2012) Solomon, S., Young, P. J., & Hassler, B. 2012, Geophys. Res. Lett., 39, 17706
- Staath & Lemaire (1995) Staath, E. & Lemaire, P. 1995, A&A, 295, 517
- Vourlidas et al. (2010) Vourlidas, A., Sanchez Andrade-Nuño, B., Landi, E., et al. 2010, Sol. Phys., 261, 53
- West et al. (2011) West, E., Cirtain, J., Kobayashi, K., Davis, J., Gary, A., & Adams, M. 2011, Proc. SPIE, 8160, 29
- West et al. (2007) West, E. A., Kobayashi, K., Davis, J. M., & Gary, G. A. 2007, Proc. SPIE, 6689, 12
- Wilhelm et al. (1995) Wilhelm, K., Curdt, W., Marsch, E., et al. 1995, Sol. Phys., 162, 189
- Woodgate et al. (1980) Woodgate, B. E., Brandt, J. C., Kalet, M. W., Kenny, P. J., Tandberg-Hanssen, E. A., et al. 1980, Sol. Phys., 65, 73
- Wülser et al. (2012) Wülser, J. P., Title, A. M., Lemen, J. R., De Pontieu, B., Kankelborg, C. C., et al. 2012, Proc. SPIE, 8443, 8