CHx adsorption (=1-4) and thermodynamic stability on the CeO2(111) surface:
A first-principles investigation
Abstract
We present an ab initio investigation of the interaction between methane, its dehydrogenated forms and the cerium oxide surface. In particular, the stoichiometric CeO2(111) surface and the one with oxygen vacancies are considered. We study the geometries, energetics and electronic structures of various configurations of these molecules adsorbed on the surface in vacuum, and we extend the analysis to realistic environmental conditions. A phase diagram of the adsorbate-surface system is constructed and relevant transition phases are analyzed in detail, showing the conditions where partial oxidation of methane can occur.
pacs:
68.43.-h, 68.47.GhI Introduction
The fuel cell technology developed in the past years has become an area of great interest, due to the high potential for the production of clean energy.Long et al. (2013); Kendrick and Slater (2013) The research in this field aims to produce more efficient materials to be used as electrodes with a high and selective catalytic activity, in order to improve the efficiency of energy production and also to reduce the operating temperature of these devices. Therefore, recently many studies have been performed in order to analyze molecule-surface interactions and surface catalytic activity of several metal oxide compounds from both an experimental and a theoretical point of view.Moussounda et al. (2007); Monnerat et al. (2001)
Cerium oxide has been considered a good candidate as an electrolyte material and an electrode support due to its desirable characteristic of storing oxygen, as well as its surface catalytic activity.Saraf et al. (2005); Kim and Maier (2004); Trovarelli (1996, 2002); Farrauto (2012) Its surfaces show activity with respect to several chemical reactions, in particular for the C-H bond cracking of the methane molecule, proving that CeO2-x acts as active center for methane oxidation. Haneda et al. (1998) This makes it a good candidate to be used as a fuel cell anode material.Laosiripojana et al. (2004); Knapp and Ziegler (2008) On the other hand, methane is the main component of natural gas and there is a keen interest to understand the mechanisms of methane oxidation, used for energy production.McIntosh and Gorte (2004); Murray et al. (1999) Direct oxidation of methane on both metal and metal-oxide surfaces has been observed, showing a very high thermodynamic efficiency limit for complete oxidation, that can reach 92.Knapp and Ziegler (2008); Odier et al. (2007); Bharadwaj and Schmidt (1995) Indeed, experiments proved that methane shows chemical activity if exposed to an atmosphere containing oxygen and that a humid environment play an important role against methane oxidation. Cullis and Willatt (1984); Ribeiro et al. (1994); Kikuchi et al. (2002) From this prospective, a systematic study of CHx adsorption on cerium oxide surfaces under realistic catalytic conditions becomes crucial to improve the efficiency of important processes in chemical industries.
Several theoretical computational studies have been carried out to study methane dissociation on CeO2 under vacuum conditions.Knapp and Ziegler (2008); Mayernick and Janik (2008) In this paper we want to examine this system when in contact with two gas reservoirs, oxygen and water vapor, by means of ab initio atomistic thermodynamics, in order to reproduce realistic environmental conditions.Stampfl (2005); Reuter and Scheffler (2002, 2003); Stampfl et al. (2002)
Using a computational Density Functional Theory (DFT) approach, in this work we provide a systematic analysis of CHx adsorption on the stoichiometric, as well as the reduced, CeO2(111) surface. We analyze the CHx fragment adsorption energies in vacuum, and describe the adsorbate-surface bonds obtained by charge distribution in the adsorption process and the electronic structures of the adsorbate-surface system. The calculated adsorption and surface energies enable us to describe the trend of the Gibbs free energy under realistic catalytic conditions as a function of the chemical potential of the oxygen and water. The analysis results in the construction of a surface phase diagram that shows the relative thermodynamic stability of each adsorbate-surface system; also, relevant transition phases can be analyzed in detail.
II Details of Methodology
II.1 DFT calculations: basis set and convergence
All calculations presented in this work are performed using the generalized gradient approximation for the exchange and correlation potential due to Perdew, Burke and Erzerhof (PBE) as implemented in the all-electron DMol3 code.Perdew et al. (1996); Delley (1990, 2000) The DMol3 method employs fast converging three-dimensional numerical integrations to calculate the matrix elements occurring in the Ritz variational method. The wave functions are expanded in terms of a double-numerical quality localized basis set with a real-space cutoff of 11 Bohr. Polarization functions and scalar-relativistic corrections are incorporated explicitly. We use (22) surface unit cells, and a vacuum region of Å, which ensures negligible interaction between periodic replicas, and an k-point mesh, yielding 10 k-points in the irreducible part of the Brillouin Zone. Further details about the use of DFT on systems containing reduced CeO2 can be found elsewhere.Fronzi et al. (2009a, b)
III Geometries and Energetics
In this section, we analyze energetics and geometries of the interaction between the CHx (=1-4) and the CeO2(111) surface with and without surface oxygen vacancies, when the CHx coverage is 0.25 ML under vacuum conditions. We start by considering the interaction of CH4 with the CeO2(111) surface. Various configurations are considered for adsorption, as reported in Tab.1, where the adsorption energies are calculated as follows:
| (1) |
where is the surface energy, the isolated molecule energy, and is the surface-adsorbate system.
| Config. | Adsorption energy (eV) |
|---|---|
| Ce | 0.07 |
| O | 0.05 |
| O2nd | 0.06 |
| VO | 0.00 |
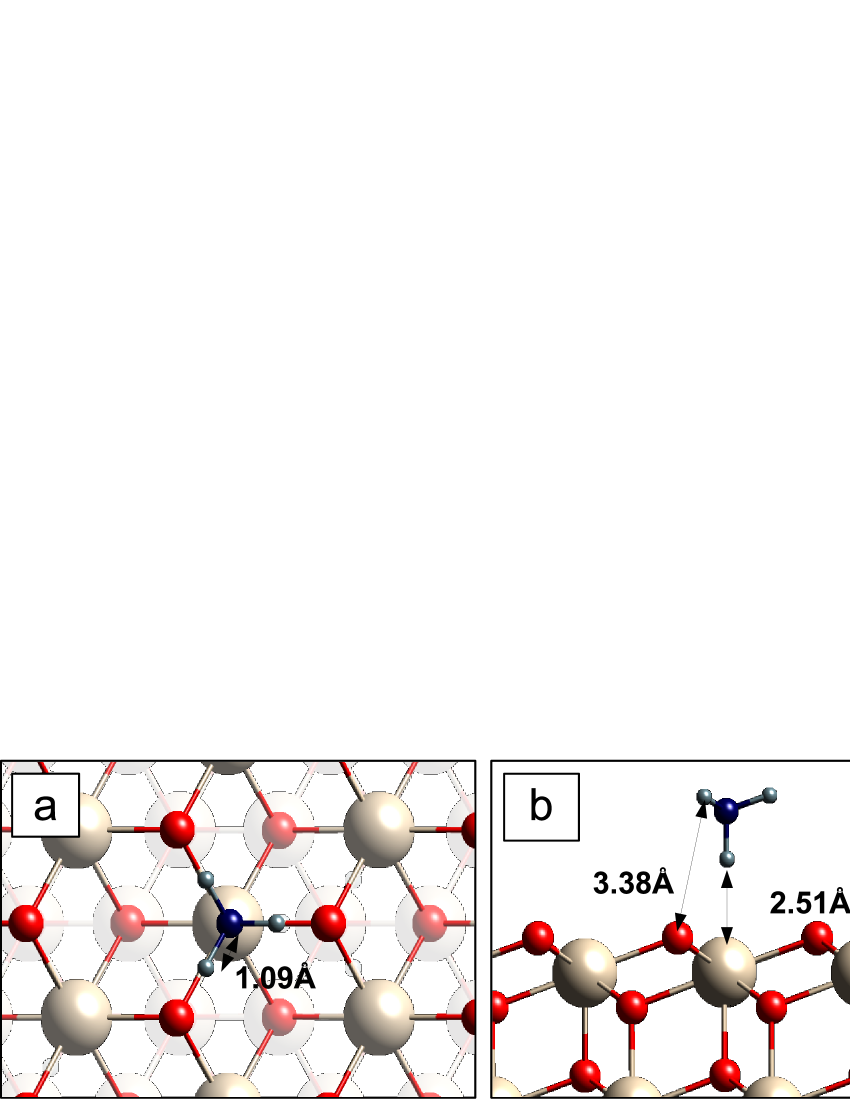
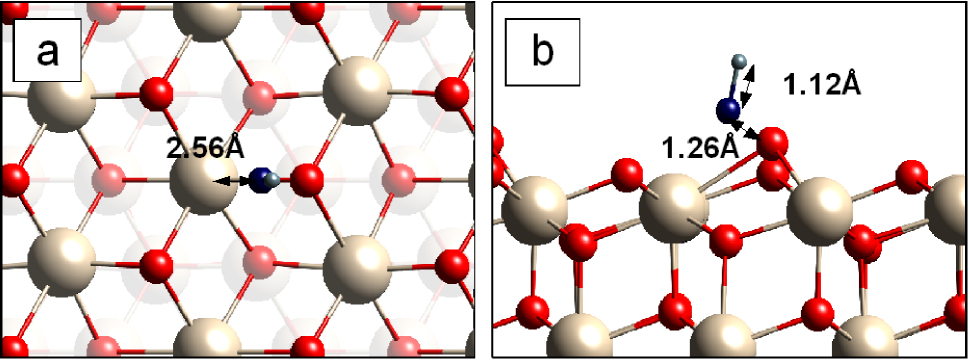
For the considered configurations, the methane molecule shows a weak interaction with the CeO2(111) surface. In the most favorable case, it adsorbs at the cerium site, with an adsorption energy of 0.07 eV. In this configuration, shown in Fig. 1, the methane molecule adsorbs on the surface with a hydrogen atom pointing to the surface cerium atom. The distance Ce-O in this case is 2.51 Å. In this case, the energy value of the adsorbate-surface bond is very small, showing an extremely weak interaction. This result is in line with other results in the literature, using both DFT and DFT+U approaches.Mayernick and Janik (2008) When an oxygen vacancy is created on the cerium oxide surface, interestingly, the interaction become repulsive. The morphology of the surface becomes therefore crucial for the first step in the methane oxidation reaction. To better analyze the nature of the interaction between CH4 and the surface cerium atom, we studied the charge density difference () induced by the adsorption of water on CeO2(111), defined as the difference between the charge density of the adsorbate system () and the sum of the isolated molecule () and the slab (), calculated as follows:
| (2) |
In this case, an extremely small charge redistribution is observed (therefore not reported here). The adsorption energy in the proximity of an oxygen vacancy shows a slightly repulsive interaction between methane molecule and surface.
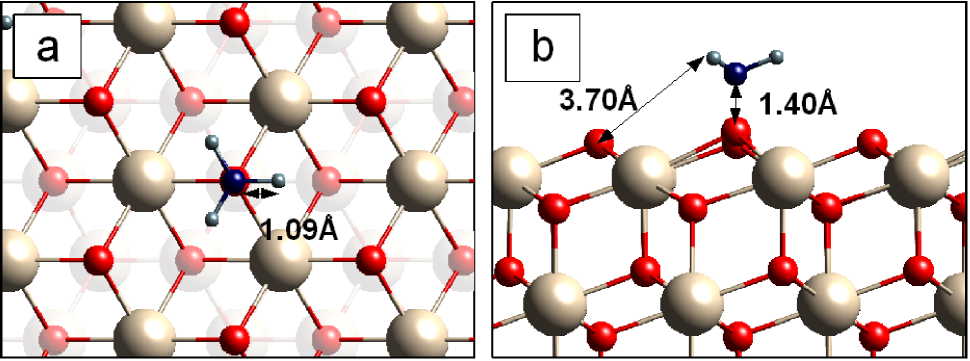
In order to obtain a first insight in the analysis of the CH4 dissociation on the CeO2(111) surface, we examine the adsorption of CHx fragments. The CH3 fragment adsorbs on the oxygen atom site with an adsorption energy of 2.09 eV, and the distance between carbon atom and surface oxygen is 1.40 Å (see Tab.2). The adsorption on the cerium atom and over the oxygen in the second layer are highly unfavored and the energy indicates a repulsive interaction. When an oxygen vacancy is created on the surface, the adsorption energy decreases to 1.80 eV, indicating a less favorable interaction between molecule and reduced surface. The induced charge density of CH3 adsorption on the CeO2(111) indicates a charge redistribution, as shown in Fig.3, which shows an evident charge transfer from the surface oxygen toward the carbon. The charge accumulation is not strongly localized, likely due to the presence of an unpaired electron of the carbon atom. However, the shared charge can be an indication of a covalent bond between the carbon atom of the fragment and the surface oxygen.
| Config. | adsorption energy |
|---|---|
| O | 2.09 |
| VO | 1.80 |
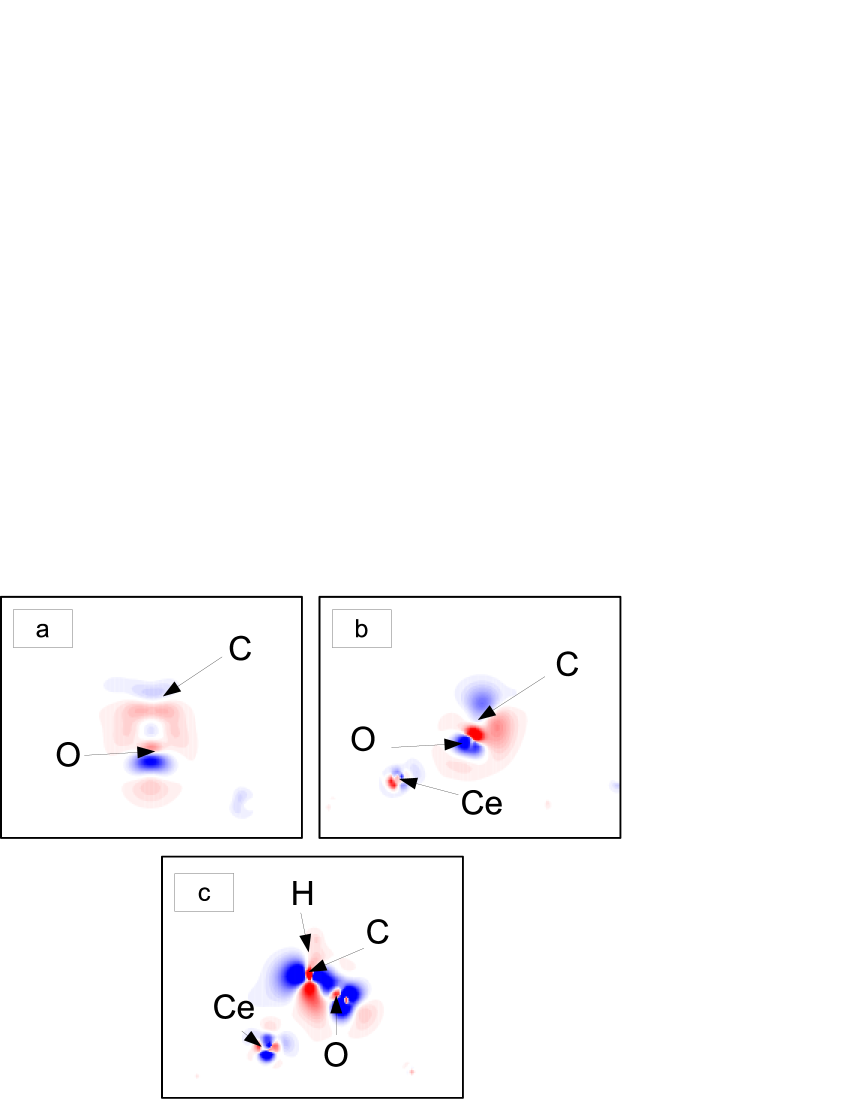
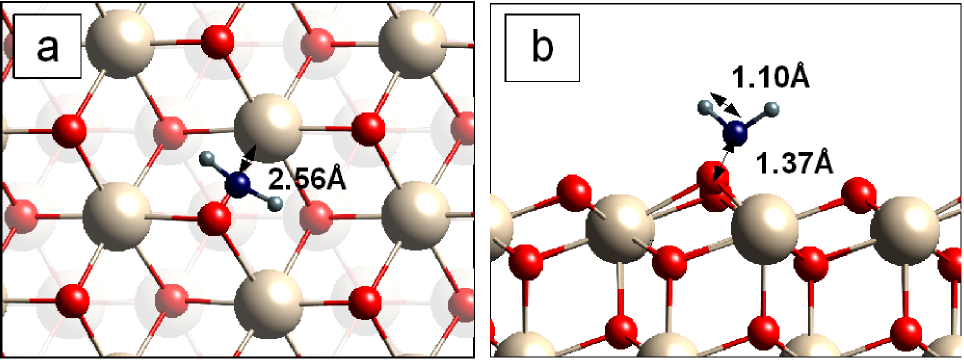
The CH2 fragment interacts strongly with the surface, having a strong adsorption energy on both the Ce and O sites (3.26 eV and 3.31 eV, respectively). Even when it adsorbs on an oxygen vacancy, the adsorption energy differs from the most stable configuration only by 9.3 of the energy bond (see Tab.3). The analysis of the induced charge density indicates an evident charge transfer from the surface oxygen to the carbon atom. The shared electron charge suggests the formation of a covalent bond.
| Config. | adsorption energy (eV) |
|---|---|
| Ce | 3.26 |
| O | 3.31 |
| VO | 3.00 |
The last fragment analyzed in this section is CH. In this case the adsorption energy is very high when it adsorbs on both the Ce and O sites (4.07 eV and 4.14 eV, respectively) and when an oxygen vacancy is created on the surface, the interaction energy decreases to 2.96 eV, indicating a strong interaction between the oxygen vacancy and the CH fragment. The induced charge density for the adsorption on the O site of CeO2(111) indicates an evident charge transfer. Figure 3 shows a charge depletion around the surface oxygen and around the carbon atom in the plane cutting the aligned C,O Ce and H atoms. To obtain information about the bond formation, more detailed three dimensional charge distribution around the carbon atom is necessary. However, the evident charge redistribution around the cerium atom suggests a possible interaction between the carbon atom and the lower lying cerium atom.
| Config. | adsorption energy (eV) |
|---|---|
| Ce | 4.07 |
| O | 4.14 |
| VO | 2.96 |
IV Energetics and thermodynamics
In this section we analyze the stability of the surfaces under the realistic environmental conditions of a humid atmosphere (H2O) containing pure oxygen gas. Each adsorbate-surface system, previously considered in a vacuum space, is now analyzed when in thermodynamic equilibrium with two independent reservoirs of oxygen gas and water in its vapor phase. We take into consideration the situation where the CeO2(111) surface has one of the CHx fragment adsorbed, and where the oxygen and water chemical potentials can hypothetically vary independently to each other within two extreme limits of poor and rich concentration. This approach allows us to calculate the energy of each surface-molecule system under every possible value of oxygen/water partial pressure. The surface free energy for each of the surface-molecule systems is calculated as follows:
| (3) |
where is the Gibbs free energy of the solid with surface area (the factor is due to the presence of two identical surfaces, one on each side of the slab); is the chemical potential of the species that depends on pressure and temperature of the system, and is number of atoms of component of the system.
The chemical potentials, , of oxygen and water vapor depend on temperature and pressure according to:
| (4) |
| (5) |
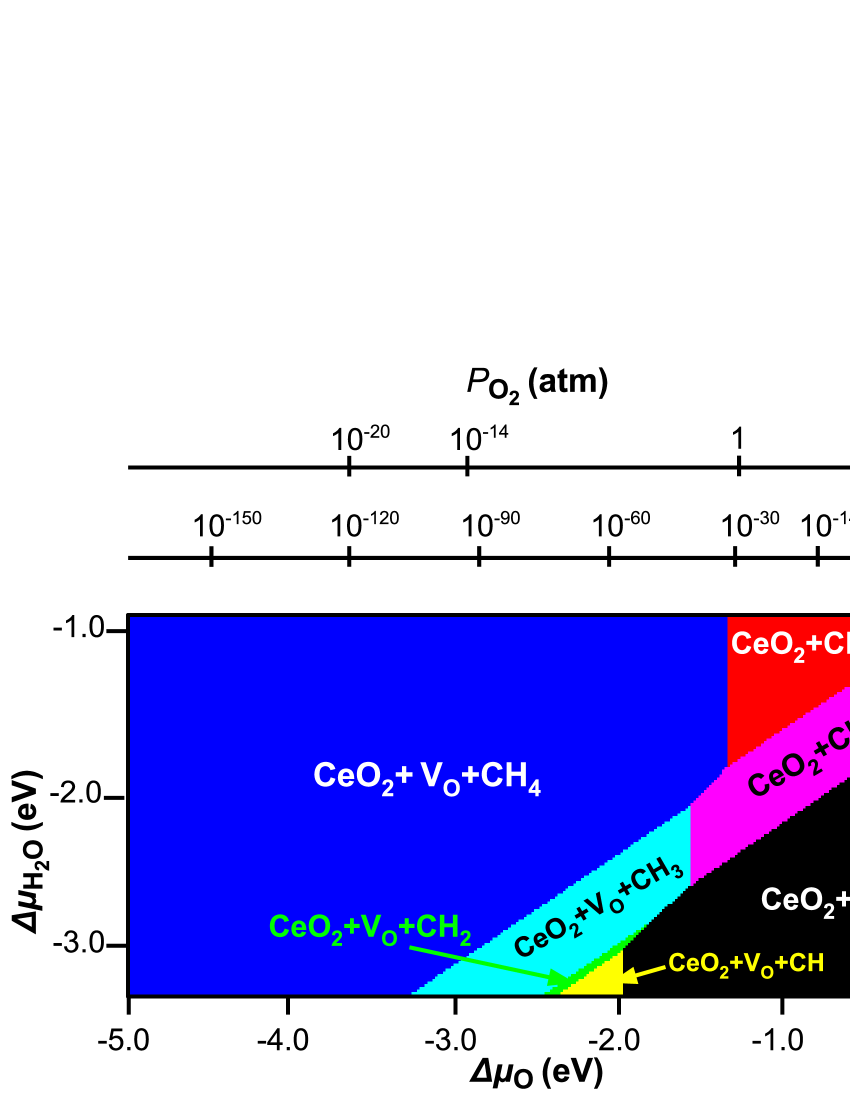
In Fig.6 these quantities are re-defined in order to have 0 eV as oxygen and water rich-limit conditions, and the plot is constructed as a function of and . For this specific system, the poor-limit conditions for the chemical potentials are eV and eV. A more detailed description of the derivation of these quantities can be found elsewhere.Fronzi et al. (2009b)
Equation 3 describes the surface free energy, for each of the surface-molecule systems, i.e. a function of the two variables and . For each value of and , the value of with lower energy is the most thermodynamically stable. Figure 6 is obtained by projecting the surface with the lowest free energy on the planes so that each colored area represents the most stable surface-molecule system for given values of the chemical potential of oxygen and water. In Fig. 6, the plot can be divided in two main areas: one including the blue and the red ones where CH4 is stable on the reduced and stoichiometric surfaces, respectively, and the rest of them where the CH4 is not stable. In these other areas CHx fragments are stable, indicating the environmental conditions where CH4 will dissociate on the CeO2(111) surface. As a general trend, for each fixed value of the partial pressure of the water plays an important role in the dehydrogenation process. In this case, the loss of one or more hydrogen atoms, and therefore the loss of one ore more electrons by the methane molecule, is equivalent to an oxidation process.
Having defined the relative stability of each system, we now can consider under which conditions relevant transition phases occur. Fixing the chemical potential of water imposing a water-rich condition (=), for an atmospheric pressure =1 atm, we find the surface to be reduced when the temperature is above 1200 K, while for =10-14, this value drops to 500 K, indicating that the pressure of the oxygen play a fundamental role in changing the critical temperature for surface reduction. Under atmospheric conditions, we can consider the partial pressure of the water vapor and oxygen to be around 1 atm. In this case the transition temperature between CeO2+CH4 and CeO2+CH3 is 750 K, while between CeO2+CH3 and CeO2+CH is 1050 K. This result suggests that a temperature above 750 K in the atmosphere is a sufficient condition for the partial oxidation of methane on the CeO2(111) surface which is in a good agreement with Haneda et al. who confirmed CeO2 to show a catalytic activity for methane oxidation at 673 K.Haneda et al. (1998) The difference could be due to the presence, supposedly small, of other facets rather then the more stable (111) in the specimen. As shown in Fig.6, there is a competing mechanism played by oxygen and water chemical potentials against methane dissociation. An increment of would result in a higher critical temperature for CH4 oxidation, while a change of would have the opposite effect. This result qualitatively confirms the effect of water on methane oxidation observed experimentally on several other materials.Cullis and Willatt (1984); Ribeiro et al. (1994)
V Electronic structure
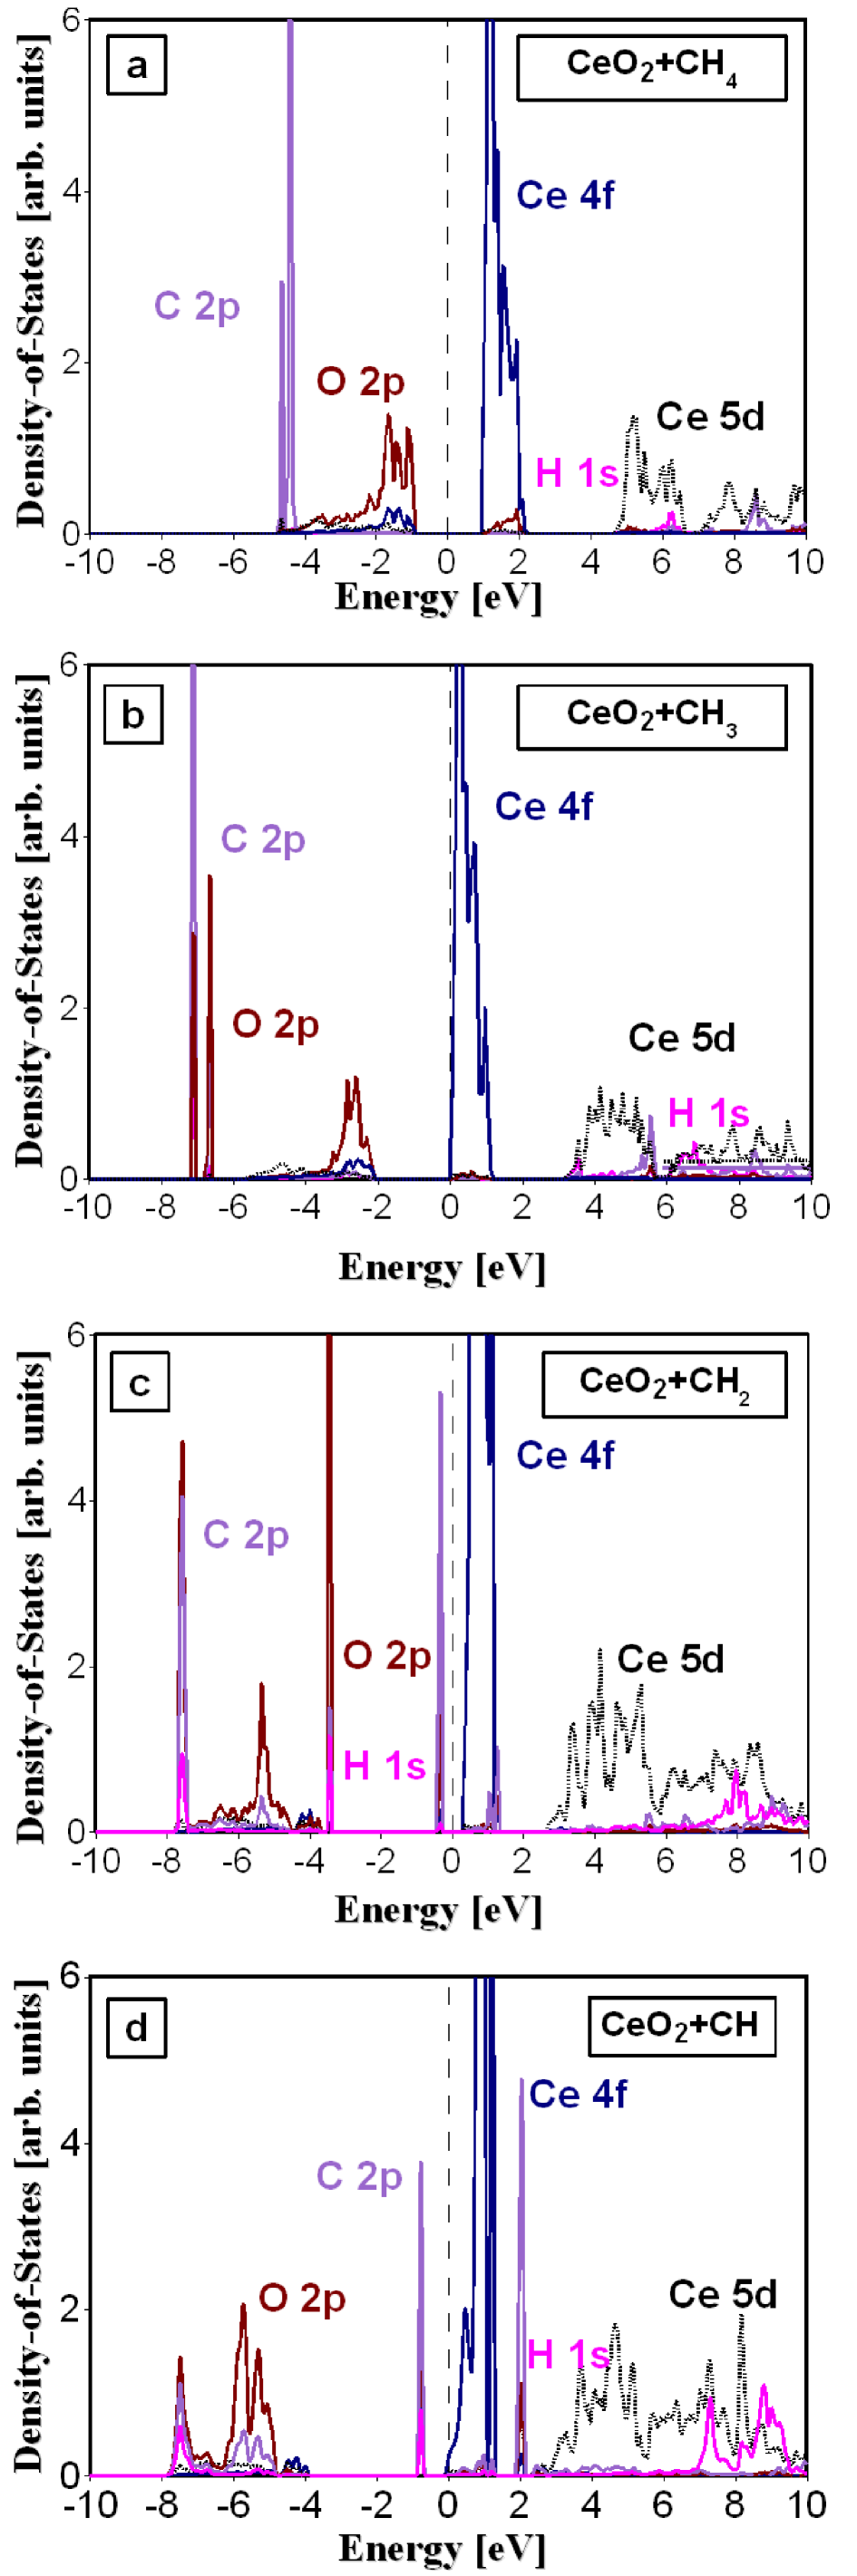
In this section, we analyze the electronic structures of the most stable surfaces identified in the previous section (Figs. 1, 2, 4 and 5).
Figure 7(a) shows the projected density-of-states (pDOS) for a stoichiometric surface with adsorbed methane molecule. There is no evidence of hybridization in the states of the carbon atom of the methane molecule and the nearest surface atoms. When focusing on the surface atoms, we observe that the CeO2(111) pDOS exhibits a strong localization of the Ce- band, typical of strongly correlated materials, centered at 1 eV, while the Ce- states are delocalized in the range of to eV. The highest occupied band is mainly derived from the state of oxygen, which has an overlap in energy with the Ce- and Ce- states in the range eV to eV. The - peaks preserve their narrow profile, indicating a molecular-like behavior.
For the case of CH3 chemisorbed on CeO2(111) (see Fig. 7(b)), the - peaks shift toward lower energies by 2 eV. The - shows a splitting in two narrow peaks and there is an evident overlapping between - and - at around 7 eV, indicating an evident surface-molecule interaction. This behavior is typical of atomic-like orbitals interacting with a narrow band, in this specific case the peak of -.Nørskov (1990) In this case, the CeO2(111) surface shows a metallic behavior. However, the occupation of the band is very low, and the energy of the surface can be considered indistinguishable to the semi-conductive surface.
When CH2 adsorbe on the surface (see Fig. 7(c)), the hybridization of the orbitals is more evident. The - band shows a further shift to 6 eV and a broadening one of the peak. There is also an evident overlapping of -, - and - at around 8 eV and 4 eV, indicating a strong interaction.
When the fragment CH is adsorbed on the surface (see Fig. 7(d)), the narrow peak of the - exhibits a broadening, typical of atomic-like orbitals interacting with a broad band.Nørskov (1990) This feature and suggests chemisorption of the adsorbate on the surface, that interacts with the band structure at surface level, consistent with the adsorption energy value previously shown. Also, in the adsorption of the CH fragment, the surface shows a metallic behavior. However, analogous considerations on the energy of the system can be done as in the case of the CH3 adsorption.
VI Summary and Conclusions
We performed DFT calculations in order to have an insight to the structure and energetics of CHx adsorption on the stoichiometric and reduced CeO2(111) surface for a coverage of 0.25 ML. Our results show that, on the stoichiometric surface, the most stable structure is the one in which methane is adsorbed on Ce. However, the adsorption energy indicate a very weak interaction. Also, we found that surface oxygen vacancies do not increase the strength of the interaction, and that adsorption energies become stronger when methane is dehydrogenated. From the surface phase diagram, constructed by employing the ab initio constrained thermodynamics approach, we studied the relevant phase transitions. Fixing the chemical potential of water and imposing a water-rich condition, when the pressure of the atmosphere is =1 atm, the reduced CeO2(111) surface is thermodynamically stable for value of temperature is above 1200 K, while for =10-14 this value drops to 500 K, indicating the fundamental role of the oxygen in determining the critical temperature for the reduction of the surface. Also, we estimated the sufficient conditions to obtain partial oxidation of the methane to be, considering the partial pressure of both water vapor and oxygen gas at 1 atm, 750 K, in good agreement with experimental results. A competing mechanism played by oxygen and water chemical potentials against methane dissociation was found, and while an increment of would result in a higher critical temperature for CH4 oxidation, a change of would have the opposite effect. This result qualitatively confirms the effect of water on methane oxidation observed experimentally on several other material surfaces.
Acknowledgements.
The authors gratefully acknowledge support from the Australian Research Council (ARC), the Australian National Computational Infrastructure (NCI) and the Australian Center for Advanced Computing and Communication (AC3). MF expresses his gratitude to Jason Gao and Irina Holca for proofreading the manuscript.References
- Long et al. (2013) N. Long, Y. Yang, C. M. Thi, and M. N.V. Minhand Y. Caoand M. Nogami, Nano Energy 2:5, 636 (2013).
- Kendrick and Slater (2013) E. Kendrick and P. R. Slater, Ann. Rep. Prog. Chem. A 109, 139 (2013).
- Moussounda et al. (2007) P. Moussounda, M. Haroun, G. Rakotovelo, and P. Légaré, Surf. Sci. 3697-3701, 601 (2007).
- Monnerat et al. (2001) B. Monnerat, L. Kiwi-Minsker, and A. Renken, Chem. Eng. Sci. 56, 633 (2001).
- Saraf et al. (2005) L. Saraf, C. M. Wang, V. Shutthanandan, Y. Zhang, O. Marina, D. Baer, S. Thevuthasan, P. Nachimuthu, and D. Lindle, J. Mat. Res. 20, 1295 (2005).
- Kim and Maier (2004) S. Kim and J. Maier, J. Eur. Ceram. Soc. 24, 1919 (2004).
- Trovarelli (1996) A. Trovarelli, Catal. Rev. Sci. 38, 439 (1996).
- Trovarelli (2002) A. Trovarelli, Catal. Sci. Series 2, 407 (2002).
- Farrauto (2012) R. J. Farrauto, Science 337, 659 (2012).
- Haneda et al. (1998) M. Haneda, T. Mizushima, and N. Kakuta, J. Phys. Chem. B 102, 6579 (1998).
- Laosiripojana et al. (2004) N. Laosiripojana, S. Assabumrungrat, and S. Charojrochkul, The Joint International Conference on Sustainable Energy and Environment (2004).
- Knapp and Ziegler (2008) D. Knapp and T. Ziegler, J. Phys. Chem. C 112, 17311 (2008).
- McIntosh and Gorte (2004) S. McIntosh and R. J. Gorte, Chem. Rev. 104, 4845 (2004).
- Murray et al. (1999) E. P. Murray, T. Tsai, and S. A. Barnett, Nature 400, 649 (1999).
- Odier et al. (2007) E. Odier, Y. Schuurman, and C. Mirodatos, Cat. Today 127, 230 (2007).
- Bharadwaj and Schmidt (1995) S. Bharadwaj and L. Schmidt, Fuel Proc. Tech. 42, 109 (1995).
- Cullis and Willatt (1984) C. F. Cullis and B. M. Willatt, J. Catal. 86, 187 (1984).
- Ribeiro et al. (1994) F. H. Ribeiro, M. Chow, and R. A. Dallabetta, J. Catal. 146, 537 (1994).
- Kikuchi et al. (2002) R. Kikuchi, S. Maeda, K. Sasaki, S. Wennerströmc, and K. Eguchi, Appl. Cat. A 232, 23 (2002).
- Mayernick and Janik (2008) A. D. Mayernick and M. J. Janik, J. Phys. Chem. C 112, 14955 (2008).
- Stampfl (2005) C. Stampfl, Catal. Today 105, 17 (2005).
- Reuter and Scheffler (2002) K. Reuter and M. Scheffler, Phys. Rev. B 65, 035406 (2002).
- Reuter and Scheffler (2003) K. Reuter and M. Scheffler, Phys. Rev. B 68, 045407 (2003).
- Stampfl et al. (2002) C. Stampfl, M. V. Ganduglia-Pirovano, K. Reuter, and M. Scheffler, Surf. Sci. 500, 368 (2002).
- Perdew et al. (1996) J. P. Perdew, K. Burke, and M. Erzerhof, Phys. Rev. Lett 77, 3865 (1996).
- Delley (1990) B. Delley, J. Chem. Phys. 92, 508 (1990).
- Delley (2000) B. Delley, J. Chem. Phys. 113, 7756 (2000).
- Fronzi et al. (2009a) M. Fronzi, A. Soon, B. Delley, E. Traversa, and C. Stampfl, J. Chem. Phys. 131, 104701 (2009a).
- Fronzi et al. (2009b) M. Fronzi, S. Piccinin, B. Delley, E. Traversa, and C. Stampfl, Phys. Chem. Chem. Phys. 11, 9188–9199 (2009b).
- Nørskov (1990) J. K. Nørskov, Rep. Prog. Phys. 53, 1253 (1990).