Refining the scaling relation with HI rotation curves of water megamaser galaxies
Abstract
Black hole - galaxy scaling relations provide information about the coevolution of supermassive black holes and their host galaxies. We compare the black hole mass - circular velocity () relation with the black hole mass - bulge stellar velocity dispersion () relation, to see whether the scaling relations can passively emerge from a large number of mergers, or require a physical mechanism, such as feedback from an active nucleus. We present VLA H I observations of five galaxies, including three water megamaser galaxies, to measure the circular velocity. Using twenty-two galaxies with dynamical measurements and measurements extending to large radius, our best-fit relation, , yields , , and intrinsic scatter . The intrinsic scatter may well be higher than 0.51, as we take great care to ascribe conservatively large observational errors. We find comparable scatter in the relations, , while pure merging scenarios would likely result in a tighter scaling with the dark halo (as traced by ) than baryonic () properties. Instead, feedback from the active nucleus may act on bulge scales to tighten the relation with respect to the relation, as observed.
1. Introduction
The observed scaling relations between supermassive black hole (BH) mass and properties of the host galaxy, intensively studied over the past decade, suggest that black hole growth is tied to the growth of the surrounding host galaxy. These galaxy properties include the bulge/spheroid stellar velocity dispersion (e.g., Ferrarese & Merritt, 2000; Tremaine et al., 2002; Gültekin et al., 2009; Beifiori et al., 2012; McConnell & Ma, 2013), the mass and luminosity of galaxy bulges (e.g., Marconi & Hunt, 2003; Häring & Rix, 2004; McConnell & Ma, 2013), and the circular velocity (e.g., Ferrarese, 2002; Kormendy & Bender, 2011; Beifiori et al., 2012), which is the rotation velocity measured at large radius to probe the dark matter halos potential. It is intriguing that these power-law relations, especially the relation, hold over several orders of magnitude in BH mass with small scatter, even though the black hole accounts for only a few thousandths of the mass of the galaxy (e.g., Häring & Rix, 2004).
There are a wide array of theories attempting to explain the BH-galaxy scaling relations (e.g., Silk & Rees, 1998; Ciotti & Ostriker, 2001; Murray et al., 2005; Hopkins et al., 2006; Peng, 2007). Two of the most popular models include variants of feedback from active galactic nuclei (AGN) and scenarios in which merging alone can lead to BH-galaxy scaling laws. In AGN feedback models, the central BH accretes mass and grows until it is massive enough to expel gas from the galaxy potential well and quench its own growth. BH growth in this picture is regulated by the depth of the galaxy potential well (Silk & Rees, 1998; Fabian, 1999; Di Matteo et al., 2005; Robertson et al., 2006). On the other hand, the pure merging scenario suggests that the correlation between linear quantities, for example the BH mass and the halo mass , can emerge from a large number of mergers based on the central limit theorem, even without a physical mechanism linking the two (Peng, 2007; Hirschmann et al., 2010a; Jahnke & Macciò, 2011).
Although both the feedback and merging phenomena may occur in galaxy evolution, it is unclear whether either of the mechanisms is essential in establishing the scaling relations. The most important physical scale for feedback is also a matter of debate (Booth & Schaye, 2010a; Debuhr et al., 2010). Furthermore, we do not know how the AGN output couples to the gas, whether via thermal energy (Silk & Rees, 1998) or momentum (Ostriker et al., 2010), nor do we know the average efficiency of the feedback.
Therefore, empirical evidence that distinguishes the relative importance of different physical processes in establishing the scaling relations is key to constructing the coevolution history of black holes and galaxies. In this paper, we investigate the origin of BH-galaxy scaling relations by comparing the relation to the relation. Circular velocity is a good indicator of dark matter halo mass, and velocity dispersion serves as its counterpart on bulge scales. While some AGN feedback scenarios (e.g., Debuhr et al., 2010) suggest that BH mass will be most tightly linked to baryons (as opposed to dark matter), a pure merging scenario suggests that the (or ) relation should be the cleanest and tightest relation, as it is free from the baryonic physics (e.g., star formation) that occurs during merging. Comparison of the two relations, especially their scatter, can help determine the mechanism that drives BH-galaxy coevolution (Ferrarese, 2002; Novak et al., 2006; Kormendy & Bender, 2011).
Ferrarese (2002) first proposed that BH mass may correlate with dark matter halo mass, based on the relation and the correlation between and . Later, a number of papers (Pizzella et al., 2005; Courteau et al., 2007; Ho, 2007) pointed out that the relation depends on surface brightness, light concentration, and morphology, and suggested that the relation, not the relation, is most fundamental. Kormendy & Bender (2011) compiled a sample of 25 galaxies with both dynamical BH mass measurements and from spatially resolved rotation curves. From this direct correlation they concluded that the dark matter halo mass alone cannot determine the BH mass, given that the BH mass can range from at a circular velocity of (for a different view see Volonteri et al., 2011). Beifiori et al. (2012) also found the scatter in the relation to be about twice as large as that in the relation using a large sample of upper limits from Hubble Space Telescope spectra (Beifiori et al., 2009) and from unresolved H I line-width measurements. For a comprehensive review, see Kormendy & Ho (2013).
In this work, we aim to refine the statistics. We start with the most up-to-date galaxy sample with dynamically measured black hole masses, and study all of these that also have spatially resolved circular velocity measurements, predominantly disk galaxies observed with H I. We present five new H I rotation curves measured with the Karl G. Jansky Very Large Array111Operated by The National Radio Astronomy Observatory, a facility of the National Science Foundation operated under cooperative agreement by Associated Universities, Inc. (VLA) during the Expanded Very Large Array (EVLA) construction period. Three of these galaxies have dynamical measured from the kinematics of water megamasers in sub-pc disks (Reid et al., 2009; Greene et al., 2010; Kuo et al., 2011). With BH mass errors smaller than 11 percent, these megamaser measurements are especially useful in constraining the intrinsic scatter of the relations. In total our sample contains thirty-three galaxies. We assign to all galaxies in a consistent way and investigate reliability as a function of the spatial extension of the rotation curve. Using only reliable measurements at large radius, we quantify the correlation and compare it with the relation. We investigate whether is correlated more tightly with or , to discriminate AGN feedback scenarios from those in which merging alone establishes the scaling relations.
2. H I Observations
We observed 5 spiral galaxies in H I with the VLA. The observations were taken in the L-band and the C configuration under project 10B220 between October and December 2010 (for details see Table 1). The observations used dual circular polarizations and a single spectral window with 256 channels across the 4MHz (852 km s-1) bandwidth, giving a channel width of . Twenty-one edge channels on each side were flagged due to a higher noise level. Removing these channels did not affect our results since none of the sources had emission in these parts of the band. The full width at half power of the primary beam is , and the synthesized beam size ranges from to depending on the source declination and number of antennas used (Table 2).
The duration of each observation was 5 hours and the on-source time was minutes per source. During a track, the gain calibrator was observed for minutes every minutes, while the flux calibrator was observed once, for minutes. The observations were carried out during the EVLA upgrade phase and some of the L-band receivers were not yet installed. For the observations of NGC 1194, NGC 2748, and UGC 3789, four antennas were not in the array, three were missing during the NGC 7582 observations, and two during the NGC 2960 track. One additional antenna was flagged out of the data set for NGC 1194, NGC 2748, NGC 7582, and UGC 3789 for high noise levels. The total number of antennas used was between 22 and 25, as listed in Table 1. Radio Frequency Interference (RFI) was found in three observations, and the contaminated data were excluded, which accounts for only a few percent of the data.
Data calibration and image processing were carried out with the Common Astronomical Software Applications (CASA) package. Time averaging of 10 seconds and on-line flagging were applied before calibration. The amplitude loss due to time averaging is less than 1 according to the VLA Observational Status Summary. The antenna position correction, antenna-based delays, bandpass, phase gain, amplitude gain and flux scale calibrations were carried out consecutively. The minimum acceptable signal-to-noise ratio (SNR) for the bandpass and gain calibration tables were all set to 3. The bandpass solutions were solved for each channel, which gave stable solutions with amplitude variations . The phase gain and amplitude gain were solved for each calibrator scan. Gain elevation curves were applied to correct for elevation-dependent amplitude gain due to antenna deformation. Data weighting was not used throughout the calibration process, since the VLA does not monitor system temperature. The two polarizations were calibrated separately and combined in the imaging process.
For the H I emission line analysis, the continuum was estimated from line-free channels with more than 20 channels on each side and subtracted in the plane with the task . A constant continuum level was used for all galaxies but NGC 1194 and NGC 2960. In these two galaxies, an adapted linear spectrum was used in order to subtract a nearby bright source with an inclined spectrum. The nearby bright continuum sources were well-subtracted at this stage, and the contamination from their side-lobes was negligible.
For imaging we used the CASA task in mode. This mode corrects for the doppler shift due to rotation of the Earth. In this process the channels were also regridded linearly into wider spectral bins - the image planes. The width of the image planes were chosen to be 10 km s-1 for higher signal-to-noise (SNR) observations (NGC 2748 and NGC 7582), and 20 km s-1 for lower SNR observations (NGC 1194, NGC 2960, and UGC 3789). The SNR ratios for each data cube, defined as the peak intensity per channel divided by the RMS noise, are listed in Table 2. For NGC 2748 and NGC 7582 we applied Briggs weighting with the parameter robust set to 0.5, and natural weighting was applied for NGC 1194, NGC 2960, and UGC 3789. All images were cleaned to the 3 level. All velocities in this paper use the optical convention and the Local Standard of Rest Kinematic (LSRK) reference frame. Position angles (P.A.) in this paper are measured east of north.
3. Analysis
In this section we describe the procedures that we used to extract velocity fields from the H I data cubes and measure rotation curves and . The H I properties of individual galaxies are discussed in Appendix A.
3.1. Non-parametric moment-0 and moment-1 maps
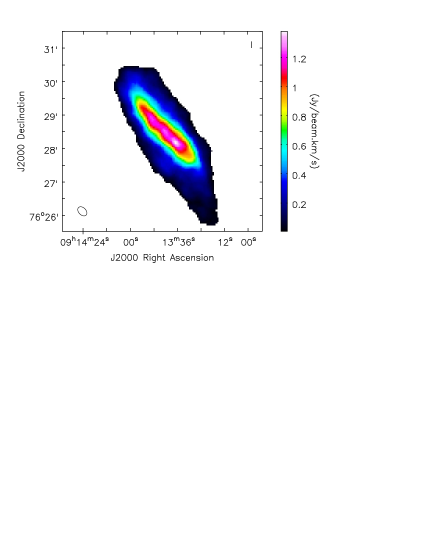
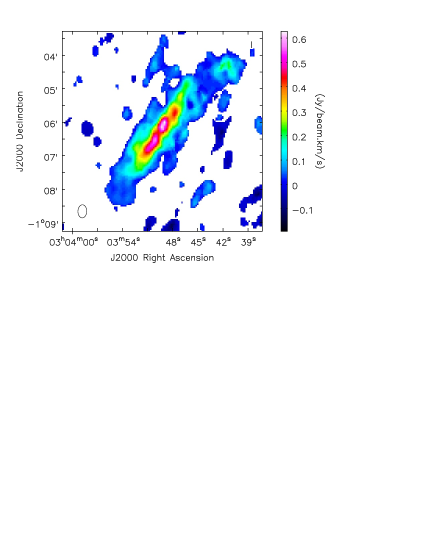
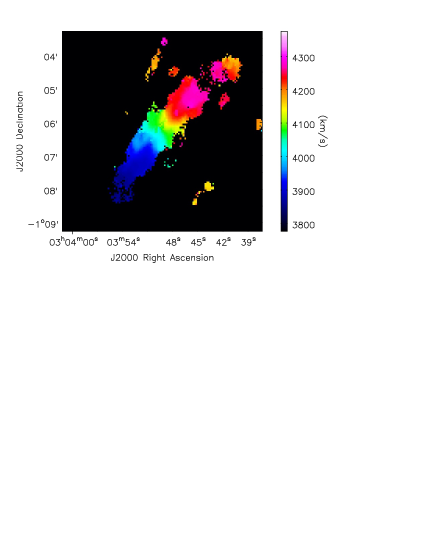
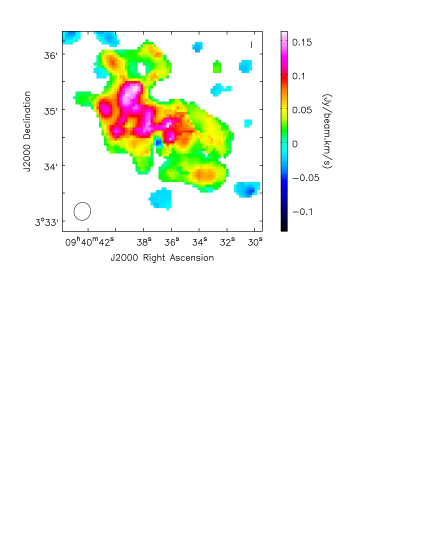
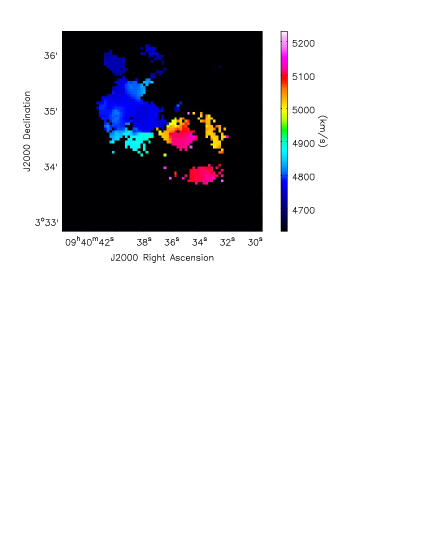
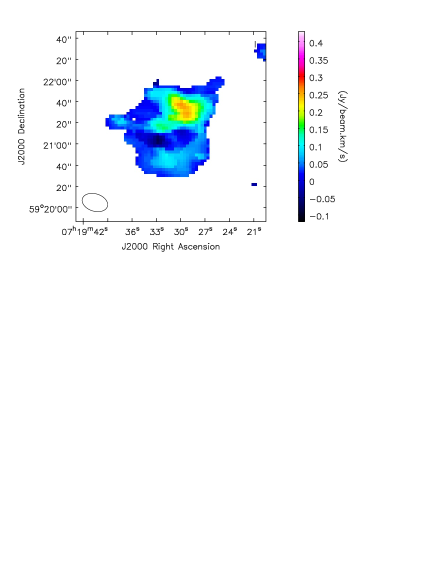
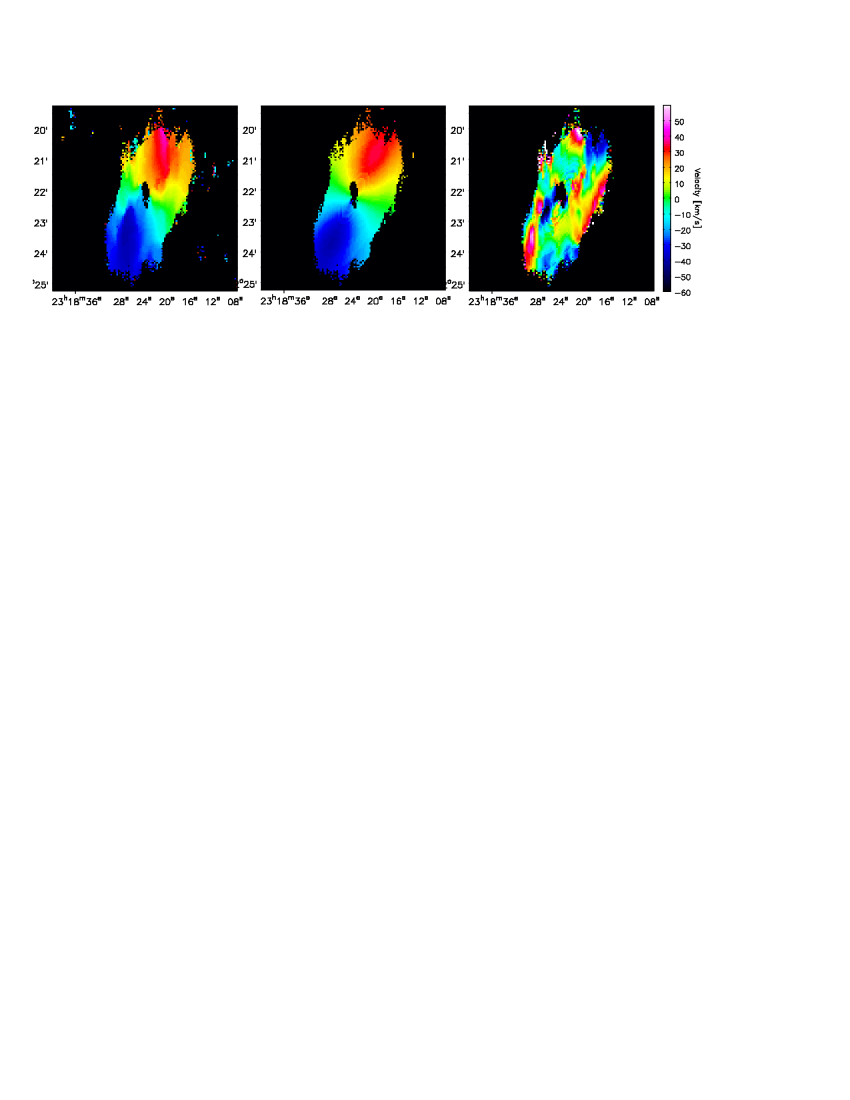
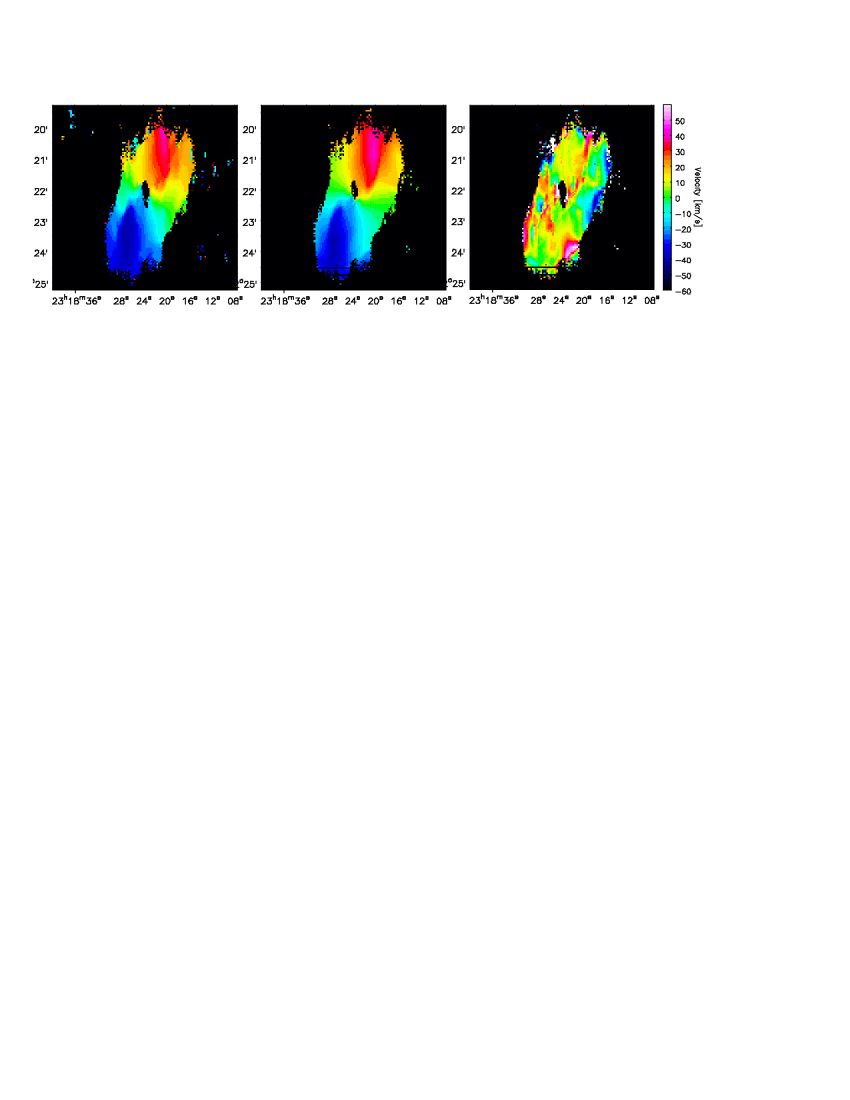
Non-parametric integrated intensity moment-0 maps of the five galaxies are shown in the left columns of Figures 1 to 5. In order to improve the SNR, we used the CASA tool image.moments, which masked pixels with no signal in producing the moment maps. The masks were produced as follows: the data cube was first smoothed spatially over one beam and spectrally over two image planes ( for NGC 2748 and NGC 7582; for NGC 1194, NGC 2960, and UGC 3789). Then, pixels with smoothed intensity below a certain threshold were masked. The threshold was set to 3 for NGC 2748, NGC 7582, and NGC 1194, and 2.5 for NGC 2960 and UGC 3789, chosen to optimize the signal seen in the moment-0 maps.
3.2. Parametric Fitted Velocity Fields
To extract rotation curves from the H I data cube, it is conventional to fit a velocity-field model. The two-dimensional velocity-field model is parametrized by geometrical parameters and the rotation curve. Then, the model is fit to the two-dimensional velocity-field data derived from the 3-D data cube. To construct the velocity field, one assigns a representative velocity to each spectrum in the data cube. In the ideal case of a simple rotating disk with small random motions, the projected rotational velocity will correspond to the peak velocity in the spectrum. In practice there are different ways to measure the velocity at each position, including the peak velocity, the intensity-weighted mean velocity, and parametrized fitting (e.g., Gaussian fitting, deBlok et al., 2008). We seek the velocity measure that can best recover the true projected rotation velocity in the case of finite resolution, sensitivity, disk warping and overlapping velocities along the line of sight.
Measuring the peak velocity is the most straightforward approach, but the measurement is sensitive to the noise. It may pick up a noise spike instead of the real signal when the SNR is low. Moreover, it is discretized to the velocity channel width, which is 10 or 20 km s-1 in our case. The intensity-weighted mean (moment-1) velocity is less sensitive to the noise, but will be biased if the spectrum is not symmetric. For example, beam smearing will produce a wing towards the systemic velocity, causing the intensity-weighted mean velocity to be skewed towards lower values (see the left panel of Fig. 6).
Another alternative is parametrized fitting, such as with a Gaussian line profile. The Gaussian fit picks up the intensity peak if the line profile is symmetric, and it is not as sensitive to the noise as is the peak velocity, so Gaussian fitting is our preferred approach. However, at high SNR if the line shape is asymmetric, then the mean velocity of the best-fit Gaussian profile will be biased toward the wing (see the right panel of Figure 6). In this case, we can use a Gauss-Hermite expansion to capture the non-Guassian line shape (van der Marel & Franx, 1993). For example, the skewness asymmetry is taken into account using the third order Hermite polynomial
| (1) |
Here the skewness parameter quantifies the asymmetry of the line shape. The intensity-weighted mean velocity of this line shape is calculated by van der Marel & Franx (1993) to be to first order. Compared to a Gaussian, the mean velocity measured by Gauss-Hermite fitting is less biased towards the wing and closer to the peak, while compared to the peak velocity the Gauss-Hermite fit is also less sensitive to the noise. Differences in the velocity fields derived from these different methods and their effects on the resulting rotation curves are discussed in Appendix B. We find that for high SNR data, the rotation curve derived from the moment-1 velocity field is systematically lower than from the Gaussian/Gauss-Hermite velocity field at the 15 level, and that the peak-velocity produces noisy rotation curves for low SNR data.
Considering the advantages of Gaussian and Gauss-Hermite fitting, we utilized these two methods to construct the velocity field. In order to minimize contamination from noise, we applied the noise masking described in §3.1. We then performed a Markov Chain Monte Carlo (MCMC) fitting of a Gaussian line shape to the five H I data cubes. We assume the likelihood function of intensity is Gaussian, and the sigma of this Gaussian is a constant throughout the data cube. The sigma was measured from the RMS intensity of line-free channels in the cube.
For the three highest-SNR galaxies, i.e., NGC 2748, NGC 7582, and NGC 1194 (SNR 14), there were regions along the major axis with high reduced- values, i.e., where the cumulative distribution function of is larger than 95 percent, indicating deviations of the line shape from a Gaussian, mostly because of the line asymmetry described above. To better capture the skewness of the line, we fitted these high spectra with a third-order Gauss-Hermite function. The final velocity fields of NGC 2748, NGC 7582, and NGC 1194 were constructed using a mixture of Gaussian and Gauss-Hermite fitting. The lower SNR cubes of NGC 2960 and UGC 3789 (SNR 6) do not have enough SNR to show deviations from single Gaussians.
Higher-order deviations from the Gauss-Hermite line shape, such as the fourth-order kurtosis (), still exist in smaller particular regions after using the third-order polynomial; along the major axis of the edge-on galaxy NGC 1194 the line-of-sight overlap is severe, and along the spiral arms in NGC 7582 the gas kinematics are complex. We did not apply higher-order fits as the inclusion of the polynomial would not change the mean velocity to the first order (van der Marel & Franx, 1993).
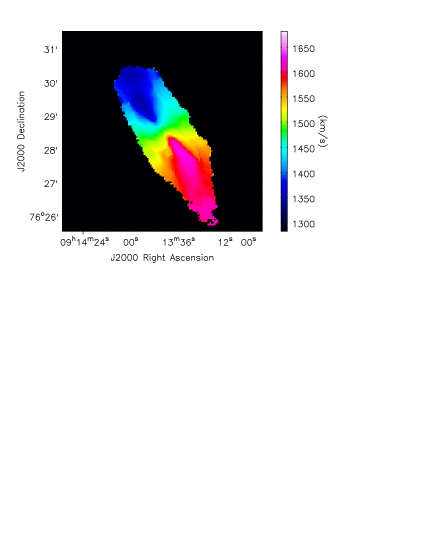
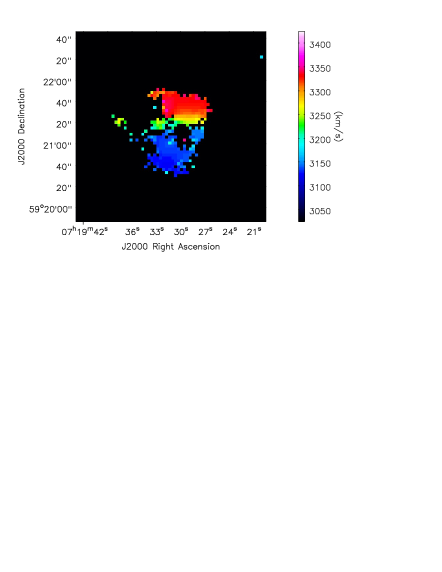
One advantage of the MCMC fitting is that the uncertainty in each fitted parameter can be estimated from the standard deviation of the probability distribution probed by the chain. The uncertainties in the velocities are especially useful. A large velocity uncertainty may indicate that the spectrum contains no emission line, only noise. We therefore performed a further masking to exclude pixels with velocity uncertainty larger than 80 km s-1. The final velocity fields are shown in the right columns of Figures 1 to 5.
3.3. Rotation Curves
Rotation curves are derived by fitting the velocity fields (§3.2) with a rotating disk model. This model consists of coplanar concentric rings, each with its own rotation velocity. The width of each ring is chosen to be 14″, corresponding to the typical beam size. We do not use tilted-ring modeling, but we show in Appendix B that the rotation curves derived with a tilted ring analysis are consistent with those presented here.
The rotation-curve fitting was performed with the same MCMC method. We assume that the likelihood function of velocity is Gaussian, and use the velocity uncertainty estimated in §3.2, such that noisier pixels with larger velocity uncertainties are down-weighted naturally. We fit five geometrical parameters, the center , , the systemic velocity , the inclination , and the position angle P.A., together with the rotation velocity, at each ring. These parameters describe the velocity-field model. For the megamaser galaxies (NGC 1194, NGC 2960, and UGC 3789) we fix the central positions (, ) to the VLBI maser positions, and we fit the kinematic center of NGC 2748 and NGC 7582 as free parameters. The , , P.A., and rotation velocities are fitted as free parameters with the exceptions of the inclination in the case of NGC 2960 and UGC 3789, and the P.A. of UGC 3789, where these values cannot be constrained by the data. Therefore, we fix these three values to the HyperLeda values (Paturel et al., 2003), derived from the optical images. The best-fit geometrical parameters are listed in Table 3.
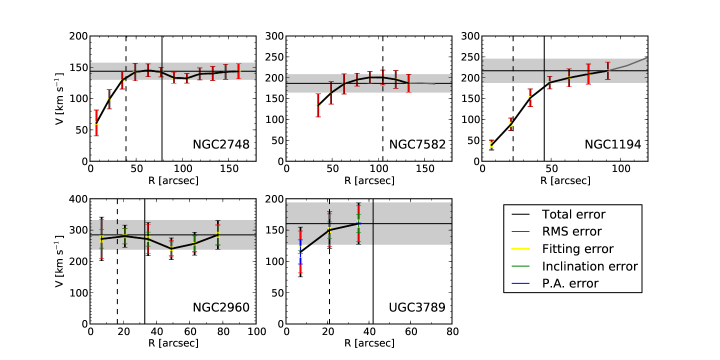
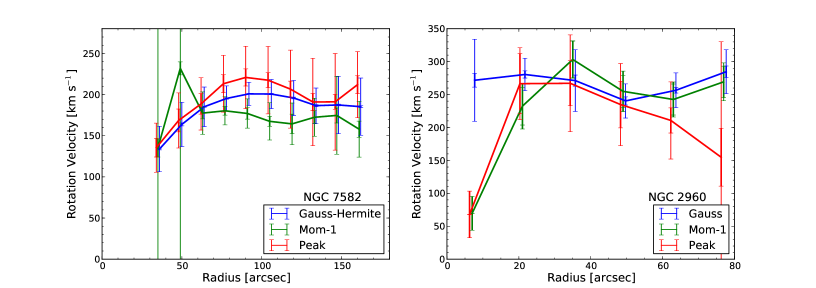
The best-fit rotation curves are plotted in Figure 7. Various error sources in the rotation curves are considered, including the fitting errors estimated by the standard deviation in the Markov chains, the RMS errors estimated by the RMS variation of the residuals in a ring, and the errors induced by uncertainties in inclination and P.A. It is commonly found that the formal fitting errors in the rotation curve fits are unrealistically small (e.g., deBlok et al., 2008), likely because the rotating disk model fails to capture features in the observed velocity field such that the residuals are non-Gaussian, causing the fitting errors to appear artificially small (5-20 times smaller than the RMS error). As shown in Appendix B, the RMS error is larger than or comparable to the differences between various velocity assignment methods and different parameterized rotating disk models, and therefore provides a conservative estimate of the potential systematic uncertainties. For NGC 2960 and UGC 3789, we also include the uncertainties in the literature inclination and/or P.A. values. The uncertainties contributed by these values are estimated by recalculating the rotation velocities assuming an inclination and/or P.A. within of the HyperLeda value. The final error is the quadratic addition of the considered error sources.
4. Relation
4.1. The Sample
Our primary sample is an updated list of galaxies with both dynamical and spatially resolved measurements, as tabulated in Table 4 and 5. There have been a number of compilations of and (Kormendy & Bender, 2011; Beifiori et al., 2012); we introduce a few significant improvements over these. First, we update five maser and three stellar/gas dynamical measurements. In addition to our five VLA H I rotation curve measurements, there are a few other measurements included in this sample from the literature that are not compiled in previous studies. We also reexamine the literature values with a careful reliability analysis, to ensure that our measurements and the literature values are derived in a consistent manner. Thus, our values may differ from previous work. In addition to this primary sample, we also consider a secondary sample composed of galaxies with three spatially unresolved (single dish H I measurements) and fifteen black hole mass upper limits. This secondary sample is described in Appendix C and plotted in Fig. 8 for comparison, but is not used in our scaling relation fitting analysis.
4.1.1 Circular Velocities
Table 4 lists the values, sources, and rotation-curve properties of our primary sample. We examined each rotation curve from the original literature to assign a value. Because is used as a tracer of the dark matter halo potential in the outer parts of the galaxy, we assign as the rotation velocity at the largest observed radius , which is consistent with the definition in Ferrarese (2002). If the inclination correction is applied in the original literature, we use this inclination-corrected rotational velocity, otherwise we apply a simple inclination correction using the optically determined inclination from HyperLeda (Paturel et al., 2003). The uncertainty in that results from our inclination correction treatment is estimated to be less than for a typical inclination error of in the optically derived inclination (e.g., Dressler & Sandage, 1983) at an average inclination of . This is comparable to or smaller than the measurement errors described below.
The observational error in , listed first, is taken from the original literature. If it is not presented then we assume a observational error, which is typical among our sample. The second error stands for the uncertainties due to rotation curve variation. In the ideal case where the rotation curve is flat at large radius, there is one uniquely defined . However, if the rotation curve is not flat but keeps rising or starts to fall, then depends on where the outermost observed radius is located. To take this uncertainty into account, we assign a second error equivalent to the amplitude of variation in the rotation curve. While these error assignments may overestimate the real error between the observed and the true halo potential, we hope to avoid overestimating the intrinsic scatter in the relation. The final error used in the relation fit is taken as the larger of the observational and rotation curve variation error, as listed in Table 5.
There are two galaxies, NGC 3998 and NGC 5128 (Centaurus A) in our primary sample that have no rotation curve measurements but have spatially resolved H I data. For NGC 3998 we adopt the value and observational error estimated by the original literature (Knapp et al., 1985). For NGC 5128, we determine using the published P-V diagram, and apply an inclination correction using the inclination from HyperLeda (Paturel et al., 2003). To reflect our lack of knowledge about the rotation curve trends, we assign conservative rotation curve variation errors of in these two cases.
How faithfully reflects the potential of the dark matter halo depends on whether the rotation curve is probing the halo-dominated part of the galaxy. Therefore we compare the outermost observed radius of the rotation curve with the optically determined , which is the mag arcsec-2 isophote from RC2 (de Vaucouleurs et al., 1995) shown in Column (6) of Table 4. It is worth noting that if is small, as in the case of many optical rotation curves, then the rotation curve may be dominated by baryons rather than the dark matter halo, in turn biasing our measurement of intrinsic scatter in the relation. Thus, we divide galaxies into four groups according to the spatial extent and shape of their rotation curves. The first group has the largest spatial extent (), followed by the second group (). The third and fourth groups both have short rotation curves (), but in the third group the rotation curves flatten while those ones in the fourth group are still rising until the last bin. We discuss the reliability of the measurements for these groups in §4.3 and will conclude that only the first two groups () have reliable for our analysis.
4.1.2 The and Samples
Table 5 lists , , and other galaxy quantities. The black hole mass , stellar velocity dispersion , morphology, and distance are adopted from McConnell & Ma (2013), except for NGC 4526 (Davis et al., 2013). The method of measurement is also listed. We note potential caveats in the measurements of three galaxies as pointed out by McConnell & Ma (2013). Lodato & Bertin (2003) measured the black hole mass in NGC 1068 and found a non-Keplerian maser disk. For NGC 2748, Atkinson et al. (2005) cautions that the determination of the disk center may be affected by heavy extinction. Finally, the black hole mass in NGC 7457 as measured by Gebhardt et al. (2003) could be overestimated if the central bright source excluded in their dynamical modeling is a nuclear cluster instead of an AGN. While we keep these three galaxies in our sample, we note these points of caution. The that we adopt from McConnell & Ma (2013) is the light-weighted stellar velocity dispersion within one effective radius. However, for some galaxies the is lower than in previous studies (e.g., Gültekin et al., 2009; Beifiori et al., 2012), as the BH sphere of influence is excluded in the velocity integration to avoid contamination. NGC 3998 and NGC 4594 in our primary sample, as well as NGC 1399 and NGC 4486 in our secondary sample, have updated by McConnell & Ma (2013) with this correction. We also note that there is a new distance update from megamaser measurements for UGC 3789 (Reid et al., 2013), but we adopt the distance in McConnell & Ma (2013), which is consistent with Reid et al. (2013).
4.2. Fitting Method
To quantitatively analyze the and relations, we fit each scaling relation with a power-law functional form
| (2) | ||||
| (3) |
Here is the intercept and is the logarithmic slope of the relation. We use to compare with , motivated by the widely used singular isothermal sphere model where (Binney & Tremaine, 2008). Observationally Ferrarese (2002) also found an almost linear relation between and with a ratio close to .
We use a maximum-likelihood fitting method similar to Gültekin et al. (2009) that takes intrinsic (or cosmic) scatter into account, with modifications regarding the error treatment. For simplicity we assume that the probability distribution of both the observational errors and intrinsic scatter are normal in log space, and all the observational errors are symmetrized in log space before fitting. Here we denote
| (4) | ||||
| (5) | ||||
| (6) |
and the normalized Gaussian error distribution to be with mean zero and standard deviation .
To take the error in the independent variable ( and in this case) into account, we have an error term in the likelihood function. We write the likelihood for observing one galaxy (, ) given an intrinsic scaling relation with intrinsic scatter to be
| (7) |
This treatment of the errors in the independent variable is less computationally expensive than the Monte Carlo method used in Gültekin et al. (2009). We then maximize the total likelihood
| (8) |
to get the best-fit scaling relation parameters, the intercept , the slope , and the intrinsic scatter . This maximum-likelihood method is similar to the minimum -square method described in Tremaine et al. (2002), except for the normalization factor of the Gaussian function. We adopt the confidence limit as an error estimate for the fitted parameters , , and .
4.3. Fitting Results
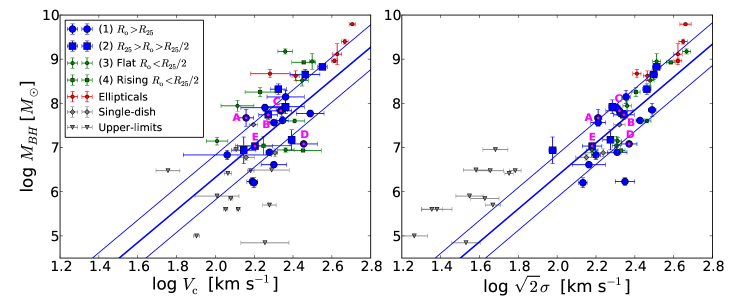
We find that is correlated with both and , with Spearman rank correlations of (-value ) and () respectively, for the reliable sample of 22 galaxies discussed below, meaning that a correlation exists for both of the relations. Using this sample, the best-fit relation is , , and , and is plotted as blue lines in Figure 8. There is no significant correlation between the residuals in the relation and (Spearman , -value). The parameters of different samples as well as the comparison with the relation are shown in Table 6.
To determine a reliable sample and investigate how the spatial extension of the rotation curves affect the reliability of the measurements, we derive the scaling relations using sample with different criteria. The first group of fourteen galaxies () should be the most reliable sample with rotation curves that probe the outer, halo-dominated, region of the galaxy. The second sample of eight galaxies () also gives the same intrinsic scatter as the first group, showing that the measurements with are as reliable as the first group for our purpose. When we include groups three and four, the eleven shorter rotation curves with , which are predominantly measured in the optical, the intrinsic scatter increases significantly. It is a sign that for these short rotation curves the halo potential is not represented by the observed , and the intrinsic scatter will be inflated artificially if they are included in the analysis. We therefore rely only on the sample of twenty-two galaxies from the first two groups for our main scientific discussion.
Using this sample, the relation has an intercept consistent with the relation, if corresponds to . While the slopes of the and relations are consistent within our sample, our relation slope falls on the lower end of reported slopes from studies of the relation using larger samples, (e.g., Gültekin et al., 2009; McConnell & Ma, 2013), possibly due to our limited dynamic range. The intrinsic scatter in the relation of is similar to that in the relation of when using matched samples, but is larger than the relation scatter for the entire sample in McConnell & Ma (2013), which includes both early and late-type galaxies. The implications of our fits are discussed in §6.
Some elliptical galaxies also have measured from dynamical modeling. Although these measurements may involve different systematics than the rotation-curve-derived for disk galaxies, we plot six such ellipticals from Beifiori et al. (2012) in Fig. 8 as an attempt to probe the trend at the high mass end. NGC 1399, NGC 3379, NGC 4374, NGC 4472, and NGC 4486 (M87) have measured by Kronawitter et al. (2000) using stellar kinematics, while NGC 3608 is measured by Coccato et al. (2009). Note that for NGC 4486 (M87), Kronawitter et al. (2000) measured km s-1, while Murphy et al. (2011) measured a much larger km s-1, highlighting the challenges in this method. All the black hole masses are from McConnell & Ma (2013). When these ellipticals are added, the slopes of the relation and relation increase significantly (by to and respectively). McConnell & Ma (2013) found a similar steepening in the relation when considering both early and late-type galaxies. On the other hand, the intrinsic scatter decreases slightly by about to and for the and relations respectively. These results will not be used in our scientific discussion, as their interpretation awaits better understanding of the correspondence between the from the dynamical modeling and from H I rotation curves.
4.4. Comparison with the Literature
Volonteri et al. (2011) re-analyze the 25 galaxies in Kormendy & Bender (2011), which have dynamical measurements and from spatially resolved H I or stellar kinematics, using the methods of Gültekin et al. (2009). They constrain the relation to have , , and , consistent with our results.
Beifiori et al. (2012) study the relation using 28 galaxies with compiled by Gültekin et al. (2009), and from resolved H I kinematics, unresolved H I line width, or dynamical models of stellar kinematics in early type galaxies. Their relation parameters are , , and intrinsic scatter . Their intercept is different from our result, possibly because more elliptical galaxies are included in their sample. Their fit for the slope has a larger dynamic range because they include more elliptical galaxies, but is still consistent with ours, as is their intrinsic scatter measurement.
5. Possible Systemic Uncertainties
Intrinsic scatter in the scaling relations provides an important discriminant between different BH scaling relation scenarios. Various observational errors in have been taken into account in §4 to avoid contaminating the intrinsic scatter measurement, including the inclination correction, the observational error, rotation curve variations, and the uncertainties due to short rotation curves. Here we discuss whether other systematic uncertainties, such as sample bias, may affect the interpretation of, and the comparison between, the and relations. Also, in order to interpret the relation from the observed relation, we discuss the scatter that may be introduced in the conversion. We conclude first that the comparison between the and the relations should be fair even in the face of selection effects, and second, that the scatter introduced by the conversion or halo triaxiality is not important compared to other sources of uncertainty.
5.1. Selection Effects
If our sample is subject to selection effects, it may not represent the true distribution of objects. Selection effects may exist for both BH and circular velocity measurements. First, it has been argued that analysis excluding upper limits might be biased toward more massive BHs at a given velocity dispersion, especially for late-type galaxies, since only massive BHs have a sphere of influence large enough to be spatially resolved (Gültekin et al., 2011). Beifiori et al. (2012) includes a large number of upper limits in their fits to the and relations, which should be closer to the true distribution. They find a slope for the relation consistent with ours, but cannot derive a reliable intrinsic scatter. While concerns over selection biases cannot be excluded definitively, we use the same sample for both and relations, such that if biases exist, they have the same effect on the two relations.
In addition to selecting against low-mass BHs, we also select against galaxies that have no from H I rotation curves, which includes massive elliptical (gas-poor) galaxies, and disk galaxies that either have only optical (mostly covering a limited radial distance) or no rotation-curve measurements. With no stellar dynamical measurements for ellipticals, our dynamic range is limited compared to the relation in other studies, (e.g., Gültekin et al., 2009; McConnell & Ma, 2013). While selection biases in measurements also exist, at least there is no obvious bias on the intrinsic scatter inherent with these selections.
5.2. Uncertainties in Translating to
If we wish to interpret the relation as a reflection of the underlying relation, then scatter may be introduced in the conversion from to . To estimate the magnitude of this scatter, we take the Navarro-Frenk-White (NFW; Navarro et al., 1996) model as an example. This model is a mass profile that is parametrized by the inner density and the characteristic inner radius , or equivalently the virial mass and the concentration . The virial radius is defined as the radius within which the averaged halo density exceeds the background density by a certain factor, the virial mass is the mass enclosed within , and the virial velocity is the rotation velocity at . Because there is a one-to-one correspondence between and , the main uncertainty actually comes from the conversion between at the virial radius (typically a few hundred kpc) and at the observed radius (typically 10-20 kpc, Ferrarese, 2002). The observed is close to the maximum velocity occurring at radius , which is a few to a few tens of kpc. The ratio depends on
| (9) |
The scatter in concentration is estimated by Bullock et al. (2001) and corrected by Wechsler et al. (2002) to be dex, which translates to an error of 0.035 dex in or 0.14 dex in for a slope of in the relation. There is also a weak dependence of concentration on the virial mass, which affects the slope of the relation in principle.
Additionally, if the halo is not spherically symmetric, as assumed by the NFW profile, but is prolate or triaxial, there will be extra uncertainty in the conversion. Franx & de Zeeuw (1992) estimate that the low observed scatter in the Tully-Fisher relation constrains the ellipticity of the halo potential in the disk plane to be . Triaxiality can at most contribute a scatter of 0.026 dex in or 0.1 dex in in the relation.
Removing these additional sources of uncertainty in quadrature, assuming that they are uncorrelated, changes the final intrinsic scatter very little (0.48 rather than 0.51). Thus we conclude that those sources of scatter are small compare to outstanding measurement uncertainty.
6. Discussion
We will now consider the implications of our new fits for the evolution of BHs and galaxies. In §6.1, we hope to gain new insight into whether AGN feedback is required to explain the BH-bulge scaling relations (e.g., Silk & Rees, 1998; Hopkins et al., 2006), or whether galaxy merging alone may lead to tight BH-bulge correlations in massive galaxies (e.g., Peng, 2007; Jahnke & Macciò, 2011). In §6.2 we discuss the implications of upper limits as outliers in the relation.
6.1. Is It Feedback or Merging That Sets the Scaling Relations?
We address the relative importance of feedback and merging empirically by asking which can account for features in the observed and relations. We start by reviewing the expected slope, outlier behavior, and intrinsic scatter of the scaling relations in the context of each scenario. We will find that while more theoretical guidance and a larger sample size are needed to make inferences from the outliers and slope measurements, the intrinsic scatter is already an available and useful discriminant between the two scenarios.
In the galaxy merging scenario (Peng, 2007; Hirschmann et al., 2010b; Jahnke & Macciò, 2011), the correlations between and galactic quantities (e.g., , , ) emerge from a large number of mergers simply by the central limit theorem, even without a physical mechanism linking the two. In the context of this scenario, we expect the following features of the scaling relations. First, as the number of mergers increases and the galaxies grow larger, the scatter between and galaxy properties will decrease and the distribution will converge to a tighter correlation. Therefore, it is expected that the intrinsic scatter will decrease as the number of mergers increases towards larger and . Outliers, with BH masses deviating from a power-law scaling relation, become increasingly unlikely towards higher masses. Second, the logarithmic slope of the correlation between two linear quantities, e.g., and , should be close to unity if the impact of growth via accretion for any component is small. In other words, the average ratio should be similar across all masses. If we translate this slope to the relation, assuming (Ferrarese, 2002), we should find the slope of the relation, , to be close to , somewhat smaller than, but allowed by, our observations. Lastly, the relation should be tighter than other scaling relations, e.g., the or relations, because simply adds during merging and does not depend on the baryonic physics that and are subject to. For example, during merging, extra factors of star formation and disk to bulge conversion have to be considered for the evolution of , and this will make the scatter in the relation larger than that in the relation, if the baryonic regulation mechanism is not present. However, we note that diffuse DM accretion in principle may also enhance the scatter in .
Feedback, on the other hand, provides a physical mechanism that couples BH mass directly with the galaxy potential well (e.g., Silk & Rees, 1998). If the BH is massive enough, its energy or momentum output can expel gas from its vicinity and quench the further growth of both the BH and the galaxy. This feedback loop sets an upper limit on the BH mass for a given potential well depth, measured by the stellar velocity dispersion of the bulge or of the dark matter halo. However, it is unclear whether this self-regulation process takes place on the scale of the BH sphere of influence, the bulge (Debuhr et al., 2010), or the dark matter halo (Di Matteo et al., 2003; Booth & Schaye, 2010b). Some predictions of the feedback scenario are as follows. First, the scaling relations form an upper boundary for . The BH cannot grow above the relation via accretion (although over-massive BHs could already be in place from massive seeds Volonteri & Natarajan (2009)). Second, the slope of the or the relation is predicted to be five for energy feedback (Silk & Rees, 1998) and four for momentum feedback (Murray et al., 2005). Third, the correlation between BH mass and the potential indicator ( or ) on the feedback scale should be tighter than on other scales.
We here compare the statistics of our sample with the predictions discussed above regarding the outlier properties, slope, and the intrinsic scatter, respectively. There are no obvious outliers above the relation in our sample, possibly due to limited sample size. However, there are bulgeless galaxies with upper-limits that are low compared to their , which will be further discussed in §6.2. Regarding the measured slopes, with such limited dynamic range our data are still inadequate to discriminate the two scenarios. Both scenarios are consistent with the wide range of allowed slopes ( = 2.48 - 4.91).
However, the comparison of intrinsic scatter between the two relations can provide useful constraints on the origin of the scaling relations. Our measurements show that the scatter in the relation is similar to that in the relation, within the errors. It is worth noticing that the intrinsic scatter in , dex, is a conservatively low estimate, as we have assigned large errors to the measurements to account for various observational uncertainties, including inclination uncertainties and rotation curve variations. Even so, we still find a value that is consistent with our measured scatter, dex, and that is not smaller than the intrinsic scatter for late-type galaxies constrained by McConnell & Ma (2013) or for the entire sample in McConnell & Ma (2013).
We find no evidence that the (or ) relation is significantly tighter than the relation, in contradiction with naive expectations from the pure merging scenario. Therefore, our result disfavors merging as the only mechanism that ties together BHs and galaxies. Note that we use to trace the baryonic mass in the bulge, while Jahnke & Macciò (2011) looked at the relation instead. Unfortunately, observations of for lower-mass galaxies with dynamical are scarce, so a direct comparison between and is not yet possible. If the real scatter in the relation is even smaller than in , our conclusion is stronger. Even if the scatter in the relation turns out to be larger than in the relation, the fact that the scatter in the relation is no smaller than that in the relation still requires (baryonic) mechanisms beyond the pure merging scenario.
On the other hand, if AGN feedback is important in regulating BH growth, and it acts primarily on the bulge scale (Debuhr et al., 2010), the smaller intrinsic scatter in the relation could be explained. We speculate that on top of the correlations formed by merging, feedback further regulates the BH mass according to the bulge potential , tightens the relation (not the relation), and decreases the intrinsic scatter in a relative sense. Alternatively, other baryonic mechanisms that connect the BH to the bulge, e.g., via feeding of bulge stars onto the accretion disk (Miralda-Escudé & Kollmeier, 2005), or star formation-regulated BH growth (Burkert & Silk, 2001), could also contribute to the tighter relation.
6.2. Upper Limits in the Two Scaling Relations
upper limits in bulgeless galaxies have also been used to differentiate the dependence of black hole mass on galaxy halos or bulges. Kormendy & Bender (2011) found that cannot be uniquely determined by . Bulgeless galaxies have low (or zero) and low but relatively high . Therefore, is a better predictor of than is for these galaxies.
We expand the sample of bulgeless galaxies with upper limits by including the measurements from Neumayer & Walcher (2012) in our secondary sample. This sample is described in Appendix D and listed in Tables 8 and 9. As can be seen from Figure 8, there are a few upper limits lying below the relation but not the relation. With a larger number of galaxies, we confirm Kormendy’s statement that the halo mass alone does not determine the black hole mass.
However, it is also possible that these bulgeless galaxies do not host a massive black hole at all. The presence or absence of a BH seed may involve different physical mechanisms than those that couple BHs to galaxies (e.g., Volonteri et al., 2011). In any case, the upper limits strengthen our conclusion that bulge scales matter, likely both in seeding and in BH growth with cosmic time.
7. Summary
We refine the measured relation and compare it to the relation to gain insight into the mechanisms that drive BH scaling relations. We perform VLA observations to measure the circular velocities for five galaxies with dynamical . Together with a thorough literature search, we increase the sample size of galaxies with both and measurements to thirty-three. Twenty-two of these have evaluated at large enough radius () to be reliable for our scientific purpose.
With this sample, we constrain the power-law relation to have an intercept , slope , and intrinsic scatter . The intrinsic scatter in the relation is not significantly smaller than that in the relation, showing that does not correlate better with dark matter halo mass than with bulge properties. This contradicts naive expectations from pure merging scenarios. Furthermore, we consider a number of upper limits in bulgeless galaxies that lie significantly below the relation, suggesting that BH masses are better predicted by the bulge, not the halo, either via its seeding or accreting mechanism. We thus suggest that pure merging is not likely to be the only mechanism that drives the scaling relations. AGN feedback may also be an essential ingredient to tighten the correlation between BH mass and bulge properties.
We highlight possible future improvements to this work. First, modeling of the dark matter halo mass distribution, to separate the halo mass from the baryons using both rotation curves and light distributions, can improve the halo mass estimation and better constrain the relation. Second, measured by stellar dynamical modeling for elliptical galaxies, if proven to be comparable to those from H I rotation curves, can improve the dynamic range and better constrain the slope of the relation. Third, quantitative theoretical predictions for the scaling relations, especially the intrinsic scatter, from both feedback and pure merging scenarios, will enable more direct comparisons with the empirical relations. Ultimately, a large sample unbiased with respect to and , which awaits next-generation telescopes, would be the most ideal data set for this study.
Appendix A H I Properties of Individual Galaxies
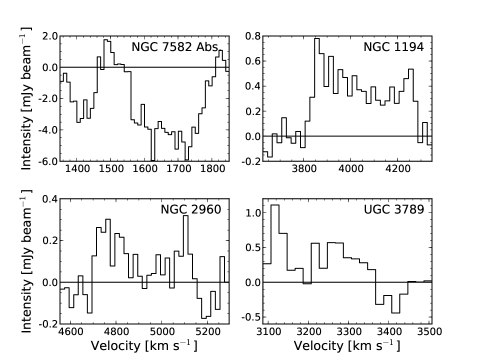
In addition to the rotation curves kinematics, there is also rich information about the H I gas properties in our VLA data cubes. We discuss the H I fluxes and masses and the H I properties of each individual galaxy in this section. H I moment maps of these galaxies are shown in Figures 1 to 5 and the integrated spectra of lower SNR galaxies are shown in Figure 9.
A.1. H I Flux and Mass
The H I fluxes and mass are tabulated in Table 7. We measured the H I flux by integrating the data cube over the spatial regions as shown in the moment-0 maps. To avoid contamination, for NGC 1194, we excluded the north-western cloud, which is detached from the main galaxy as seen from the moment-0 map. We also removed the central absorption region in NGC 7582. As an estimate of the H I flux error, we also measured the flux from the masked moment-0 maps, which exclude the noise-dominated channels and therefore can underestimate the total flux. We take the difference between the two as the systematic flux error. The H I masses are calculated using the equation
| (A1) |
from Draine (2011). For consistency, we adopt the same distances as those used for the measurements in §4.1.2 and Table 2. Distance uncertainties of are assumed, and the uncertainties in are propagated from the uncertainties in flux and distance. It is common in the literature to compare the H I mass to the total stellar mass, to understand the gas fractions and available fuel for future star formation. Here we use the B-band luminosity () as a proxy for the stellar mass and calculate the H I mass-to-light ratio () as a proxy for the H I-to-stellar mass ratio. Using the B-band luminosity from HyperLeda (Paturel et al., 2003), the ratios of our galaxies range from to (Table 7). This is similar to the range of typical Sa galaxies, which have an average value with a factor of dispersion (Roberts & Haynes, 1994), as well as AGN hosts which also have (Fabello et al., 2011; Ho et al., 2008). Therefore, our sample galaxies have roughly similar H I-to-stellar mass ratios as typical disk galaxies and AGN hosts.
A.2. NGC 2748
NGC 2748 is an SAbc galaxy (de Vaucouleurs et al., 1991) at a distance of 21.6 1.4 Mpc. The H I observation of this galaxy has the highest SNR among our five galaxies, with an H I-based inclination of , compared to from optical data in HyperLeda (Paturel et al., 2003). The fitted H I systemic velocity is 1482 km s-1. The kinematics show the typical signature of a rotating disk (Fig. 1). The asymmetric velocity field suggests that slight disk warping may exist. The angular diameter along the major axis at the 3 level, i.e., where H I is detected above the 3 level, is . The H I flux is measured to be , which corresponds to an H I mass of .
A.3. NGC 7582
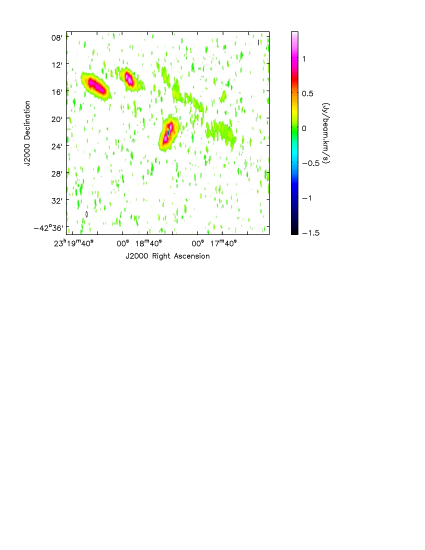
NGC 7582 is an SB(s)ab galaxy (de Vaucouleurs et al., 1991) at a distance of 20.6 2.4 Mpc. Our observation of this galaxy also has high SNR. The inclination derived from the H I kinematics is , compared with from HyperLeda (Paturel et al., 2003). The systemic velocity is 1588 km s-1 as fit by H I. Its velocity field shows the clear signature of rotation and is asymmetric (Fig. 2), suggesting a warped disk. The velocity discontinuity at the edge of the warp coincides with the location of the spiral arms. Its angular diameter is at the 3 level. The H I flux is , which corresponds to an H I mass of .
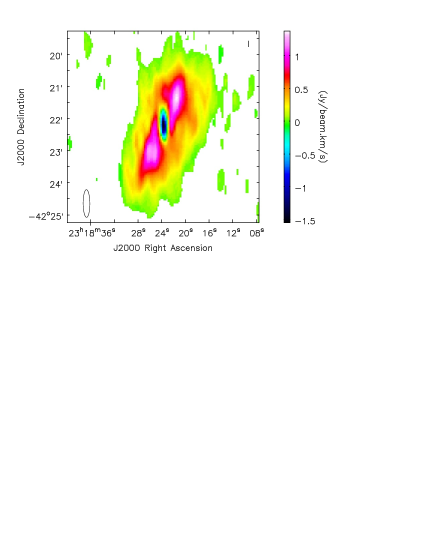
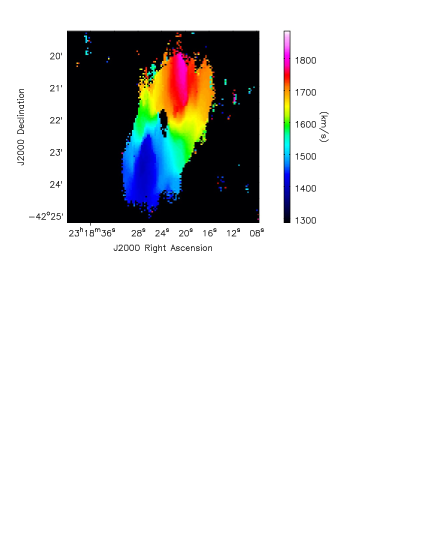
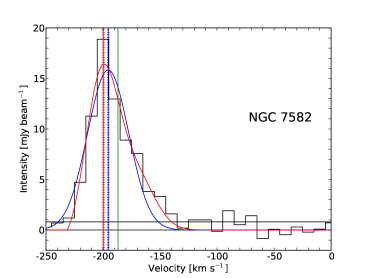
NGC 7582 shows H I absorption features against the central continuum source. The continuum-subtracted spectrum averaged over the central beam is shown in Figure 9. There is an emission peak at a velocity of 1500 coinciding in velocity with the emission in nearby regions. Therefore, we suspect that we are observing the superposition of a wide absorption feature with narrow emission. The wide absorption feature has a FWHM of 400 centered at 1580 , close to the systemic velocity. Because of contamination from H I emission, we can only estimate a lower limit on the absorbed flux. Using the line width and depth, that flux limit is . The lower limit on the H I absorption optical depth is estimated to be .
Finally, there are two H I companions of NGC 7582 observed in the same velocity range and sitting and to the north-east respectively. These are the companion galaxies NGC 7590 and NGC 7599. There is faint diffuse H I emission long that extends from NGC 7590 to the west of NGC 7582 with a closest distance to NGC 7582 of . This is possibly tidally stripped gas due to interactions between these galaxies. Larger scale moment-0 and moment-1 maps showing these structures are plotted in Figure 10.
A.4. NGC 1194
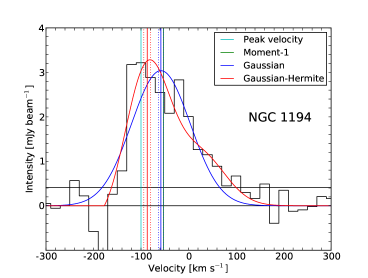
NGC 1194 is an SA0 galaxy (de Vaucouleurs et al., 1991) at a distance of 53.2 3.7 Mpc. It is one of our water megamaser galaxies (Kuo et al., 2011). The H I SNR is sufficiently high to determine an inclination of , compared to from HyperLeda (Paturel et al., 2003). The systemic velocity as measured from the H I map is 4075 km s-1. The H I moment-0 map shows an elongated morphology with angular diameter at the level, showing that the H I gas is organized within the galaxy disk. The velocity field shows a clear velocity gradient due to rotation (Fig. 3). The integrated spectrum (Fig. 9) also has a clear double peaked rotation signature with the width consistent with our measurement. The H I flux is measured to be , corresponding to a mass of . There is one H I cloud to the north-west side of the galaxy that is detached from the main galaxy body (see Fig. 3). This cloud has a mass of .
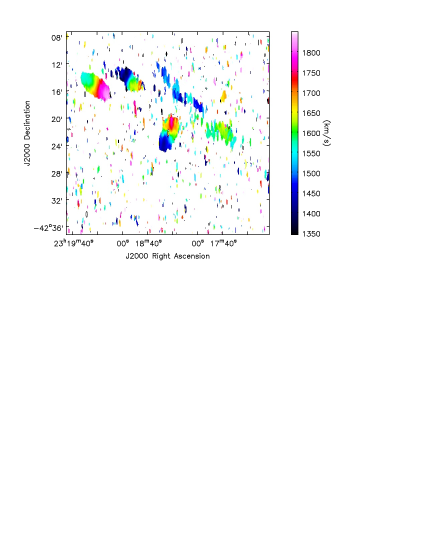
A.5. NGC 2960
NGC 2960, also called Mrk 1419, is an Sa (de Vaucouleurs et al., 1991) galaxy at 72.2 5.1 Mpc and also a water megamaser galaxy from Kuo et al. (2011). The systemic velocity from H I is 4939 km s-1. Our map of NGC 2960 has lower SNR (SNR ). Although H I emission is only seen in discrete patches of the galaxy, an overall velocity gradient is observed (Fig 4). The detected diameter is at the level from the moment-0 map. The inclination cannot be constrained by the H I data alone, and we derive the rotation curve by adopting the optical inclination from HyperLeda (Paturel et al., 2003) of . The integrated spectrum (Fig. 9) shows a double peaked rotation signature and a width that is consistent with our measurement. The H I flux is measured to be , corresponding to a mass of . Previous D-array VLA observations (Kuo et al., 2008) are consistent with the spatial extent and velocity from our data, but their H I flux of is lower than ours. This is understandable as their flux was calculated from the moment-0 map and should be lower than from the data cube.
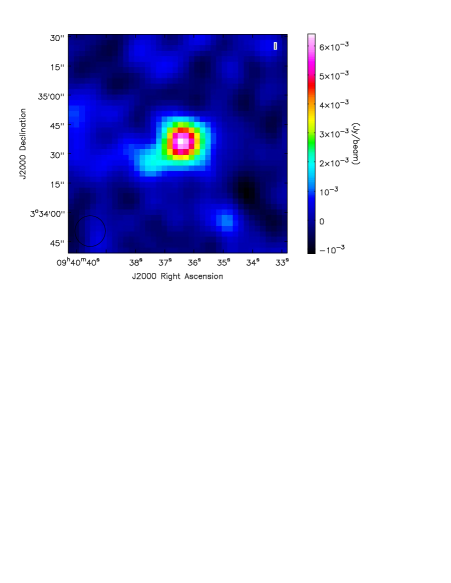
A.6. Jet in NGC 2960
Our H I data also provides images of the radio continuum at 20 cm. We find that the radio continuum of NGC 2960 is slightly extended, suggesting that there is a radio jet launched from the central black hole (Fig. 11). The continuum image is made from line-free channels on both sides of the H I line with a total velocity range of 300 , and is cleaned to the level using weighting. We measure the size and position angle of the jet using two different methods. First, we fit a central point source () and subtract it. We detect residual emission to the south-east. Taking into account the positional uncertainty due to the finite beamsize, this extended emission is away from the center at a position angle of . The flux in the extended emission is mJy. To estimate the size and P.A. error we also try a second method to quantify the elongated structure. We fit the whole continuum image with a two-dimensional Gaussian while allowing the semi-major and semi-minor axis, central position, and P.A. to vary, without deconvolution of the beam. The fitted Gaussian has a major axis of , and a minor axis of with P.A. , consistent with the first method. Therefore we conclude that the jet size is at a P.A. of . As in all megamaser galaxies studied to date, the jet axis is coincident with the rotation axis of the maser disk (Greene et al., 2013).
A.7. UGC 3789
UGC 3789 also hosts a water maser disk, is an SA(r)ab galaxy (de Vaucouleurs et al., 1991), and is at a distance of 49.9 7.0 Mpc (Braatz et al., 2010). The H I systemic velocity is 3229 km s-1. The H I observation also has low SNR and shows a ring-like structure with a diameter of at the level on the moment-0 map (Fig. 5). There is a clear velocity gradient. Neither inclination nor position angle can be constrained from the H I data alone. The optical inclination and position angle (Paturel et al., 2003) are adopted to derive the rotation curve. The measured H I flux is , corresponding to a mass of . Companion UGC 3797, which is away to the east, is detected in H I at the same angular distance but we do not detect any H I tidal tails.
Appendix B Details of Rotation Curves Estimation
In this section we investigate two complications that may affect rotation curve estimation. First, we consider differences in rotation curves arising from different methods of assigning velocity. Second, we look at tilted ring modeling, which captures warps in the rotation disk, to see if our circular velocities are changed.
As discussed in §3.2, there are various methods to assign velocity to a spectrum, e.g., the peak velocity, the intensity-weighted mean (moment-1), or Gaussian/Gauss-Hermite velocities. The first two methods have some drawbacks. The peak velocity is sensitive to the noise in the data, and is discretized to the channel width of the data cube, and the moment-1 velocity is biased towards the wing if the spectral line is asymmetric. Our preferred method is therefore the Gaussian/Gauss-Hermite fit. The averaged difference between the Gaussian/Gauss-Hermite and the peak velocity (moment-1) velocity field is 17 (18) km s-1 for the high SNR galaxies (NGC 2748, NGC 7582, and NGC 1194) and 37 (33) km s-1 for low SNR galaxies (NGC 2960 and UGC 3789).
We now propagate these different velocity assignments to investigate the differences in our inferred rotation curves. We focus on two representative galaxies, NGC 7582 (high SNR = 23) and NGC 2960 (low SNR = 6). We use the same MCMC procedure as discussed in §3.3, assuming a homogeneous error in the velocity field of 20 km s-1 for NGC 7582 and 40 km s-1 for NGC 2960, and applying the same masking as in the Gaussian/Gauss-Hermite velocity field to mask out noisy pixels. The fitted rotation curves are shown in Fig. 12. The average differences between Gaussian/Gauss-Hermite and the peak velocity (moment-1) rotation curves are 11 (23) km s-1 for NGC 7582 and 67 (39) km s-1 for NGC 2960. Compared to the RMS errors of the Gaussian/Gauss-Hermite rotation curves, which are 24 km s-1 for NGC 7582 and 37 km s-1 for NGC 2960, we found that: First, the peak velocity rotation curve of NGC 7582 is consistent with the Gaussian/Gauss-Hermite rotation curve within the error. However, the peak velocity rotation curve deviates from the Gaussian significantly for the lower SNR galaxy NGC 2960.
These tests confirm our concern that the peak velocity is highly sensitive to noise and is not suitable for estimating the rotation curves for low SNR data. Also, NGC 7582 has a moment-1–derived rotation curve that is systematically lower than the Gaussian/Gauss-Hermite one, with a deviation comparable to the RMS error. This is consistent with our expectation that the moment-1 velocity is biased by the wing of the spectral line. Moment-1 velocities usually underestimate the rotation velocity for high SNR data, due to beam smearing and higher intensity at the inner part of the galaxy. This bias was also demonstrated in the left panel of Fig. 6. NGC 2690 has a moment-1 rotation curve that differs from the Gaussian rotation curve at a level that is comparable to the RMS errors as well. In this case we see no systematic bias, possibly because the SNR is not high enough to manifest an asymmetric line shape. Considering these effects, we find that the Gaussian/Gauss-Hermite method is relatively reliable in the face of asymmetric line shapes and noisy data.
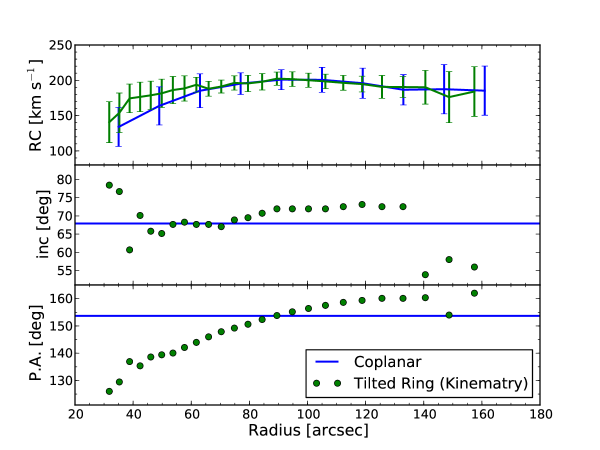
In §3.3 we adopt a coplanar disk model for rotation curve fitting. However, this model does not capture the asymmetry in the velocity field that arises from warping of the disk, as seen in NGC 2748 and NGC 7582. Here we assess whether these asymmetries have an effect on our estimates. We take our most asymmetric galaxy NGC 7582 as an example, and use the Kinemetry method (Krajnović et al., 2006) to fit a tilted-ring model. In this model, the position angle and the inclination of each ring are allowed to vary. Furthermore, second and third order harmonic terms, e.g., and , are included to capture higher frequency variations along each ring. The best-fit models are plotted in Fig. 13 with their residuals, and the fitted rotation curves are plotted in Fig. 14. The tilted-ring model better captures warps in the disk and reduces the residuals, but the best-fit rotation velocities stay unchanged within the uncertainties. The difference at the outer-most bin is less than of the RMS error. This demonstrates the robustness of the rotation curve fitting against warps and higher order variations of the velocity field, and shows that the RMS error is a conservative estimate of the potential systematics in the rotation curve fitting.
Appendix C from Single Dish Measurements
In our secondary sample we have three galaxies (NGC 3368, NGC 3393, NGC 3489) with dynamical but no available rotation curves. However, can also be inferred from the line width of integrated H I spectra taken with single dish radio observations (), and the single dish for these three galaxies from HyperLeda (Paturel et al., 2003) are listed in Table 8.
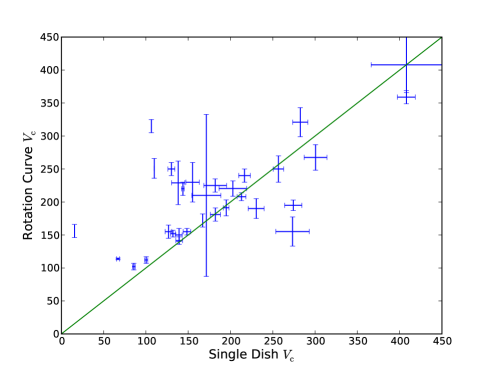
Since single-dish measurements are more readily available for large samples, they have been used in previous scaling-relation studies (Pizzella et al., 2005; Courteau et al., 2007; Ho, 2007; Beifiori et al., 2012). Roberts (1978) and Ho (2007) find that is a robust substitute for . On the other hand, without spatial information, single-dish circular velocities may contain large uncertainties due to the distribution of atomic gas, irregular rotation-curve shape, or contamination from companion galaxies. In general, the values may skew towards lower values, since single-dish measurements are biased to the inner part of the rotation curve.
To understand how much can deviate from , we compare the two numbers for all galaxies in our sample that have both measurements (Figure 15). For most of the galaxies, is consistent with . However for a few of them the two numbers can deviate by up to a factor of two. These are preferentially S0 galaxies, suggesting that in these cases low gas fractions are skewing the values low. On the other hand, there are only three galaxies in our sample that only have single-dish H I measurements. In practice, including or excluding these three galaxies from our fitting does not change the result. We decide not to include them in our primary sample.
Appendix D Upper Limits
For completeness, dynamically constrained upper limits for bulgeless galaxies, mostly from Neumayer & Walcher (2012), are listed in the second section of Table 8 and 9. The values are assigned as described in §4.1.1, except for the single-dish , which are from HyperLeda (Paturel et al., 2003). These upper limits are also plotted in Figure 8 as grey triangles in both of the scaling relations. Some of them are outliers in the relation (see discussion in §6.2).
References
- Atkinson et al. (2005) Atkinson, J. W., et al. 2005, MNRAS, 359, 504
- Bajaja et al. (1984) Bajaja, E., van der Burg, G., Faber, S. M., Gallagher, J. S., Knapp, G. R., & Shane, W. W. 1984, A&A, 141, 309
- Barth et al. (2009) Barth, A. J., Strigari, L. E., Bentz, M. C., Greene, J. E., & Ho, L. C. 2009, ApJ, 690, 1031
- Begeman et al. (1991) Begeman, K. G., Broeils, A. H., & Sanders, R. H. 1991, MNRAS, 249, 523
- Beifiori et al. (2012) Beifiori, A., Courteau, S., Corsini, E. M., & Zhu, Y. 2012, MNRAS, 419, 2497
- Beifiori et al. (2009) Beifiori, A., Sarzi, M., Corsini, E. M., Dalla Bontà, E., Pizzella, A., Coccato, L., & Bertola, F. 2009, ApJ, 692, 856
- Bender et al. (1994) Bender, R., Saglia, R. P., & Gerhard, O. E. 1994, MNRAS, 269, 785
- Binney & Tremaine (2008) Binney, J., & Tremaine, S. 2008, Galactic Dynamics: Second Edition (Princeton University Press)
- Böker et al. (1999) Böker, T., van der Marel, R. P., & Vacca, W. D. 1999, AJ, 118, 831
- Booth & Schaye (2010a) Booth, C. M., & Schaye, J. 2010a, MNRAS, 405, L1
- Booth & Schaye (2010b) —. 2010b, MNRAS, 405, L1
- Braatz et al. (2010) Braatz, J. A., Reid, M. J., Humphreys, E. M. L., Henkel, C., Condon, J. J., & Lo, K. Y. 2010, ApJ, 718, 657
- Bullock et al. (2001) Bullock, J. S., Kolatt, T. S., Sigad, Y., Somerville, R. S., Kravtsov, A. V., Klypin, A. A., Primack, J. R., & Dekel, A. 2001, MNRAS, 321, 559
- Burkert & Silk (2001) Burkert, A., & Silk, J. 2001, ApJ, 554, L151
- Cherepashchuk et al. (2010) Cherepashchuk, A. M., Afanas’ev, V. L., Zasov, A. V., & Katkov, I. Y. 2010, Astronomy Reports, 54, 578
- Ciotti & Ostriker (2001) Ciotti, L., & Ostriker, J. P. 2001, ApJ, 551, 131
- Coccato et al. (2009) Coccato, L., et al. 2009, MNRAS, 394, 1249
- Corbelli & Salucci (2000) Corbelli, E., & Salucci, P. 2000, MNRAS, 311, 441
- Courteau et al. (2007) Courteau, S., McDonald, M., Widrow, L. M., & Holtzman, J. 2007, ApJ, 655, L21
- Davis et al. (2013) Davis, T. A., Bureau, M., Cappellari, M., Sarzi, M., & Blitz, L. 2013, Nature, 494, 328
- de Vaucouleurs et al. (1995) de Vaucouleurs, G., de Vaucouleurs, A., & Corwin, H. G. 1995, VizieR Online Data Catalog, 7112, 0
- de Vaucouleurs et al. (1991) de Vaucouleurs, G., de Vaucouleurs, A., Corwin, Jr., H. G., Buta, R. J., Paturel, G., & Fouqué, P. 1991, Third Reference Catalogue of Bright Galaxies. Volume I: Explanations and references. Volume II: Data for galaxies between 0h and 12h. Volume III: Data for galaxies between 12h and 24h.
- deBlok et al. (2008) deBlok, W. J. G., Walter, F., Brinks, E., Trachternach, C., Oh, S.-H., & Kennicutt, Jr., R. C. 2008, AJ, 136, 2648
- Debuhr et al. (2010) Debuhr, J., Quataert, E., Ma, C.-P., & Hopkins, P. 2010, MNRAS, 406, L55
- Di Matteo et al. (2003) Di Matteo, T., Croft, R. A. C., Springel, V., & Hernquist, L. 2003, ApJ, 593, 56
- Di Matteo et al. (2005) Di Matteo, T., Springel, V., & Hernquist, L. 2005, Nature, 433, 604
- Draine (2011) Draine, B. T. 2011, Physics of the Interstellar and Intergalactic Medium
- Dressler & Sandage (1983) Dressler, A., & Sandage, A. 1983, ApJ, 265, 664
- Fabello et al. (2011) Fabello, S., Kauffmann, G., Catinella, B., Giovanelli, R., Haynes, M. P., Heckman, T. M., & Schiminovich, D. 2011, MNRAS, 416, 1739
- Fabian (1999) Fabian, A. C. 1999, MNRAS, 308, L39
- Ferrarese (2002) Ferrarese, L. 2002, ApJ, 578, 90
- Ferrarese & Merritt (2000) Ferrarese, L., & Merritt, D. 2000, ApJ, 539, L9
- Fisher (1997) Fisher, D. 1997, AJ, 113, 950
- Franx & de Zeeuw (1992) Franx, M., & de Zeeuw, T. 1992, ApJ, 392, L47
- Gebhardt et al. (2001) Gebhardt, K., et al. 2001, AJ, 122, 2469
- Gebhardt et al. (2003) —. 2003, ApJ, 583, 92
- Greene et al. (2010) Greene, J. E., Peng, C. Y., Kim, M., Kuo, C.-Y., Braatz, J. A., Impellizzeri, C. M. V., Condon, J. J., Lo, K. Y., Henkel, C., & Reid, M. J. 2010, ApJ, 721, 26
- Greene et al. (2013) Greene, J. E., Seth, A., den Brok, M., Braatz, J. A., Henkel, C., Sun, A.-L., Peng, C. Y., Kuo, C.-Y., Violette Impellizzeri, C. M., & Lo, K. Y. 2013, ApJ, 771, 121
- Guhathakurta et al. (1988) Guhathakurta, P., van Gorkom, J. H., Kotanyi, C. G., & Balkowski, C. 1988, AJ, 96, 851
- Gültekin et al. (2011) Gültekin, K., Tremaine, S., Loeb, A., & Richstone, D. O. 2011, ApJ, 738, 17
- Gültekin et al. (2009) Gültekin, K., et al. 2009, ApJ, 698, 198
- Halliday et al. (2001) Halliday, C., Davies, R. L., Kuntschner, H., Birkinshaw, M., Bender, R., Saglia, R. P., & Baggley, G. 2001, MNRAS, 326, 473
- Häring & Rix (2004) Häring, N., & Rix, H.-W. 2004, ApJ, 604, L89
- Hirschmann et al. (2010a) Hirschmann, M., Khochfar, S., Burkert, A., Naab, T., Genel, S., & Somerville, R. S. 2010a, MNRAS, 407, 1016
- Hirschmann et al. (2010b) —. 2010b, MNRAS, 407, 1016
- Ho (2007) Ho, L. C. 2007, ApJ, 668, 94
- Ho et al. (2008) Ho, L. C., Darling, J., & Greene, J. E. 2008, ApJ, 681, 128
- Hopkins et al. (2006) Hopkins, P. F., Hernquist, L., Cox, T. J., Di Matteo, T., Robertson, B., & Springel, V. 2006, ApJS, 163, 1
- Jahnke & Macciò (2011) Jahnke, K., & Macciò, A. V. 2011, ApJ, 734, 92
- Jones et al. (1999) Jones, K. L., Koribalski, B. S., Elmouttie, M., & Haynes, R. F. 1999, MNRAS, 302, 649
- Kent (1990) Kent, S. M. 1990, AJ, 100, 377
- Knapp et al. (1985) Knapp, G. R., van Driel, W., & van Woerden, H. 1985, A&A, 142, 1
- Kormendy & Bender (2011) Kormendy, J., & Bender, R. 2011, Nature, 469, 377
- Kormendy et al. (2010) Kormendy, J., Drory, N., Bender, R., & Cornell, M. E. 2010, ApJ, 723, 54
- Kormendy & Ho (2013) Kormendy, J., & Ho, L. C. 2013, ARA&A, in press (ArXiv:1304.7762)
- Krajnović et al. (2006) Krajnović, D., Cappellari, M., de Zeeuw, P. T., & Copin, Y. 2006, MNRAS, 366, 787
- Kronawitter et al. (2000) Kronawitter, A., Saglia, R. P., Gerhard, O., & Bender, R. 2000, A&AS, 144, 53
- Kuo et al. (2011) Kuo, C. Y., Braatz, J. A., Condon, J. J., Impellizzeri, C. M. V., Lo, K. Y., Zaw, I., Schenker, M., Henkel, C., Reid, M. J., & Greene, J. E. 2011, ApJ, 727, 20
- Kuo et al. (2008) Kuo, C.-Y., Lim, J., Tang, Y.-W., & Ho, P. T. P. 2008, ApJ, 679, 1047
- Lindblad et al. (1997) Lindblad, P. A. B., Kristen, H., Joersaeter, S., & Hoegbom, J. 1997, A&A, 317, 36
- Lodato & Bertin (2003) Lodato, G., & Bertin, G. 2003, A&A, 398, 517
- Marconi & Hunt (2003) Marconi, A., & Hunt, L. K. 2003, ApJ, 589, L21
- McConnell & Ma (2013) McConnell, N. J., & Ma, C.-P. 2013, ApJ, 764, 184
- Miralda-Escudé & Kollmeier (2005) Miralda-Escudé, J., & Kollmeier, J. A. 2005, ApJ, 619, 30
- Mundell et al. (1995) Mundell, C. G., Pedlar, A., Axon, D. J., Meaburn, J., & Unger, S. W. 1995, MNRAS, 277, 641
- Murphy et al. (2011) Murphy, J. D., Gebhardt, K., & Adams, J. J. 2011, ApJ, 729, 129
- Murray et al. (2005) Murray, N., Quataert, E., & Thompson, T. A. 2005, ApJ, 618, 569
- Navarro et al. (1996) Navarro, J. F., Frenk, C. S., & White, S. D. M. 1996, ApJ, 462, 563
- Neumayer & Walcher (2012) Neumayer, N., & Walcher, C. J. 2012, Advances in Astronomy, 2012
- Noordermeer et al. (2007) Noordermeer, E., van der Hulst, J. M., Sancisi, R., Swaters, R. S., & van Albada, T. S. 2007, MNRAS, 376, 1513
- Novak et al. (2006) Novak, G. S., Faber, S. M., & Dekel, A. 2006, ApJ, 637, 96
- Ostriker et al. (2010) Ostriker, J. P., Choi, E., Ciotti, L., Novak, G. S., & Proga, D. 2010, ApJ, 722, 642
- Paturel et al. (2003) Paturel, G., Theureau, G., Bottinelli, L., Gouguenheim, L., Coudreau-Durand, N., Hallet, N., & Petit, C. 2003, A&A, 412, 57
- Pellegrini et al. (1997) Pellegrini, S., Held, E. V., & Ciotti, L. 1997, MNRAS, 288, 1
- Peng (2007) Peng, C. Y. 2007, ApJ, 671, 1098
- Pizzella et al. (2005) Pizzella, A., Corsini, E. M., Dalla Bontà, E., Sarzi, M., Coccato, L., & Bertola, F. 2005, ApJ, 631, 785
- Reid et al. (2009) Reid, M. J., Braatz, J. A., Condon, J. J., Greenhill, L. J., Henkel, C., & Lo, K. Y. 2009, ApJ, 695, 287
- Reid et al. (2013) Reid, M. J., Braatz, J. A., Condon, J. J., Lo, K. Y., Kuo, C. Y., Impellizzeri, C. M. V., & Henkel, C. 2013, ApJ, 767, 154
- Roberts (1978) Roberts, M. S. 1978, AJ, 83, 1026
- Roberts & Haynes (1994) Roberts, M. S., & Haynes, M. P. 1994, ARA&A, 32, 115
- Robertson et al. (2006) Robertson, B., Hernquist, L., Cox, T. J., Di Matteo, T., Hopkins, P. F., Martini, P., & Springel, V. 2006, ApJ, 641, 90
- Schiminovich et al. (1994) Schiminovich, D., van Gorkom, J. H., van der Hulst, J. M., & Kasow, S. 1994, ApJ, 423, L101
- Scorza & Bender (1995) Scorza, C., & Bender, R. 1995, A&A, 293, 20
- Shostak (1987) Shostak, G. S. 1987, A&A, 175, 4
- Silk & Rees (1998) Silk, J., & Rees, M. J. 1998, A&A, 331, L1
- Sofue et al. (1997) Sofue, Y., Tutui, Y., Honma, M., & Tomita, A. 1997, AJ, 114, 2428
- Tremaine et al. (2002) Tremaine, S., et al. 2002, ApJ, 574, 740
- Valluri et al. (2005) Valluri, M., Ferrarese, L., Merritt, D., & Joseph, C. L. 2005, ApJ, 628, 137
- van der Marel & Franx (1993) van der Marel, R. P., & Franx, M. 1993, ApJ, 407, 525
- Volonteri & Natarajan (2009) Volonteri, M., & Natarajan, P. 2009, MNRAS, 400, 1911
- Volonteri et al. (2011) Volonteri, M., Natarajan, P., & Gültekin, K. 2011, ApJ, 737, 50
- Wechsler et al. (2002) Wechsler, R. H., Bullock, J. S., Primack, J. R., Kravtsov, A. V., & Dekel, A. 2002, ApJ, 568, 52
- Young & Lo (1997) Young, L. M., & Lo, K. Y. 1997, ApJ, 476, 127
| Galaxy | Date | Flux Cal. | Phase Cal. | Antennas | RFI | |||
|---|---|---|---|---|---|---|---|---|
| (UTC) | (degrees) | (minutes) | (minutes) | |||||
| (1) | (2) | (3) | (4) | (5) | (6) | (7) | (8) | (9) |
| NGC 1194 | 2010 Oct 8 | 3C48 | J03230534 | 8.3 | 212 | 26.6 | 22 | Yes |
| NGC 2748 | 2010 Oct 10 | 3C147 | J08417053 | 6.0 | 217 | 24.6 | 22 | No |
| NGC 2960 | 2010 Nov 19 | 3C286 | J09430819 | 11.9 | 210 | 26.3 | 25 | Yes |
| NGC 7582 | 2010 Dec 4/5 | 3C48 | J23264027 | 2.5 | 200 | 19.9 | 23 | Yes |
| UGC 3789 | 2010 Oct 7 | 3C147 | J06146046 | 8.2 | 198 | 22.0 | 22 | No |
Note. — Col. (1): Galaxy name. Col. (2): Observation date. Col. (3): The flux and bandpass calibrator. Col. (4): The phase calibrator. Col. (5): The angular separation between the source (galaxy) and the phase calibrator. Col. (6): Total on-source observation time. Col. (7): Average length of each source scan, which is the separation between two phase calibrator scans. Col. (8): Number of antennas used in the observation. Some antennas were not used because the L-band receiver was not yet installed or because the antenna had unstable or noisy data quality. Col. (9): Whether or not radio frequency interference (RFI) was found in the data. The RFI was visually inspected and flagged. After the flagging, there was negligible or minor contamination from RFI in the data cube. The most severe case was NGC 1194, where some faint elongated stripes parallel to the galaxy can be seen.
| Galaxy | Distance | Channel Width | Weighting | Noise | Peak | Beam FWHM | Beam P.A. | SNR |
|---|---|---|---|---|---|---|---|---|
| (Mpc) | (km s-1) | (mJy beam-1) | (mJy beam-1) | (arcsecarcsec) | (degrees) | |||
| (1) | (2) | (3) | (4) | (5) | (6) | (7) | (8) | (9) |
| NGC 2748 | 24.9 | 10 | Robust0.5 | 0.58 | 21.98 | 1913 | 45 | 38 |
| NGC 7582 | 22.3 | 10 | Robust0.5 | 0.81 | 18.99 | 5213 | 0 | 23 |
| NGC 1194 | 55.5 | 20 | Natural | 0.41 | 5.80 | 2316 | 14 | |
| NGC 2960 | 75.3 | 20 | Natural | 0.37 | 2.29 | 1918 | 6 | |
| UGC 3789 | 48.4 | 20 | Natural | 0.58 | 3.42 | 2516 | 73 | 6 |
Note. — Col. (1): Galaxy name. Col. (2): Distance of the galaxy. For consistency, we adopt distances from McConnell & Ma (2013), which is used for measurements listed in Tab. 5. Col. (3): The binned channel (or image plane) width. The channel width of NGC 2748 and NGC 7582 are set to be smaller because of their higher signal-to-noise ratio. Col. (4): The imaging weighting method. Col. (5): The RMS noise level in each image plane measured in line-free channels. Col. (6): The peak intensity in the data cube. Col. (7): The clean beam full-width-half-maximum of the major and minor axes. Col. (8): The clean beam position angle. Col. (9): The signal-to-noise ratio, defined by the maximum intensity per channel divided by the RMS noise.
| Galaxy | P.A. | ||||
|---|---|---|---|---|---|
| (R.A.) | (Dec) | (km s-1) | (degrees) | (degrees) | |
| (1) | (2) | (3) | (4) | (5) | (6) |
| NGC 2748 | 1482 | 72.6 | 35.5 | ||
| NGC 7582 | 1588 | 67.9 | 153.7 | ||
| NGC 1194 | 4075 | 69.1 | 142.8 | ||
| NGC 2960 | 4939 | 41.5* | 49.5 | ||
| UGC 3789 | 3229 | 43.2* | 164.7* |
Note. — The rotating-disk model parameters as described in section 3.3. Col. (1): Galaxy name. Col. (2,3): Center position. For NGC 2748 and NGC 7582 the center position is the fitted H I kinematical center with fitting error . For the megamaser galaxies (NGC 1194, NGC 2960, and UGC 3789) the center is fixed at the maser position (Kuo et al., 2011). Col. (4): Fitted systemic velocity. The random error from fitting is less than 0.1, including determining the center for NGC 2748 and NGC 7582, which have no megamaser positions. Col. (5): Fitted inclination angle, except for NGC 2960 and UGC 3789, which are fixed at HyperLeda values (Paturel et al., 2003). Col. (6): Fitted position angle, except for UGC 3789, which is fixed at HyperLeda value (Paturel et al., 2003).
| Galaxy | Method | Trend | Inc. | Reference | ||
|---|---|---|---|---|---|---|
| (km s-1) | (degrees) | |||||
| (1) | (2) | (3) | (4) | (5) | (6) | (7) |
| (Group 1) | ||||||
| Circinus | 15510 | HI | flat | 65 | 7.5 | 1 |
| Milky Way | 2002030 | HI | oscillating | 1.3 | 2 | |
| NGC 0224 | 2301550 | HI | declining | 77 | 1.7 | 2 |
| NGC 1194 | 2172128 | HI | slightly rising | 69 | 1.8 | |
| NGC 1300 | 2201510 | HI | flat | 35 | 1.6 | 3 |
| NGC 2273 | 1908 | HI | flat | 55 | 2.4 | 4 |
| NGC 2748 | 1441213 | HI | flat | 73 | 2.0 | |
| NGC 2787 | 222515 | HI | flat | 42 | 4.3 | 5 |
| NGC 2960 | 2854644 | HI | oscillating | 42 | 2.1 | |
| NGC 3031 | 1801050 | HI | slightly declining | 59 | 1.6 | 2 |
| NGC 4258 | 200810 | HI | slightly oscillating | 67 | 1.8 | 2 |
| NGC 4736 | 115555 | HI | declining | 47 | 1.9 | 6 |
| NGC 4826 | 15855 | HI | oscillating | 64 | 1.9 | 6 |
| NGC 5128a | 3082061 | HI | unknown | 47 | 1.2 | 7 |
| (Group 2) | ||||||
| NGC 3227 | 247510 | HI | flat | 56 | 0.8 | 8 |
| NGC 3245 | 2112020 | optical | flat | 62 | 0.6 | 9 |
| NGC 4526 | 2904050 | optical | flat | 90 | 0.6 | 10 |
| NGC 4594 | 3562020 | HI | flat | 85 | 0.8 | 11 |
| NGC 4596 | 2303050 | optical | flat | 38 | 0.7 | 12 |
| NGC 7457 | 1401020 | optical | rising | 73 | 0.7 | 9 |
| NGC 7582 | 1872115 | HI | slightly declining | 68 | 0.6 | |
| UGC 3789 | 1603310 | HI | rising | 43 | 0.6 | |
| (Group 3) Flat | ||||||
| NGC 1023 | 256300 | optical | flat | 76 | 0.5 | 13 |
| NGC 1332 | 2292010 | optical | flat | 80 | 0.4 | 13 |
| NGC 2549 | 1021013 | optical | flat | 90 | 0.4 | 13 |
| NGC 3115 | 31510 | optical | flat | 50 | 0.3 | 14 |
| NGC 3585 | 28020 | optical | flat | 90 | 0.2 | 15 |
| NGC 4388 | 23023 | HI | flat | 74 | 0.3 | 16 |
| NGC 4564 | 1301025 | optical | flat | 90 | 0.4 | 17 |
| (Group 4) Rising | ||||||
| NGC 1068 | 2835860 | optical | rising | 46 | 0.5 | 2 |
| NGC 3384b | 1771656 | optical | rising | 62 | 0.2 | 18 |
| NGC 3998c | 2854057 | HI | unknown | 70 | 0.5 | 19 |
| NGC 4026 | 1701030 | optical | rising | 90 | 0.5 | 13 |
Note. — Circular velocity for the primary sample with both dynamical and rotation curve . Galaxies are grouped according to their spatial extension and rotation curve variation as an indication of reliability. Only Groups (1) and (2) are used to constrain the relation, while Groups (3) and (4) are excluded, as they may suffer from uncertainties due to short spatial extension. Col. (1): Galaxy name. Col. (2): Circular velocity of the galaxy with reference in Col. (7). The first error is the observational error. 10 observational error is assumed if it is not presented in the literature. The second one is the variation of the rotation curve or 20 if the variation is unknown. is evaluated at the outermost radius . Col. (3): The observational method of rotation curve measurement. Col. (4): Radial trends in the rotation curve. Col. (5): Inclination angle adopted for the inclination correction. If the rotation curve is not inclination-corrected in the literature, the optical inclination from HyperLeda (Paturel et al., 2003) is applied. Col. (6): Ratio between the outermost radius , at which is evaluated, and the galaxy radius at the B = 25 mag arcsec-2 isophote from RC2 (de Vaucouleurs et al., 1995). Col. (7): References for : (1) Jones et al. (1999); (2) Sofue et al. (1997); (3) Lindblad et al. (1997); (4) Noordermeer et al. (2007); (5) Shostak (1987); (6) deBlok et al. (2008); (7) Schiminovich et al. (1994); (8) Mundell et al. (1995); (9) Cherepashchuk et al. (2010); (10) Pellegrini et al. (1997); (11) Bajaja et al. (1984); (12) Kent (1990); (13) Dressler & Sandage (1983); (14) Bender et al. (1994); (15) Scorza & Bender (1995); (16) Guhathakurta et al. (1988); (17) Halliday et al. (2001); (18) Fisher (1997); (19) Knapp et al. (1985); ( ) is from this paper. Notes on individual galaxies:
a is estimated from H I velocity field as rotation curve is unavailable.
b The inclination is estimated by the ratio of the minor/major axes () from RC3 (de Vaucouleurs et al., 1991).
c was estimated by Knapp et al. (1985) to be adopting an inclination larger than 70∘, while rotation curve is not available.
| Galaxy | Morphology | Distance | Method | Method | |||
|---|---|---|---|---|---|---|---|
| (Mpc) | () | (km s-1) | (km s-1) | ||||
| (1) | (2) | (3) | (4) | (5) | (6) | (7) | (8) |
| (Group 1) | |||||||
| Circinus | S | 4.0 | masers | H I | |||
| Milky Way | S | 0.008 | stars | H I | |||
| NGC 0224 | S | 0.73 | stars | H I | |||
| NGC 1194a | S0 | 55.5 | masers | H I | |||
| NGC 1300 | S | 20.1 | gas | H I | |||
| NGC 2273a | S | 26.8 | masers | H I | |||
| NGC 2748b | S | 24.9 | gas | H I | |||
| NGC 2787 | S0 | 7.5 | gas | H I | |||
| NGC 2960a | S | 75.3 | masers | H I | |||
| NGC 3031 | S | 4.1 | gas | H I | |||
| NGC 4258 | S | 7.0 | masers | H I | |||
| NGC 4736 | S | 5.0 | stars | H I | |||
| NGC 4826 | S | 7.3 | stars | H I | |||
| NGC 5128 | S0/E | 4.1 | stars | H I | |||
| (Group 2) | |||||||
| NGC 3227 | S | 17.0 | stars | H I | |||
| NGC 3245 | S0 | 21.5 | gas | optical | |||
| NGC 4526c | S0 | 16.4 | gas | optical | |||
| NGC 4594 | S | 10.0 | stars | H I | |||
| NGC 4596 | S0 | 18.0 | gas | optical | |||
| NGC 7457b | S0 | 12.2 | stars | optical | |||
| NGC 7582 | S | 22.3 | gas | H I | |||
| UGC 3789a | S | 48.4 | masers | H I | |||
| (Group 3) Flat | |||||||
| NGC 1023 | S0 | 10.5 | stars | optical | |||
| NGC 1332 | S0 | 22.7 | stars | optical | |||
| NGC 2549 | S0 | 12.7 | stars | optical | |||
| NGC 3115 | S0 | 9.5 | stars | optical | |||
| NGC 3585 | S0 | 20.6 | stars | optical | |||
| NGC 4388d | S | 19.8 | masers | H I | |||
| NGC 4564 | S0 | 15.9 | stars | optical | |||
| (Group 4) Rising | |||||||
| NGC 1068b | S | 15.4 | masers | optical | |||
| NGC 3384 | E | 11.5 | stars | optical | |||
| NGC 3998 | S0 | 14.3 | stars | H I | |||
| NGC 4026 | S0 | 13.4 | stars | optical | |||
Note. — Black hole masses, stellar velocity dispersions and circular velocities of our primary sample. These quantities are plotted in Figure 8 with error bars symmetrized in log space. Col. (1): Galaxy Name. Col. (2): Morphology. Col. (3): Distance. Col. (4): Black hole mass measured by method in Col. (5):. Col. (6): Stellar velocity dispersion. Col. (2-6) are taken from McConnell & Ma (2013), unless otherwise noted. Col. (7): Circular velocity with error taken as the larger one of observational or rotation curve variation error, for more detail see Table 4. Col. (8): Method of observation. Notes on individual galaxies:
a Black hole mass uncertainty of , which is dominated by the error of the distance, is adopted as suggested in Kuo et al. (2011). Note that this error is different from what is listed in McConnell & Ma (2013).
b These black hole mass measurements are noted in McConnell & Ma (2013) as complicated and are excluded in their paper. More discussion and the references can be found in Section 4.1.2.
c The black hole mass is from Davis et al. (2013) using molecular gas dynamics.
d Same as footnote but black hole mass uncertainty of is adopted.
| Sample | Criteria | n | ||||
|---|---|---|---|---|---|---|
| (1) | (2) | (3) | (4) | (5) | (6) | (7) |
| Group 1, 2 | 22 | |||||
| Group 1, 2 | 22 | |||||
| Group 1 | 14 | |||||
| Group 1, 2, 3 | 29 | |||||
| Group 1, 2, 3, 4 | all Primary Sample | 33 |
Note. — Best-fit and scaling relations with model of different samples. The first two rows include only galaxies with measured rotation curves extending beyond and are used for our to comparison. Col. (1): The axis of the relation. Col. (2-3): The sample and the sample criteria used in fitting, see Table 4. Col. (4): Number of galaxies in the sample. Col. (5): Best-fit intercept . Col. (6): Slope . Col. (7): Intrinsic scatter .
| Galaxy | MB | |||
|---|---|---|---|---|
| (Jy km s-1) | () | (mag) | () | |
| (1) | (2) | (3) | (4) | (5) |
| NGC 2748 | 37.4 5.4 | 5.47 1.35 | -20.33 | 0.26 |
| NGC 7582 | 19.6 2.8 | 2.30 0.57 | -20.70 | 0.08 |
| NGC 1194 | 7.14 1.07 | 5.19 1.30 | -20.36 | 0.24 |
| NGC 2960 | 2.18 0.28 | 2.92 0.69 | -20.76 | 0.09 |
| UGC 3789 | 1.26 0.38 | 0.70 0.25 | -20.50 | 0.03 |
Note. — The H I flux, H I mass, and ratios of our five observed galaxies, described in Section A.1. Col. (1): Galaxy name. Col. (2): H I fluxes from our VLA observation. Col. (3): Inferred H I masses from the flux, adopting distances from McConnell & Ma (2013) as given in Table 2. A distance error of 10 is assumed. Col. (4): Absolute B-band magnitude corrected for extinction from HyperLeda (Paturel et al., 2003). Col. (5): H I mass to B-band luminosity ratio, derived from Col. (3) and Col. (4).
| Galaxy | Method | Trend | Inc. | Reference | ||
|---|---|---|---|---|---|---|
| (km s-1) | (degrees) | |||||
| (1) | (2) | (3) | (4) | (5) | (6) | (7) |
| Dynamical with Single dish | ||||||
| NGC 3368 | 2036 | SD | 49 | 2 | ||
| NGC 3393 | 1578 | SD | 31 | 1 | ||
| NGC 3489 | 14414 | SD | 65 | 2 | ||
| Upper-limit | ||||||
| IC 0342 | 19015 | RC | flat | 25 | 1.6 | 3 |
| NGC 0205a | 2635 | V-field | unknown | 90 | 0.2 | 4 |
| NGC 0300 | 803 | SD | 2 | |||
| NGC 0428 | 1803050 | optical | oscillating | 48 | 1.3 | 5 |
| NGC 0598 | 1351335 | RC | rising | 50 | 1.8 | 6 |
| NGC 1042 | 578 | SD | 2 | |||
| NGC 2139 | 1313 | SD | 2 | |||
| NGC 3423 | 1203 | SD | 2 | |||
| NGC 3621 | 15226 | RC | flat | 65 | 2.7 | 7 |
| NGC 5457 | 1951040 | RC | declining | 18 | 0.5 | 3 |
| NGC 6503 | 11625 | RC | flat | 74 | 1.9 | 8 |
| NGC 7418 | 1284 | SD | 2 | |||
| NGC 7424 | 1133 | SD | 2 | |||
| NGC 7793 | 102526 | RC | slightly declining | 42 | 1.3 | 7 |
Note. — reliability for the secondary sample. Col. (1): Galaxy name. Col. (2): Circular velocity of the galaxy with reference in col. (7). The first error is the observational error. For rotation curve the second error is the variation in the rotation curve or 20 if the variation is unknown. For rotation curves, is evaluated at the outermost radius . Col. (3): The observational method used to derive . RC stands for spatially resolved rotation curve, and SD for H I single dish observation. Col. (4): Radial trend in the rotation curve. Col. (5): Inclination used for inclination correction. Col. (6): Ratio between the outermost radius and the galaxy radius at B = 25 mag arcsec-2 isophote from RC2 (de Vaucouleurs et al., 1995). Col. (7): References for : (1) HyperLeda (Paturel et al., 2003); (2) Ho (2007); (3) Sofue et al. (1997); (4) Young & Lo (1997); (5) Cherepashchuk et al. (2010); (6) Corbelli & Salucci (2000); (7) deBlok et al. (2008); (8) Begeman et al. (1991). Notes on individual galaxies:
a is estimated from the H I velocity field as a rotation curve is unavailable.
| Galaxy | Morphology | Distance | Method | Ref. | Method | |||
|---|---|---|---|---|---|---|---|---|
| (Mpc) | () | (km s-1) | (km s-1) | |||||
| (1) | (2) | (3) | (4) | (5) | (6) | (7) | (8) | (9) |
| Dynamical with Single dish | ||||||||
| NGC 3368 | S | 10.6 | stars | 1 | SD | |||
| NGC 3393 | S | 53.6 | masers | 1 | SD | |||
| NGC 3489 | S0 | 12.0 | stars | 1 | SD | |||
| Upper-limit | ||||||||
| IC 0342 | S | 1.8 | stars | 2 | RC | |||
| NGC 0205 | E (dwarf) | 0.74 | stars | 3 | V-field | |||
| NGC 0300 | S | 2.2 | stars | 4 | SD | |||
| NGC 0428 | S | 16.1 | stars | 4 | optical | |||
| NGC 0598 | S | 0.8 | stars | 5 | RC | |||
| NGC 1042 | S | 18.2 | stars | 4 | SD | |||
| NGC 2139 | S | 23.6 | stars | 4 | SD | |||
| NGC 3423 | S | 14.6 | stars | 4 | SD | |||
| NGC 3621 | S | 6.6 | stars | 6 | RC | |||
| NGC 5457 | S | 7.0 | stars | 7 | RC | |||
| NGC 6503 | S | 5.27 | stars | 7 | RC | |||
| NGC 7418 | S | 18.4 | stars | 4 | SD | |||
| NGC 7424 | S | 10.9 | stars | 4 | SD | |||
| NGC 7793 | S | 3.3 | stars | 4 | RC | |||
Note. — Black hole masses, stellar velocity dispersions, and circular velocities of our secondary sample for either H I single dish or upper-limits for . These quantities are plotted in Figure 8 in grey with error bars symmetrized in log space. Col. (1): Galaxy Name. Col. (2): Morphology. Col. (3): Distance. Col. (4): Black hole mass measured by method col. (5): from reference col. (6). Col. (7): Stellar velocity dispersion. For the first section (single-dish ) Col. (2-7) are taken from McConnell & Ma (2013) and original references can be found therein. For the second section ( upper-limits) Col. (2-3) are from McConnell & Ma (2013) and Col. (4, 5, 7) are from the references listed in Col. (6). Col. (8): Circular velocity with error taken as the larger one of observational or RC variation error (see Table 8). Col. (9): The observational method of . SD stands for spatially unresolved single dish , RC for H I rotation curve , H I V-field for spatially resolved data but unavailable rotation curves, and optical for optical rotation curves. References: (1) McConnell & Ma (2013); (2) Böker et al. (1999); (3) Valluri et al. (2005); (4) Neumayer & Walcher (2012); (5) Gebhardt et al. (2001); (6) Barth et al. (2009); (7) Kormendy et al. (2010)