Chemical modeling of the L1498 and L1517B
prestellar cores:
CO and HCO+ depletion††thanks: Based on
observations carried out with the IRAM 30m Telescope. IRAM is
supported by INSU/CNRS (France), MPG (Germany) and IGN (Spain).
Prestellar cores exhibit a strong chemical differentiation, which is mainly caused by the freeze-out of molecules onto the grain surfaces. Understanding this chemical structure is important, because molecular lines are often used as probes to constrain the core physical properties. Here we present new observations and analysis of the C18O (1-0) and H13CO+ (1-0) line emission in the L1498 and L1517B prestellar cores, located in the Taurus-Auriga molecular complex. We model these observations with a detailed chemistry network coupled to a radiative transfer code. Our model successfully reproduces the observed C18O (1-0) emission for a chemical age of a few 105 years. On the other hand, the observed H13CO+ (1-0) is reproduced only if cosmic-ray desorption by secondary photons is included, and if the grains have grown to a bigger size than average ISM grains in the core interior. This grain growth is consistent with the infrared scattered light (”coreshine”) detected in these two objects, and is found to increase the CO abundance in the core interior by about a factor four. According to our model, CO is depleted by about 2-3 orders of magnitude in the core center.
Key Words.:
Astrochemistry – ISM: abundances – ISM: individual (L1498) – ISM: individual (L1517B) – ISM: molecules – Stars: formation1 Introduction
Prestellar cores represent the earliest stage in the formation of a star. The study of their physical properties, such as their density, temperature and kinematics, is therefore important to determine how they form and evolve, and in turn to place constraints on star formation theories. Molecular lines are often used to derive core physical properties (see e.g. Bergin & Tafalla 2007). However, because the core interior is dense ( cm-3, e.g. Alves et al. 2001; Tafalla et al. 2002) and cold ( K; Bergin et al. 2006; Crapsi et al. 2007), most species freeze-out on dust grains. This causes a strong chemical differentiation, with the outer layers of the cores being relatively undepleted, and the abundances of heavy species in the central regions being, on the other hand, reduced by up to several orders of magnitude (Caselli et al. 1999; Tafalla et al. 2002, 2004; Bergin et al. 2002). Not all species are sensitive to depletion: for example, some nitrogen-bearing species such as N2H+ and NH3 appear to remain longer in the gas phase (Bergin et al. 2002; Maret et al. 2006; Tafalla et al. 2006). A consequence of the depletion of the heavy species is an abundance increase of deuterated species (Bacmann et al. 2003; Pagani et al. 2007). In order to use molecular lines as “probes” of the physical conditions in the core interiors, it is necessary to first understand their chemical structure. In addition, the amount of depletion should increase with the core age. Therefore the chemical structure of a core could in principle be used to constrain the core age (see e.g. Bergin et al. 2002).
L1498 and L1517B are two prestellar cores located in the Taurus-Auriga complex. Because of their close-to-round shapes, these two cores have been studied extensively by Tafalla et al. (2004, 2006), who mapped their dust continuum emission as well as several lines. Tafalla et al. modeled the dust continuum emission finding that their density distribution is consistent with that of isothermal spheres at (or close to) equilibrium. In addition, these authors constrained the gas temperature from NH3 rotation-inversion lines and non-thermal line widths from several other lines, and concluded that thermal support dominates over turbulent support. Kirk et al. (2006) measured the magnetic field in these two cores from dust polarization measurements and found that thermal support also dominates over the magnetic plus turbulent support. In addition, Tafalla et al. (2006) carried out a molecular survey of L1498 and L1517B, suggesting that the majority of species (CO, CS, CH3OH, HCO+, etc.) with the exception of NH3 and N2H+ are depleted in the core interiors. They modeled the emission of these lines assuming simple abundance profiles (step functions), and found that most species present sharp central holes.
In this paper, we present new observations of the C18O (1-0) and H13CO+ (1-0) emission in these two cores. We attempt to match these observations with a time-dependent chemical model (including depletion and carbon fractionation) coupled to a non-LTE radiative transfer code, with the aim of deriving the core chemical structure and to place constraints on the core age. The paper is organized as follows. Observations are presented in § 2. The model used to interpret the observations is detailed in § 3. Our results are presented in § 4 and the implications of these findings are discussed in § 5. Finally § 6 concludes the article.
2 Observations and data reduction
We observed L1498 and L1517B in June 2012 with the IRAM 30m telescope under average summer weather conditions. The C18O (1-0) and H13CO+ (1-0) line emission (109.78 and 86.75 GHz, respectively) were mapped over a region in each core (except for the C18O (1-0) map in L1498 which is ) centered on and for L1498, and on and (J2000) for L1517B. These maps were obtained in on-the-fly mode with position-switching, with a reference position offset with respect to the map center of (-10′;-10′) for L1498, and (0′;+10′) in L1517B. We checked that the reference positions were free of C18O (1-0) and H13CO+ (1-0) emission using frequency switching mode observations. The EMIR receivers were used together with the VESPA autocorrelator. A separate receiver setting was used for the two lines. Typical system temperatures were 100 K and 150 K for the H13CO+ (1-0) and C18O (1-0) receiver settings, respectively. The autocorrelator was set to a spectral resolution of 6.6 kHz for both lines, i.e. about km s-1 in velocity. Observations were corrected for atmospheric transmission using the standard chopper wheel technique. Pointing was checked regularly on Uranus and strong quasars, and its RMS accuracy was found to be 2″. The beam size of the IRAM 30m telescope is 28″ and 22″ for H13CO+ (1-0) and C18O (1-0), respectively.
Data reduction was done using the CLASS package, part of the GILDAS software suite111http://www.iram.fr/IRAMFR/GILDAS. After removing a polynomial baseline on each spectrum, the data were gridded to produce spectral data cubes. In order to improve the signal-to-noise ratio, the data were re-sampled at a spatial resolution of 35″ and 30″ for H13CO+ (1-0) and C18O (1-0), respectively. In addition, the data were re-sampled at a spectral resolution of km s-1 for both lines. The noise per channel on the final data cubes is 80 mK for H13CO+ (1-0), and 140 mK for C18O (1-0). The data were then converted to main beam temperature scale assuming a beam efficiency of 0.81 and a forward efficiency of 0.95 for both lines, as recommended on the IRAM website. Finally, the velocity channels were summed in order to produce velocity integrated maps.
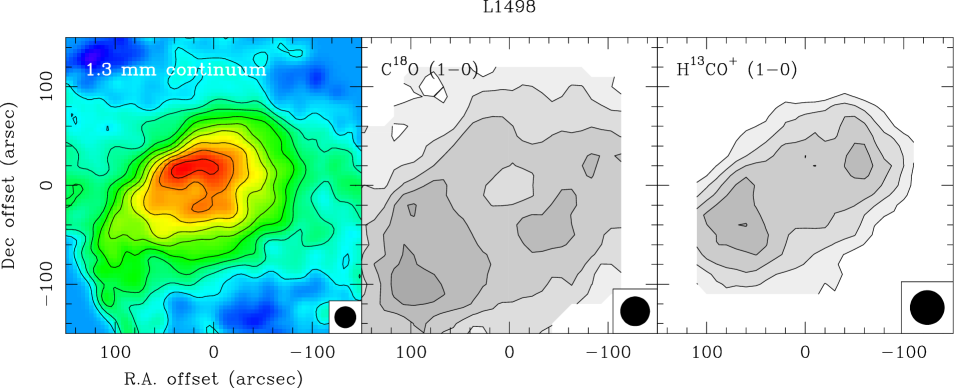
Figure 1 shows the C18O (1-0) and H13CO+ (1-0) line maps we obtained for L1498, together with the 1.3 mm continuum from Tafalla et al. (2004). In the continuum map, the core has an ellipsoidal shape with the major axis oriented along the Southeast-Northwest direction. The C18O (1-0) emission appears anti-correlated to the dust continuum emission, forming a ring-like structure that surrounds the dust peak. This is a clear indication of gas freeze-out at the center of the core. As already mentioned, such depletion “holes” have been observed in several other molecules towards L1498 and L1517B (Willacy et al. 1998; Tafalla et al. 2004, 2006), and also towards other cores such as B68 or L1544 (Caselli et al. 1999; Bergin et al. 2002; Tafalla et al. 2002). The H13CO+ (1-0) emission is somewhat similar to that of C18O (1-0): the emission is not centered on the dust continuum peak, but instead has two maxima to the Northwest and the Southeast of the core center. This is likely a result of the depletion of CO and its isotopologues, because 13CO is a parent molecule of H13CO+ (1-0).
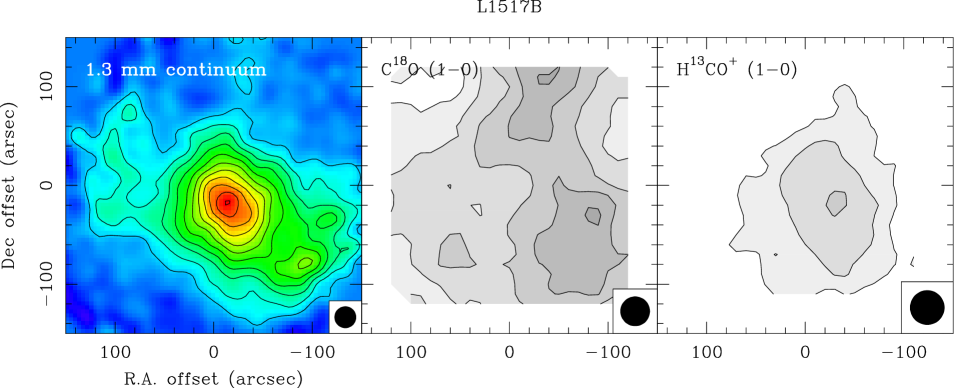
Figure 2 presents the same comparison for the L1517B core. In this core the dust emission is more compact and roundish than in L1498. Like in L1498, the C18O (1-0) emission is, to some extent, anti correlated with the dust emission: the position of the dust maximum emission corresponds to a dip in the C18O (1-0) emission. However, the C18O (1-0) emission is much more asymmetric than in L1498. In this case, most of the C18O (1-0) emission is located to the West of the core, with little emission towards the East side. The H13CO+ (1-0) emission stands in sharp contrast with the C18O (1-0) distribution: it has an elongated shape roughly centered on the dust continuum peak. Unlike in L1498, the H13CO+ (1-0) does not follow the C18O (1-0) emission, but appears somewhat anti-correlated, and closer to the dust distribution. In the following, we model C18O (1-0) and H13CO+ (1-0) line emissions in the two cores with a chemistry model coupled with a radiative transfer code.
3 Model
3.1 Physical model
We use the density profiles derived for the two cores by Tafalla et al. (2004), who modeled radial profile of the continuum emission and found that these are well reproduced by density profiles of the form:
| (1) |
where is the H2 density, the core radius, the central density, and the half maximum density radius. The values of , and they obtained for the two cores are given in Table 1. We note that these density profiles depend on the assumed dust emissivity, which is rather uncertain and may vary with the density. In addition, they depend on the assumed geometry for the cores: although the two cores appears “roundish”, the line of sight dimension of the cores may be different than that observed in the plane of the sky. However, models using these the density profiles fit a number of line observations with different critical densities, two of them being the and lines towards the core center (see Tafalla et al. 2004, Fig. 6 and 7). In addition, Keto et al. (2004) modeled the and spectra in L1517B with a detailed radiative transfer model that includes the hyperfine components of this species, and they obtained a core central density of cm-3, in good agreement with the value obtained Tafalla et al.. To the best of our knowledge, the density profiles for the two cores are consistent with all published observations. Because the two cores are embedded in an extended molecular cloud, the density profiles are truncated at AU (200″ at 140 pc) and we assume that the density remains constant between and the external radii ; the density in the region between and (hereafter the halo) is noted . The values of and are adjusted to reproduce the observed extended C18O (1-0) emission, as explained later. The cores are assumed to be isothermal with a temperature of 10 K. Furthermore the gas and the dust grains are assumed to be thermally coupled. Finally we adopt a distance of 140 pc for both sources.
| L1498 | L1517B | |
| (cm-3) | ||
| (AU) | ||
| 3.5 | 2.5 | |
| (AU) | ||
| (AU) | ||
| (cm-3) |
We assume the cores to be static and we do not consider any temporal variation of the density and temperature profiles. Tafalla et al. (2004) measured the non-thermal line width in L1498 and L1517B from hyperfine fits of the NH3 and N2H+ lines, and they did not find any systematic variation as a function of offset from the core centers. Therefore we assume a constant turbulent velocity with zero velocity gradient. This turbulent velocity is adjusted in order to reproduce the observed line width, as we will see below.
3.2 Chemical model
The chemical abundances are followed as a function of time and radius in core. For this, we use the astrochem code (Maret & Bergin, in prep.). This code is a time dependent gas-phase chemistry model that also includes gas grain interactions (such as freeze-out and desorption). It is similar to the code of Bergin & Langer (1997) that we used in our previous studies of B68 (Bergin et al. 2002, 2006; Maret et al. 2006; Maret & Bergin 2007; Maret et al. 2007), but it uses a faster ordinary differential equation solver (SUNDIALS; Hindmarsh et al. 2005). The code was benchmarked against the ALCHEMIC code (Semenov et al. 2010), and both were found to be in excellent agreement.
We use the 2008 version of the gas phase reaction network from the Ohio State University. This network includes over 6000 reactions involving 650 species. In order to model the H13CO+ emission, we consider the isotopic fraction of 13C through ion-neutral reactions. At low temperature, carbon fractionation occurs mostly through the following reactions (Langer et al. 1984):
| (2) |
| (3) |
For these two reactions, we use the forward and backward reaction rates at 10 K from Langer et al. (1984). For all other reactions involving carbon bearing species, we assume the same rate than for the main isotopologue reaction, multiplied by a statistical branching ratio if two of more products of the reaction contains a carbon atom. Selective CO photo-dissociation may also contribute to carbon fractionation (Lee et al. 2008). However, this process is inefficient at from where most of the observed C18O (1-0) and H13CO+ (1-0) arise, and we have therefore neglected it. Oxygen fractionation is also neglected; we merely assume that the ratio is equal to the elemental ratio. This is consistent with detailed fractionation models for similar conditions (Langer et al. 1984). In our model, we assume that ( and ; Wilson & Rood 1994).
As mentioned above, several gas grain interactions are taken into account in our model. All neutral species in the network are allowed to freeze-out on dust grains. The freeze-out rate depends both on the grain abundance and geometrical cross section. For our first models, we assume spherical dust grains with a radius of 0.1 m and composed of olivine; the influence of the grain size is investigated later in the paper. Assuming a dust to gas mass ratio of 100, this gives a grain number density of with respect to H nuclei. Grains are assumed to be thermally coupled with the gas. Both thermal, UV and cosmic-ray induced desorption are considered. For thermal and cosmic-ray desorption, we adopt the formalism developed by Hasegawa & Herbst (1993). However, for H2O and CO cosmic-ray induced desorption, we adopt the more recent results by Bringa & Johnson (2004). Thermal and cosmic-ray desorption rates depend critically on the binding energy of species on the grain mantles. For these, we use the values from Garrod & Herbst (2006). For UV desorption, we adopt the formalism of Öberg et al. (2009a, b). The photodesorption rate depends on the desorption yield, which has been measured in the laboratory only for a handful of species. For all other species, we adopt a yield of 10-3 molecule per incident UV photon. In our first models, we neglect the desorption from secondary UV photons, but their effect is also investigated later in the paper. Finally, we also consider electron attachment on grains, as well as recombination of ions onto charged grains, following Semenov et al. (2010).
The initial abundances are given in Table 2. These are essentially the same than in our previous studies (see Maret & Bergin 2007). We assume that carbon monoxide and water are pre-existing, with water in form of ices. Nitrogen is assumed to be mostly in atomic form (Maret et al. 2006), and iron is assumed to be heavily depleted (Maret & Bergin 2007). However, we use a slightly different helium abundance, equal to that of the Sun (Asplund et al. 2009). In addition, we consider the sulfur and silicon chemistry. For these two elements we adopt the atomic abundances measured in Ophiuchi (Savage & Sembach 1996), depleted by two orders of magnitude. This large depletion factor is needed to reproduce the abundance of molecular ions (see e.g. Graedel et al. 1982). S, Si and Fe, whose ionization potential is lower than that of H (13.6 eV), are assumed to be ionized. Other species are assumed to be neutral. Two important parameters of the models are the core external UV radiation field and the cosmic-ray ionization rate; these are left as free parameters and are adjusted from the observations.
| Species | Abundancea𝑎aa𝑎aAbundances are given with respect to H nuclei. |
|---|---|
| H2 | |
| He | |
| H2O ices | |
| CO | |
| 13CO | |
| N | |
| N2 | |
| S+ | |
| Si+ | |
| Fe+ | |
3.3 Radiative transfer model
In order to compute the line emission from the cores, we use the non-LTE Monte-Carlo 1D (spherical) radiative transfer-code RATRAN (Hogerheijde & van der Tak 2000). The C18O and H13CO+ abundances computed with our chemical model at each radius and time step are used as an input of the radiative transfer code. We use the Einstein coefficients and energy levels from the Cologne Molecular Database for Spectroscopy (CDMS; Müller et al. 2001). For both species the same collisional rates as for the main isotopologue are adopted. For C18O, we use the CO collisional rates with ortho and para H2 of Yang et al. (2010). Indirect measurements of the H2 ortho-to-para ratio in dense cores indicate ratios in the range (Maret & Bergin 2007; Pagani et al. 2009), and we therefore assume that all H2 is in para form. For H13CO+ we use the HCO+ collisional rates with para H2 of Flower (1999). The H13CO+ (1-0) line has an hyperfine structure that slightly broadens this line (Schmid-Burgk et al. 2004). To take this effect into account, we add a 0.133 km s-1 broadening in quadrature to the turbulent broadening, following Tafalla et al. (2006). All molecular data files were retrieved from the Leiden Atomic and Molecular Database (LAMDA; Schöier et al. 2005).
The radiative transfer model is used to produce synthetic data cubes for both the C18O (1-0) and H13CO+ (1-0) lines. These data cubes are then convolved with a 25″ and 30″ FWHM Gaussian respectively, i.e. the effective (after spatial smoothing, see § 2) resolution of our observations. Finally, the convolved data cubes are compared to the observations.
4 Results
4.1 emission
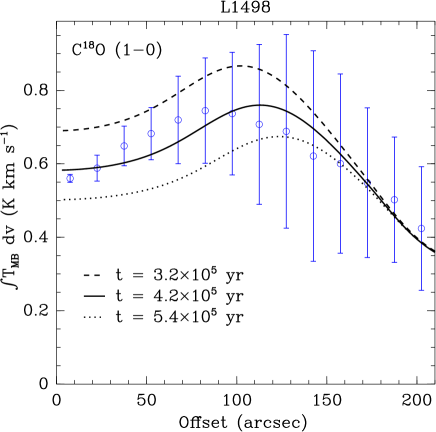
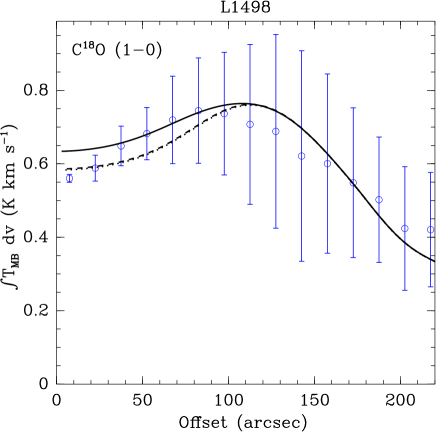
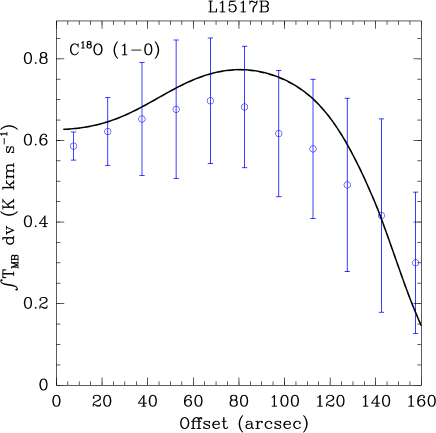
Figure 3 compares the observations of the C18O (1-0) line intensity with the predictions of our model. In this figure, we plot the integrated intensity as a function of the offset from the dust continuum peak333The continuum peak offsets from the map center are (-10″; 0) and (-15″; -15″) in L1498 and L1517B, respectively.. As mentioned in section 2, the continuum and line emission in L1498 is not circular, but it is elongated along the Southeast-Northwest direction. The C18O (1-0) line intensity is therefore averaged along ellipses with an aspect ratio of 0.6, and a position angle of -40°. In L1517B, the emission is almost spherical, and the integrated intensities are averaged radially. In order to estimate the uncertainty on the averaged intensity, we computed the standard deviation of the measured values along each ellipse (or circle). Consequently, the error bars on the data points in Fig. 3 reflect more the departure from spherical (or ellipsoidal) symmetry than the statistical noise on each data point (which is much smaller).
On the first panel of Fig 3, we see that in L1498 the averaged C18O (1-0) integrated intensity increases from 0.45 K km s-1 at an offset of 200″, up to a peak value of 0.75 K km s-1 at an offset of 100″. Closer to the core center the integrated intensity decreases to 0.55 K km s-1. This figure also shows the predictions of our fiducial model for different times in our chemical simulation444This time is named chemical age hereafter, and we discuss its the meaning in terms of core physical age in § 5.1 . This fiducial model assumes a constant grain size of 0.1 , a cosmic-ray ionization rate s-1, and neglects UV photodesorption from secondary photons. In addition, it assumes that the core is embedded in a halo with a density of cm-3, and an external radius AU (0.5 pc). This halo is needed to reproduce the extended C18O (1-0) emission. Although the density in the halo is not well constrained, our modeling indicates that it cannot exceed the critical density of the C18O (1-0) line ( cm-3). Models with higher densities produce too much emission with respect to the observations at large radii ( in Fig. 3). The corresponding visual extinction of the halo is 2.3 mag, which is consistent with the average visual extinction observed in the region of the Taurus cloud where L1498 is located (Cambrésy 1999). In addition, we have assumed that the cores are irradiated externally by a FUV field of in Habing (1968) units, that is the local average interstellar radiation field (ISRF) in the FUV. We found that the observations are well reproduced by the fiducial model for a chemical age of yr. In particular, the model reproduces the increase of the emission up to the observed peak at , and then the decrease at higher . Indeed, the observations allow us to place a stringent constraint on the core chemical age: for slightly smaller or greater ages ( and yr), the model produces too much or too little emission, respectively.
The second panel of Fig 3 presents the same comparison for L1517B. In this source, a similar pattern as in L1498 is seen: the C18O (1-0) integrated intensity increases from 0.25 K km s-1 offset of up to a peak of 0.70 K km s-1 around 70″, and then decreases down to 0.60 K km s-1 at the dust continuum position. However, the extended emission is half that of L1498. In addition, in L1517B the C18O (1-0) emission peak is located closer to the dust continuum than in L1498 (70 and 100″, respectively). Our model reproduces the observed emission reasonably well. However, we predict a peak in the C18O emission between 80 and 110″, depending on the adopted core age, which is somewhat larger than the observed emission peak (70″). However, the model allows us to precisely constrain the core chemical age, e.g. the observations at offsets smaller than 100″ are bracketed between models with and yr. The model that fits the observations the best has yr. As for L1498 we have assumed that the core is embedded in a spherical halo. The halo has the same density as in L1498 ( cm-3) but has a smaller external radius ( AU, 0.3 pc). This corresponds to an of 1.0 magnitude, again in rough agreement with Cambrésy (1999) extinction maps of the region. As for L1498, we have assumed and external ISRF of .
 |
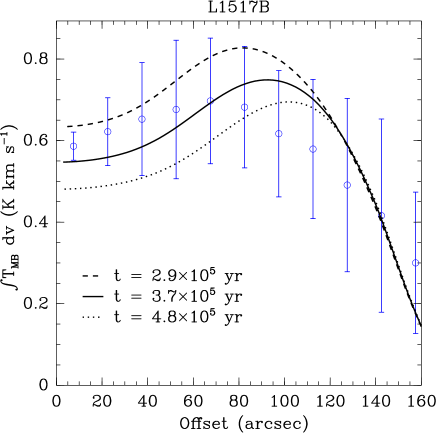 |
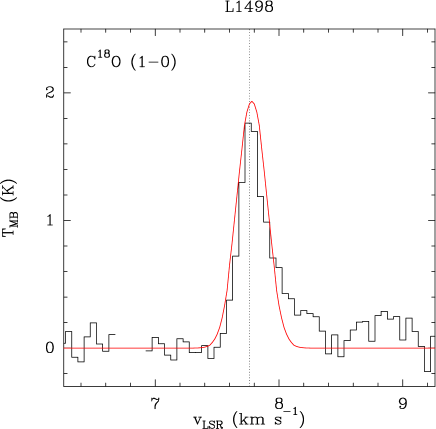
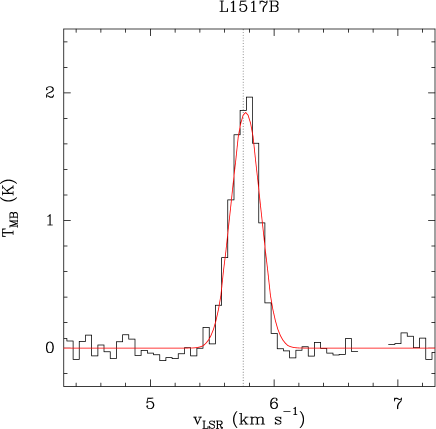
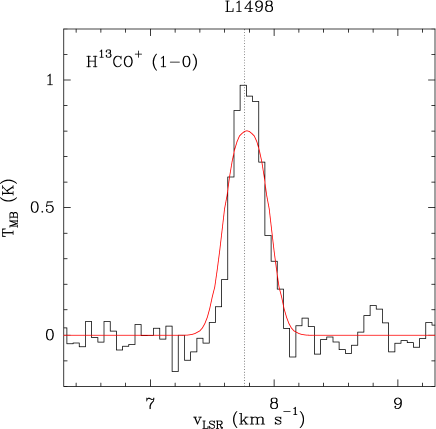
Figure 4 compares the observed line profiles with the model predictions towards the center of L1498 and L1517B. In L1498 the observed profile has a Gaussian shape peaked around 7.8 km s-1, with a red wing extending from about 8 to 8.5 km s-1. However, inspection of the channel maps indicates that this wing component has a different spatial distribution than the Gaussian component, and is probably not related to the core (see also Tafalla et al. 2006, Appendix B). Therefore this component was not included in our analysis (it was also excluded from the integrated intensities shown in Fig. 3). In L1517B the observed C18O (1-0) line profile also has a Gaussian shape, centered around 5.8 km s-1 with no wings. The latter is well reproduced by our model if one assumes a non-thermal broadening of 0.23 km s-1 (FWHM). For the same non-thermal broadening the line profile in L1498 is also reasonably well reproduced, although the model somewhat overestimates the width of the Gaussian component.
 |
 |
4.2 emission
We now attempt to model the H13CO+ (1-0) line observations in the two cores. This ion is mainly formed by the reaction of H with 13CO, and is destroyed by the dissociative recombination with free electrons. Our C18O (1-0) analysis places constraints on the C18O abundance in the core, and indirectly on the 13CO abundance. Thus with the 13CO abundance structure fixed, the H13CO+ (1-0) abundance depends on both the H and on the electron abundances. The H abundance is set by the cosmic-ray ionization rate. The electron abundance is set by different mechanisms, depending on the . At , it is controlled by the photo-ionization of neutral carbon by UV photons, while at greater extinctions, UV can not penetrate and the gas ionization is mainly due to cosmic-rays (see Bergin & Tafalla 2007, Fig. 11). In addition, metals with a low ionization potential (Fe, Na, and Mg) also influence the ionization fraction, because they recombine with electrons very slowly. The cosmic-ray ionization rate and the low ionization potential metal abundance have similar effects on the ionization fraction, and they are difficult to constrain independently from our H13CO+ (1-0) observations alone. In B68 we found a metal abundance of , but we suggested that the observations were also consistent with a full depletion of metals (Maret & Bergin 2007). Here we adopt the same metal abundance as in B68, and we adjust the cosmic-ray ionization rate in order to reproduce the observations.
4.2.1 Effect of the cosmic-ray ionization rate
 |
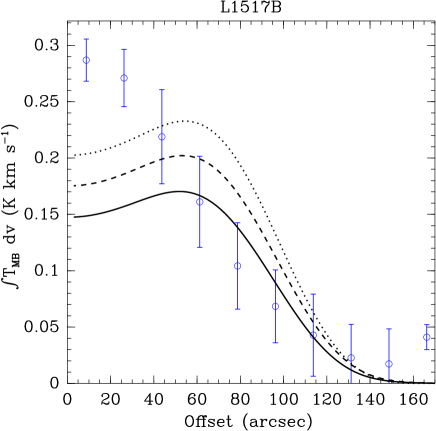 |
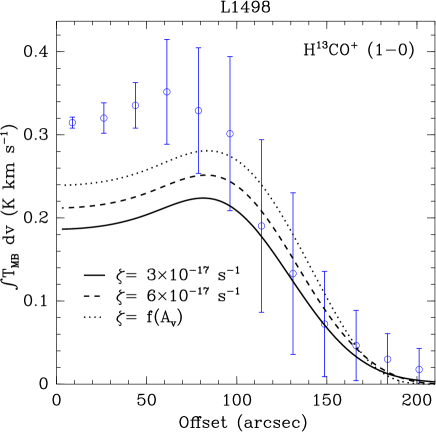
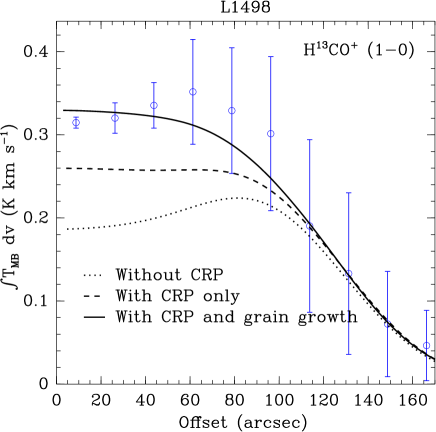
Figure 5 compares the observed H13CO+ (1-0) integrated emission in L1498 and L1517B with the predictions of our model for different cosmic-ray ionization rates . Three different values of are considered: s-1, s-1, and a variable cosmic-ionization rate as a function of the . For the latter, we use the model of Padovani et al. (2009), who studied the propagation of cosmic-ray protons and electrons in a molecular cloud, for various incident electron and proton energy spectra. Here we use their results assuming the proton energy spectrum from Moskalenko et al. (2002), and an electron energy spectrum from Strong et al. (2000, model C). This model, labeled “M02+C00” by Padovani et al., was found to provide a good agreement with the observed values of for between 1020 and 1021 cm-2 (see their Fig. 15).
In L1498, all three models are in good agreement with the H13CO+ (1-0) line observations for offsets greater than 100″. However, all models fail to reproduce the emission towards the core center. The model with s-1 and the model with an dependent cosmic-ray ionization rate give a slightly better observational agreement towards the core center, but still significantly underproduce the emission. In addition, these two models where found to underproduce the extended C18O (1-0) emission (which is matched at s-1, see Fig. 3). This is because CO and its isotopologues are efficiently destroyed by the reaction with He+ in the halo, from where the extended C18O (1-0) emission arises. He+ itself is produced by cosmic-ray ionization, so its abundance increases as the cosmic-ionization rate increases.
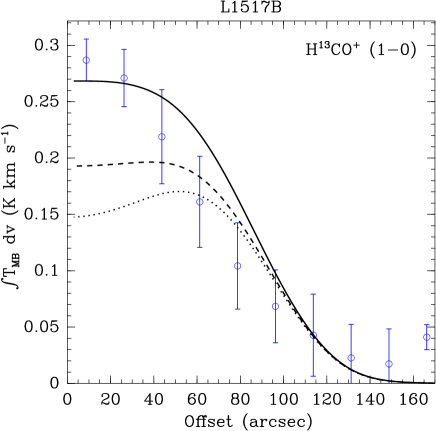
In L1517B, only the model with s-1 matches the H13CO+ (1-0) observations for offsets greater than 50″; other models predict a more extended emission than what is observed. Like in L1498, all models somewhat underproduce the emission at the core center. In fact, our models predicts a decrease in the H13CO+ (1-0) emission towards the center of the core that is not observed: the H13CO+ (1-0) emission in this source peaks at the center of the core (see Fig 2). In the following, we adopt a of s-1, which provides the best-fit to the C18O (1-0) and H13CO+ (1-0) emission in both cores, and we investigate different mechanisms to explain the larger H13CO+ (1-0) intensities observed towards the center of the two cores. This value of is in good agreement with that measured in other cores (Caselli et al. 1998, s-1) including B68 ( s-1; Maret et al. 2007).
4.2.2 Effect of cosmic-ray induced photodesorption
Although our C18O (1-0) data places constraints on the CO abundance in the core, this line has a relatively low critical density ( cm-3 at 10 K) and is therefore probing mostly the outer layers. On the other hand, H13CO+ (1-0) has a critical density which is about two orders of magnitude higher ( cm-3) and likely traces dense material deeper in the cores (the critical density of this line is comparable to the central densities of the two cores, see Table 1). Therefore, the excess of H13CO+ (1-0) emission observed in the two cores with respect to our model predictions hints that our model underestimates the abundance of CO and its isotopologues in the inner parts of the core, and this underestimate propagates into a lower-than-observed H13CO+ (1-0) intensity. In these regions, CO is removed from the gas phase by the freeze-out on the dust grains. Thermal evaporation being inefficient a 10 K, desorption mostly occurs through cosmic-rays.
Our fiducial models only include direct cosmic-ray desorption, i.e. desorption caused by impact of the cosmic-ray particle on grains. However, cosmic-ray desorption can also occurs in indirect fashion: the ionization of H2 followed by electronic recombination, producing a UV photon. This cosmic-ray induced UV radiation field can in turn photodesorb ices (see e.g. Caselli et al. 2012). Following (Öberg et al. 2009a), we have included this effect in our model by adding a cosmic-ray induced UV field of 10 (Shen et al. 2004) to that produced by the ISRF. Figure 6 compares the models predictions with and without cosmic-ray photodesorption to both the C18O (1-0) and H13CO+ (1-0) integrated intensities. Models with cosmic-ray photodesorption produce more H13CO+ (1-0) towards the core center and are in better agreement with the observations. However, they still do not produce enough emission with respect to the observations, suggesting that another process is at play. In the following we explore some solutions to this discrepancy.
 |
 |
 |
 |
4.2.3 Effect of grain growth
Another possible explanation for the excess of H13CO+ (1-0) emission in both cores is that the grain size varies as a function of the radius. If grains have coagulated at the center of the cores, the average grain cross-section decreases, and the depletion may be less efficient. For our fiducial models we have assumed that grains are spherical and have a constant 0.1 size throughout the cores. However, both L1498 and L1517B appear in emission at 3.6 in Spitzer maps, a phenomenon know as core-shine (Pagani et al. 2010). This indicates that grains have grown from their average 0.1 size to a bigger size, up to about a . Here we investigate the effect of grain growth on the predicted H13CO+ (1-0) emission.
Steinacker et al. (2010) modeled the mid-infrared emission from L183 observed with Spitzer, and found a good agreement between the model and the observations for a parametric grain size of the form:
| (4) | |||||
| (5) |
Following this approach we compute several models with a parametric grain size. To enforce mass conservation, the grain abundance is recomputed at each radius, assuming the same grain composition (i.e. olivine) and gas-to-dust mass ratio (100) as in our fiducial model555In practice, this assumes that grains have coagulated and that the aggregates have compacted into a spherical shape, resulting in a lower cross-section per H nucleus. However, grain aggregates may have a “fluffy” shape, and their cross-section per H nucleus may be larger than what is assumed here.. The parameters for grain size are then adjusted until a good match with the observations was found. Figure 6 shows the best fit model with both cosmic-ray photodesorption and grain growth included, for the parameters given in Table 3. This model provides a good fit to the H13CO+ (1-0) emission, especially at low radii. Thus, inclusion of both cosmic-ray photodesorption and grain growth in the model appears to be the only way to increase the CO abundance at the core center. We note, however, that the grain size parameters are not unique: comparable fits are found for larger values of and (i.e. smaller coagulation regions with steeper size decrease with the density). On the same Figure we show the model predictions for the C18O (1-0) emission. The grain growth is found to have little effect on this line, because it originates from regions with density below .
| L1498 | L1517B | |
|---|---|---|
| (cm-3) | ||
| (m) | 0.1 | 0.1 |
| 0.25 | 0.25 |
One possible inconsistency of our approach is that the density profiles in the two cores have been derived assuming a typical dust opacity at 1.2 mm (0.5 cm2 g; Tafalla et al. 2002). In principle, grain growth could affect this opacity, and in turn the density we derive for the two cores. Ormel et al. (2011) computed the effects of grain coagulation on the dust opacity, and found that for years, the change in the opacity at 850 m are rather small (a factor 2 at most depending on the grain composition, see their Fig. 6). We conclude that grain growth should not affect our density determinations, and that our approach is consistent.
 |
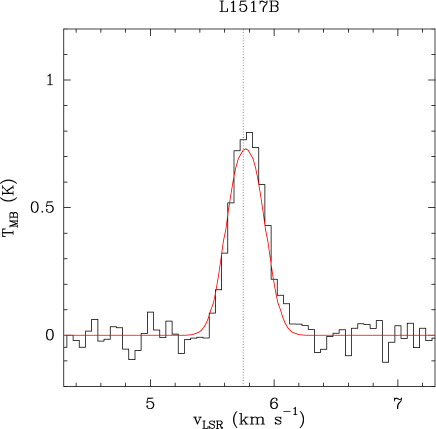 |
Finally, Fig. 7 compares the observed profiles towards the core center with the model predictions for our best fit model (i.e. models including both cosmic-ray desorption and grain growth). In both cores, the line profiles are close to Gaussians, and are well reproduced by the model, assuming the same turbulent broadening as for the C18O (1-0) modeling.
5 Discussion
5.1 Constraints on the core age
Our model and observations of the C18O emission allow us to place stringent constraints on the chemical age of the two cores. It is interesting to note that this age is comparable for the two cores: yr. For B68, Bergin et al. (2006) obtained a somewhat younger age: yr. Here we discuss the meaning of these chemical ages.
As discussed by Bergin et al. (2006), the age derived from the amount of CO depletion is likely a lower limit on the age of the core, and this for two reasons. First, our model is “pseudo-time dependent”, in the sense that it does not includes the physical evolution of the cloud and the core. In our modeling we have assumed that the density and temperature profile of the core do not evolve with time; in reality, as the cloud condenses and fragments to form clumps and cores, the gas density should increase by several orders of magnitudes, while the temperature should drop as a result of reduced UV penetration in the cloud. Therefore the cores density must have been lower in the past, while their temperature must have been slightly higher. Because the depletion time scale is proportional to the gas density, and the thermal desorption time scale depends exponentially on the dust temperature, the chemical age derived from CO depletion is a lower limit to the core ages.
Second, our chemical simulation starts with an initial composition which is typical of dense molecular gas. We have assumed that H2, CO, H2O (in form of ices) and a small fraction of N2 are pre-existing in the cloud, with other elements assumed to be in atomic form. Detailed photo-dissociation models show that for an H density of cm-3, the transition between C+ and CO occurs at mag. In addition, Hollenbach et al. (2009) models for the formation of H2O shows that for greater than 4 mag, water ices are the dominant oxygen carrier. Note that Hollenbach et al. (2009) models assumes a FUV field of 100 ; for a FUV field of 1 , the transition would occur at a lower . Thus the initial conditions adopted here are representative of a cloud with an extinction of 2-4 mag. In reality the core would form from diffuse atomic gas, and the time needed to form CO and H2O is not included in our estimate, and the chemical time is again a lower limit to the core physical ages.
The lower limits we obtain on the core ages may be compared to the lifetime obtained from large scale surveys. Enoch et al. (2008) carried out a complete census if the prestellar cores in Perseus, Serpens and Ophiuchus clouds (but not Taurus-Auriga) from millimeter continuum observations, and derived an average lifetime of yr, once the core density exceed their detection threshold of cm-3. From optical observations, Lee & Myers (1999) obtained a slightly larger lifetime yr for more diffuse cores (including Taurus-Auriga cores). These numbers refer to the average lifetime of the cores once they reach the detection threshold; they can therefore be considered as an upper limit on the age of both L1498 and L1517B. Combining these upper limits with the lower limits we obtain form the chemical ages, we found that the two cores ages are comprised between 0.3 and 1.6 Myr. In addition, we note that the lower limits in the age we obtain here are comparable to shortest lifetime obtained by Lee & Myers (1999) ( yr); it is therefore possible that two cores are at a relatively evolved stage, and may quickly evolve to form protostars. It is interesting to note that, using an independant technique, Pagani et al. (2013) obtained an age of 0.7 My for the L183 core, based on its observed N2D+/N2H+ ratio; this value is consistent with the chemical ages derived in this study.
5.2 Core chemical structure
 |
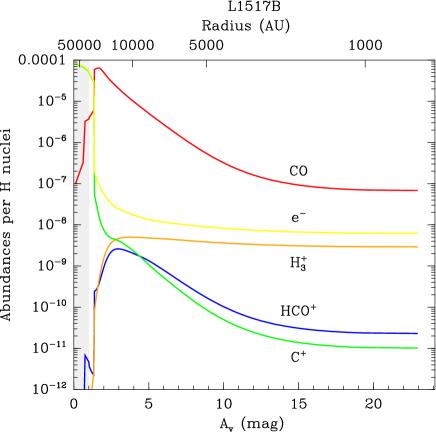 |
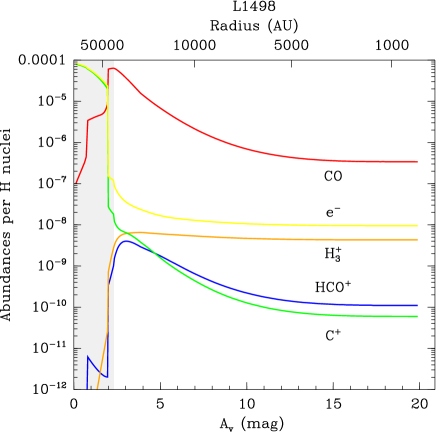
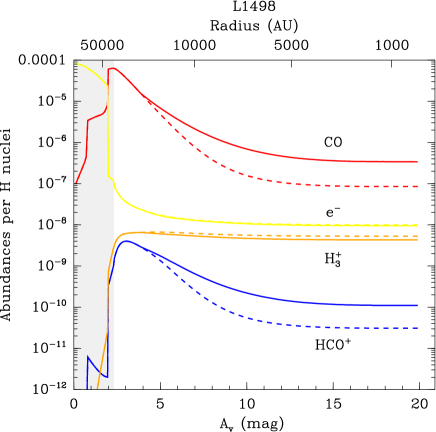
Figure 8 shows the predicted abundances for several species, as a function of the radius, for our best-fit models. From the chemical point of view, the cores can be divided in three distinct zones. At , the chemistry is dominated by photo-processes: CO is photo-dissociated, and is the main carbon reservoir. Deeper in the cores, at , the external UV radiation field is attenuated, and photo-dissociation is less important. On the other hand, the density at is only cm-3, and the CO depletion timescale (see e.g. Bergin et al. 1995) is yr i.e. comparable to the derived core chemical ages. As a consequence, the CO depletion in this region is moderate, and the CO abundance peaks at . HCO+ – whose parent molecule is CO, also peaks at the same . Finally, at , the chemistry is dominated by the depletion heavy species. Our models predict a CO abundance at the core centers of with respect to H nuclei; this is between 2 and 3 orders of magnitude lower than the peak CO abundance. HCO+ is also affected by depletion, but its abundance does not decrease as steeply as CO. This is because HCO+ is mainly destroyed by electronic recombination, and the electron abundance decreases sharply towards the core center, as discussed below. The fact HCO+ is less affected by depletion than CO is one of the reasons why H13CO+ (1-0) is probes deeper in the core than C18O (1-0); the second reason is that the lines have different critical densities, as already discussed.
In L1498, the ionization fraction – which is equal to the electron abundance because the abundance of other negative charge carriers, i.e. anions and negatively charged grains, is negligible – ranges from in the core halo down to at the core center. In L1517B, the ionization fraction ranges from at the surface down to at the center. In the core halos (i.e. at ), the ionization is mainly due to the photo-ionization of atomic carbon by UV photons. Deeper in the cores, the ionization is mainly caused by cosmic-rays. The ionization measured at the center B68 compares well with that of L1498 and L1517B ( Maret & Bergin 2007). Our models show that at , the main positive charge carriers are the H and N2H+ ions. In both cores, H is the most abundant ion and accounts for about 50-60% of the total charge. N2H+ is less abundant and accounts for about 20-30% of the charge (see Appendix A for a discussion of our model predictions for nitrogen bearing species). Other important charge carriers are He+ and H3O+, which both contribute to about 5% of the total charge. In the present study, we have not considered the deuterated isotopologues of H (i.e. H2D+, D2H+ and D). In the dense part of cores, where CO is depleted, the abundance of these isotopologues are expected to be enhanced with respect of H.
5.3 The influence of grain growth on the chemistry
Our analysis of the H13CO+ (1-0) emission observed in both cores suggests that grain coagulation has occurred in the inner regions of the cores. From the observational point of view, this is consistent with the observations of core-shine in both objects (Pagani et al. 2010), that clearly indicates that larger grains (than average ISM grains) are present. In B68, Bergin et al. (2006) modeled the gas temperature structure and found that a reduced thermal coupling between dust and grains – probably owning to grain growth – was needed in order to reproduce the gas temperature at the center of the core. Additional evidence for grain growth in dense regions of different clouds comes from the analysis of multi-wavelength FIR and submillimeter observations (Kramer et al. 2003; Stepnik et al. 2003; Juvela et al. 2011), and is consistent with the expectation from theoretical models (Ossenkopf 1993; Ormel et al. 2009). Here we discuss the implications of grain growth on the chemistry.
From the chemical point of view, grain growth reduces the average grain cross section per H nucleus, and therefore slows down depletion. The timescale for depletion is given by:
| (6) |
where is the sticking coefficient of a molecule on the grain, is the grain density, is the grain cross section and is the gas thermal velocity. For spherical grains with radius , the grain density writes as:
| (7) |
where is the proton mass, is the dust to gas mass ratio, and is the dust mass density. The grain cross section is simply:
| (8) |
and the mean grain cross section per H nucleus is therefore:
| (9) |
From Eq. (6), (7) and (8) we find that the depletion timescale is proportional to the grains with radius:
| (10) |
In our modeling we have assumed that varies as a power-law of gas the density, above a certain density threshold. At the center of L1498, we find a grain radius of ; therefore the grain growth slows down depletion at the center of the core by about 50%.
Figure 9 compares the predicted abundances of several species in L1498 for our best-fit model (including grain-growth) and the same model with no grain-growth. The model with grain-growth has a CO abundance at the center of the core which is about a factor 4 larger than the model without grain-growth. For the latter, CO is depleted by about 3 orders of magnitude at the core center with respect to its peak abundance. As a consequence, the HCO+ abundance at the center of the core is increased by about a factor 4 when grain-growth is considered. On the other hand, we find that it has little effect of the H abundance: including grain growth decreases slightly the H abundance (which is partly destroyed by CO). As a consequence, the partition of the main charge carriers is not affected.
6 Conclusions
We presented observations of the C18O (1-0) and H13CO+ (1-0) line emission in L1498 and L1517B. These observations have been modeled with a detailed chemistry network coupled with a radiative transfer code. Our observations and model allow us to place constraints on the core age and chemical composition. Our main conclusions are the following:
-
1.
The C18O (1-0) emission is reproduced in both cores for a chemical core age of 0.3-0.5 Myr, similar in both sources. We argue that these chemical ages are lower limits on time elapsed since the core has formed from their parent molecular cloud. Combining this lower limit with upper limits from Lee & Myers (1999) and Enoch et al. (2008) core lifetimes, we estimate that the core ages lie within 0.3 and 1.6 Myr. Our lower limits are comparable to the shortest lifetimes, suggesting that these cores are at a relatively evolved stage, and may shortly collapse to form protostars.
-
2.
Our fiducial model underproduces the H13CO+ (1-0) emission by a about a factor 2. This line is found to probe deeper regions than C18O (1-0), because of both different excitation conditions (higher critical density) and chemistry. The discrepancy between the model and the observations is partly solved with the inclusion of cosmic-ray photodesorption. In addition, we find that an increase in the grain size in the inner regions of the cores is needed to reproduce the observations. This suggests that grains have coagulated in the innermost regions, in agreement with the observations of coreshine in both objects.
-
3.
The predicted chemical structure of the cores can be roughly divided into three regions: an external region where the chemistry is dominated by photo-dissociation and UV ionization; an intermediate region with undepleted abundance; and an internal region where the chemistry is dominated by freeze-out and cosmic-ray ionization. In the inner region, CO is depleted by about 2-3 orders of magnitude, and the ionization fraction is .
-
4.
Grain-growth is found to have an important effect on the chemistry; its main effect is to slow down the depletion by about 50%. As a result, the CO abundance in the inner regions is increased by a about a factor 4 in L1498. On the other hand, we found that it has no effect on the ionization fraction; in particular H (and possibly its isotopologues) is always the main charge carrier.
Acknowledgements.
The authors are grateful to Dimtri Semenov for his help for testing our chemical model. We also thank Robin Garrod for providing us the the binding energies of molecular species on dust grains, and Karin Öberg and Eric Herbst for discussions on photodesorption. Finally, we thank Malcolm Walmsley for his comments on this manuscript that helped to improve it. This work was supported by NSF grant AST-1008800.References
- Alves et al. (2001) Alves, J. F., Lada, C. J., & Lada, E. A. 2001, Nature, 409, 159
- Asplund et al. (2009) Asplund, M., Grevesse, N., Sauval, A. J., & Scott, P. 2009, ARA&A, 47, 481
- Bacmann et al. (2003) Bacmann, A., Lefloch, B., Ceccarelli, C., et al. 2003, ApJ, 585, L55
- Bergin et al. (2002) Bergin, E. A., Alves, J. ., Huard, T., & Lada, C. J. 2002, ApJ, 570, L101
- Bergin & Langer (1997) Bergin, E. A. & Langer, W. D. 1997, ApJ, 486, 316
- Bergin et al. (1995) Bergin, E. A., Langer, W. D., & Goldsmith, P. F. 1995, ApJ, 441, 222
- Bergin et al. (2006) Bergin, E. A., Maret, S., van der Tak, F. F. S., et al. 2006, ApJ, 645, 369
- Bergin & Tafalla (2007) Bergin, E. A. & Tafalla, M. 2007, ARA&A, 45, 339
- Bottinelli et al. (2010) Bottinelli, S., Boogert, A. C. A., Bouwman, J., et al. 2010, ApJ, 718, 1100
- Bringa & Johnson (2004) Bringa, E. M. & Johnson, R. E. 2004, ApJ, 603, 159
- Cambrésy (1999) Cambrésy, L. 1999, A&A, 345, 965
- Caselli et al. (2012) Caselli, P., Keto, E., Bergin, E. A., et al. 2012, ApJ, 759, L37
- Caselli et al. (1999) Caselli, P., Walmsley, C. M., Tafalla, M., Dore, L., & Myers, P. C. 1999, ApJ, 523, L165
- Caselli et al. (1998) Caselli, P., Walmsley, C. M., Terzieva, R., & Herbst, E. 1998, ApJ, 499, 234
- Crapsi et al. (2007) Crapsi, A., Caselli, P., Walmsley, M. C., & Tafalla, M. 2007, A&A, 470, 221
- Dislaire et al. (2012) Dislaire, V., Hily-Blant, P., Faure, A., et al. 2012, A&A, 537, A20
- Enoch et al. (2008) Enoch, M. L., Evans, II, N. J., Sargent, A. I., et al. 2008, ApJ, 684, 1240
- Faure et al. (2013) Faure, A., Hily-Blant, P., Le Gal, R., Rist, C., & Pineau des Forêts, G. 2013, ApJ, 770, L2
- Flower (1999) Flower, D. R. 1999, MNRAS, 305, 651
- Garrod & Herbst (2006) Garrod, R. T. & Herbst, E. 2006, A&A, 457, 927
- Graedel et al. (1982) Graedel, T. E., Langer, W. D., & Frerking, M. A. 1982, ApJS, 48, 321
- Habing (1968) Habing, H. J. 1968, Bull. Astron. Inst. Netherlands, 19, 421
- Hasegawa & Herbst (1993) Hasegawa, T. I. & Herbst, E. 1993, MNRAS, 261, 83
- Hindmarsh et al. (2005) Hindmarsh, A. C., Brown, P. N., Grant, K. E., et al. 2005, ACM Transactions on Mathematical Software, 31, 363
- Hogerheijde & van der Tak (2000) Hogerheijde, M. R. & van der Tak, F. F. S. 2000, A&A, 362, 697
- Hollenbach et al. (2009) Hollenbach, D., Kaufman, M. J., Bergin, E. A., & Melnick, G. J. 2009, ApJ, 690, 1497
- Juvela et al. (2011) Juvela, M., Ristorcelli, I., Pelkonen, V.-M., et al. 2011, A&A, 527, A111
- Keto et al. (2004) Keto, E., Rybicki, G. B., Bergin, E. A., & Plume, R. 2004, ApJ, 613, 355
- Kirk et al. (2006) Kirk, J. M., Ward-Thompson, D., & Crutcher, R. M. 2006, MNRAS, 369, 1445
- Kramer et al. (2003) Kramer, C., Richer, J., Mookerjea, B., Alves, J., & Lada, C. 2003, A&A, 399, 1073
- Langer et al. (1984) Langer, W. D., Graedel, T. E., Frerking, M. A., & Armentrout, P. B. 1984, ApJ, 277, 581
- Lee & Myers (1999) Lee, C. W. & Myers, P. C. 1999, ApJS, 123, 233
- Lee et al. (2008) Lee, J.-E., Bergin, E. A., & Lyons, J. R. 2008, Meteoritics and Planetary Science, 43, 1351
- Müller et al. (2001) Müller, H. S. P., Thorwirth, S., Roth, D. A., & Winnewisser, G. 2001, A&A, 370, L49
- Maret & Bergin (2007) Maret, S. & Bergin, E. A. 2007, ApJ, 664, 956
- Maret et al. (2006) Maret, S., Bergin, E. A., & Lada, C. J. 2006, Nature, 442, 425
- Maret et al. (2007) Maret, S., Bergin, E. A., & Lada, C. J. 2007, ApJ, 670, L25
- Moskalenko et al. (2002) Moskalenko, I. V., Strong, A. W., Ormes, J. F., & Potgieter, M. S. 2002, ApJ, 565, 280
- Öberg et al. (2009a) Öberg, K. I., Linnartz, H., Visser, R., & van Dishoeck, E. F. 2009a, ApJ, 693, 1209
- Öberg et al. (2009b) Öberg, K. I., van Dishoeck, E. F., & Linnartz, H. 2009b, A&A, 496, 281
- Ormel et al. (2011) Ormel, C. W., Min, M., Tielens, A. G. G. M., Dominik, C., & Paszun, D. 2011, A&A, 532, A43
- Ormel et al. (2009) Ormel, C. W., Paszun, D., Dominik, C., & Tielens, A. G. G. M. 2009, A&A, 502, 845
- Ossenkopf (1993) Ossenkopf, V. 1993, A&A, 280, 617
- Padovani et al. (2009) Padovani, M., Galli, D., & Glassgold, A. E. 2009, A&A, 501, 619
- Pagani et al. (2007) Pagani, L., Bacmann, A., Cabrit, S., & Vastel, C. 2007, A&A, 467, 179
- Pagani et al. (2013) Pagani, L., Lesaffre, P., Jorfi, M., et al. 2013, A&A, 551, A38
- Pagani et al. (2010) Pagani, L., Steinacker, J., Bacmann, A., Stutz, A., & Henning, T. 2010, Science, 329, 1622
- Pagani et al. (2009) Pagani, L., Vastel, C., Hugo, E., et al. 2009, A&A, 494, 623
- Savage & Sembach (1996) Savage, B. D. & Sembach, K. R. 1996, ARA&A, 34, 279
- Schmid-Burgk et al. (2004) Schmid-Burgk, J., Muders, D., Müller, H. S. P., & Brupbacher-Gatehouse, B. 2004, A&A, 419, 949
- Schöier et al. (2005) Schöier, F. L., van der Tak, F. F. S., van Dishoeck, E. F., & Black, J. H. 2005, A&A, 432, 369
- Semenov et al. (2010) Semenov, D., Hersant, F., Wakelam, V., et al. 2010, A&A, 522, A42+
- Shen et al. (2004) Shen, C. J., Greenberg, J. M., Schutte, W. A., & van Dishoeck, E. F. 2004, A&A, 415, 203
- Steinacker et al. (2010) Steinacker, J., Pagani, L., Bacmann, A., & Guieu, S. 2010, A&A, 511, A9
- Stepnik et al. (2003) Stepnik, B., Abergel, A., Bernard, J.-P., et al. 2003, A&A, 398, 551
- Strong et al. (2000) Strong, A. W., Moskalenko, I. V., & Reimer, O. 2000, ApJ, 537, 763
- Tafalla et al. (2004) Tafalla, M., Myers, P. C., Caselli, P., & Walmsley, C. M. 2004, A&A, 416, 191
- Tafalla et al. (2002) Tafalla, M., Myers, P. C., Caselli, P., Walmsley, C. M., & Comito, C. 2002, ApJ, 569, 815
- Tafalla et al. (2006) Tafalla, M., Santiago-García, J., Myers, P. C., et al. 2006, A&A, 455, 577
- Vigren et al. (2012) Vigren, E., Zhaunerchyk, V., Hamberg, M., et al. 2012, ApJ, 757, 34
- Willacy et al. (1998) Willacy, K., Langer, W. D., & Velusamy, T. 1998, ApJ, 507, L171
- Wilson & Rood (1994) Wilson, T. L. & Rood, R. 1994, ARA&A, 32, 191
- Yang et al. (2010) Yang, B., Stancil, P. C., Balakrishnan, N., & Forrey, R. C. 2010, ApJ, 718, 1062
Appendix A Model predictions for the nitrogen chemistry
 |
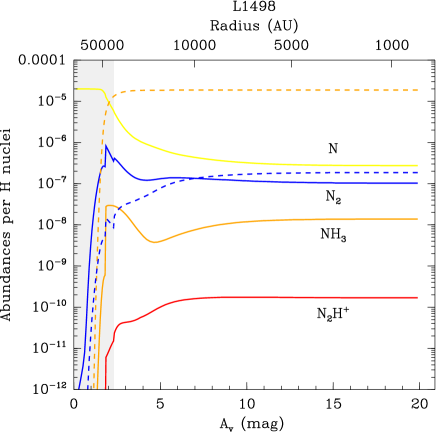 |
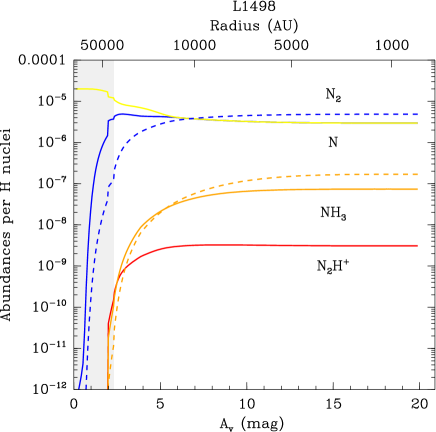
As discussed in Sect. 5.2, our model best-fit model predicts that N2H+ contributes to about 20-30% of the total charge in both cores. Here we briefly discuss our model prediction for this species, and how it affects our results on the C18O (1-0) and H13CO+ (1-0) emission in the cores. Our best fit model for L1498 predicts a N2H+ abundance of , roughly constant throughout the core. This is more than an order of magnitude larger than the abundance derived by Tafalla et al. (2004) in the same object ( with respect to H nuclei), from N2H+ (1-0) and (3-2) line observations. This is likely because our model overproduces the N2 abundance (a precursor of N2H+) which is the main nitrogen reservoir in our simulations. In order to reconcile our model predictions with the N2H+ observations, we have updated the rate of several reactions that are important for nitrogen bearing species. For the reaction rate of N+ + H2, we used the rate of Dislaire et al. (2012), assuming a H2 ortho-to-para ratio of 10-3 (the predicted steady-state value at 10 K; Faure et al. 2013). We have also updated the rates for the neutral-neutral reactions that lead to production of N2 (see Table 3 from Le Gal et al., submitted to A&A, and references therein). Finally, we have updated the branching ratio of the N2H+ dissociative recombination (Vigren et al. 2012).
The left panel of Fig. 10 shows the predicted abundances of several nitrogen bearing species that we obtain for our best-fit model with a the updated chemistry network. We find that the new rates have no influence on the N2H+ abundance in the core center: although the N abundance is increased as a result of the reduced conversion of N to N2 through neutral reactions, this has little influence on the N2 abundance, which remains the main nitrogen reservoir. To reduce the predicted N2 abundance, we have run a model in which we assume that some of the nitrogen is initially in form of NH3 ices, the rest of it being in atomic form. Assuming an initial NH3 ice abundance of 5.5% relative to H2O ices (the average value measured towards young stellar objects by Bottinelli et al. 2010), our model predicts a N2H+ abundance at the core center of , in better agreement with the observations, but still a factor 10 higher. Increasing the initial NH3 ice abundance to 8.5% (still in agreement with the values measured by Bottinelli et al. that range between 2 and 15%), our model predicts a N2H+ abundance of , in reasonable agreement with the observations (see the right panel of Fig. 10). In addition, the predicted NH3 gas phase abundance is . This is also consistent with Tafalla et al. (2004), who measured a para-NH3 abundance of (with respect to H nuclei) at the core center, i.e. a total (ortho-NH3 + para-NH3) abundance of , assuming an ortho-to-para ratio of 0.7 (Faure et al. 2013). Of course, the model presented here should be compared to observations of other nitrogen bearing species, in order to obtain better constraints of the nitrogen chemistry as a whole (which is out of the scope if the present paper). However, it is important to note that it predicts the same C18O (1-0) and H13CO (1-0) integrated intensities as our best-fit model (within 10%). Our conclusions on the CO and HCO+ depletion are therefore independent of the assumptions made for the nitrogen chemistry.