The origin of the tilted disk in the low mass X-ray binary GR Mus (XB 1254690)
Abstract
We present photometric and spectroscopic observations of the low mass X-ray binary GR Mus (XB 1254690), and find strong evidence for the presence of a negative superhump with a period that is 2.40.3% shorter than the orbital. This provides further support that GR Mus indeed harbours a precessing accretion disk (with a period of 6.740.07 day) that has retrograde precession and is completely tilted out of the orbital plane along its line of nodes. This tilt causes a large fraction of the gas in the accretion stream to either over- or underflow the accretion disk instead of hitting the disk rim, and could be a feature of all low mass X-ray binaries with characteristics similar to GR Mus (i.e. the so-called atoll sources). Furthermore, we also find marginal evidence for the presence of a positive superhump, suggesting that the accretion disk in GR Mus is eccentric due to tidal resonances. If true, than the relationship between the positive superhump period excess and the mass ratio () provides a constraint of =/=0.33-0.36. Together with the radial velocity semi-amplitude measurements of the compact object, and previous modeling of the inclination we obtain a mass for the neutron star of 1.2/1.8 (95% confidence).
keywords:
accretion, accretion disks – stars:individual (GR Mus) – X-rays:binaries.1 Introduction
For about a dozen persistently active low mass X-ray binaries (LMXBs), i.e. binaries that harbour a compact object (either a black hole or a neutron star) and a low mass (1) companion, the optical counterpart is known (e.g. Charles & Coe 2006). Despite being relatively bright optically, kinematic studies to constrain the mass of these systems have been difficult. In general, the reprocessed X-ray emission in the outer accretion disk, that is formed around the compact object, dominates the optical flux thereby swamping any intrinsic spectral feature of the donor star. However, spectroscopic signatures of the irradiated face of the donor star have now been detected in many LMXBs in the form of narrow emission components (e.g. Steeghs & Casares 2002). This signature is most visible in the Bowen region, a blend of N III 4634/4640Å and C III 4647/4650 Å lines, and is for many optically bright LMXBs the only way to constrain the mass function thus far (see e.g. Cornelisse et al. 2008 for an overview).
One such LMXB for which a signature of the irradiated surface of the donor star in the Bowen region is present is XB 1254690 (Barnes et al. 2007). Its optical counterpart was identified with the 19 blue star GR Mus (Griffiths et al. 1978), and its Type I X-ray bursts identify the compact object as a neutron star (Mason et al. 1980). Interestingly, GR Mus also shows periodic X-ray dips with a recurrence time of 3.9 hrs (Courvoisier et al. 1986), which is similar to the optical modulation detected by Motch et al. (1987). These dips are thought to be due to periodic obscuration of the inner accretion disk by a structure located in the outer regions of the disk (White & Swank 1982), and not only suggest that this 3.9 hr period is orbital but also that GR Mus has a reasonably high inclination. For example, modeling of the optical lightcurves by Motch et al. (1987) finds that the inclination of GR Mus must be between 65∘ and 73∘.


Compared to most other dipping LMXBs such as XB 1916053 (e.g. Smale et al. 1992), the large variation in both dip depth and length in GR Mus is unusual. For example, dips with a reduction in the 1-10 keV X-ray flux of 95% and “only” 20% were observed by Courvoisier et al. (1987). On the other hand, Smale & Wachter (1999) and Iaria et al. (2001) found no dips with an upper-limit of 2%. Further observations showed stages without any dipping, only shallow dipping or strong dipping again (e.g. Smale et al. 2002; Diaz-Trigo et al. 2009). A characteristic timescale of 60 hrs for the recurrence of dipping behavior was found by Diaz-Trigo et al. (2009), and they also suggested that the general dipping behavior could be explained by the presence of a precessing accretion disk that is tilted out of the orbital plane.
In this paper we present the results of a 2 week photometric campaign combined with 2 orbital periods of spectroscopic observations on GR Mus. We find strong evidence for the presence of a negative superhump, strongly suggesting that GR Mus indeed harbours a tilted accretion disk which is the origin of the large variation in the properties of the X-ray dips. In Sect. 2 we present an overview of our observations. In Sect. 3 we show the results of our photometric campaign, while Sect. 4 discusses the results of our spectroscopic observations. We continue with a discussion on the evidence for a tilted disk in Sect. 5.1 and provide further constraints on the system parameters of GR Mus in Sect. 5.2. We finish with a brief conclusion in Sect. 6.
2 Observations and Data Reduction
2.1 Photometric observations
From 17-27 April 2010 we obtained 11 nights of photometric observations of GR Mus using the 1.0m telescope at SAAO. We used the SAAO STE4 CCD camera, which is a SITe back-illuminated detector with 10241024 pixels. During the first night we obtained alternate and band images of GR Mus, while during subsequent nights we alternated between and . The integration time for each image was always 180 sec. Since the majority of our observations were in , and the resulting lightcurves in the different bands show a very similar morphology, we will concentrate only on this band for the rest of the paper. In a future paper we plan to present modeling of the resulting lightcurves for all bands. In Table 1 we give an overview of our -band observations. Excluding observations for which the weather conditions were too poor, we obtained a total of 448 images spread over 10 nights.
| Date/start time | # obs. | exp. time | seeing |
| (dd-mm-yy/UT) | (s) | (arcsec) | |
| Photometry | |||
| 17-04-10/19:00 | 56 | 180 | 1.2-1.4 |
| 18-04-10/18:20 | 67 | 180 | 1.1-1.5 |
| 19-04-10/closed | 00 | – | – |
| 20-04-10/18:20 | 47 | 180 | 1.0-2.0 |
| 21-04-10/18:00 | 45 | 180 | 1.1-2.5 |
| 22-04-10/18:15 | 07 | 180 | 2.0-2.5 |
| 23-04-10/18:10 | 36 | 180 | 1.3-2.5 |
| 24-04-10/18:10 | 66 | 180 | 1.2-1.6 |
| 25-04-10/18:10 | 62 | 180 | 1.0-1.4 |
| 26-04-10/18:10 | 43 | 180 | 1.1-2.0 |
| 27-04-10/23:15 | 19 | 180 | 1.0-2.5 |
| Spectroscopy | |||
| 16-04-12/03:58 | 22 | 660 | 0.5-1.6 |
| 20-04-12/02:20 | 25 | 660 | 0.6-1.0 |
For the reduction we used a point-spread function (PSF) fitting program based on the DoPhot routine by Schechter et al. (1993). This routine is specifically designed for bias subtraction, and source extraction (using both aperture photometry and PSF-fitting) for the STE4 CCD on the 1.0m telescope at SAAO. We extracted the counts for GR Mus and 3 comparison stars so as to perform differential photometry. The magnitude of each target was obtained using a standard star that was observed each night.
2.2 Spectroscopic observations


On both April 16 and 20 2012 we obtained approximately one orbit of phase-resolved spectroscopy of GR Mus using the FORS 2 spectrograph attached to the VLT Unit 1 at Paranal Observatory (ESO). During each night we used the 1200g volume-phased holographic grism with an integration time of 11 min each. We used a slit width of 0.7′′, giving a wavelength coverage of 4087-5561 with a resolution of 106 km s-1 (FWHM). We aligned the slit in such a way to avoid any interference from nearby brighter stars. This does mean that no comparison star is included in the slit and we could therefore not correct for slit losses. Arc lamp exposures were taken for wavelength calibration during the daytime. In Table 1 we give an overview of the observations.


The PAMELA software was used for the data reduction (i.e. debias, flatfielding etc), which allows for optimal extraction of the spectra (Horne 1986). The pixel-to-wavelength scale was determined using a 4th order polynomial fit to 8 lines resulting in a dispersion of 0.73 Å pixel-1, an rms scatter of 0.01 Å, and a wavelength coverage of 4434-6060. The final resolution around the He II 4686 emission line is 107.6 km s-1 (FWHM). Finally we also corrected for any velocity shifts due to instrument flexure (always 10 km s-1) by cross-correlating the sky spectra. For the corresponding analysis of the resulting dataset we used the MOLLY package.
3 Photometry
In Fig. 1 we present the resulting lightcurve of our 2 weeks of band photometric observations on GR Mus. As a check we also include the lightcurves of a comparison star, in which no strong variability is present, and therefore all variability in GR Mus is intrinsic and not due to weather or instrumental variations.
The first thing to note is that the average magnitude (19) is similar to previous observations of GR Mus (e.g. Motch et al. 1987; Smale & Wachter 1999). Furthermore we note that there is not only strong variability on a nightly timescale (with an amplitude of 0.5 magnitude), but also substantial changes from night to night and even over a longer period. This strongly suggests that something is changing systematically in GR Mus on a timescale much longer than the orbital period. Finally we note the presence of two “dip”-like events in Fig. 1 about 3.3 days apart (around 9.3 and 12.6 days).
In order to investigate the origin of the nightly variability, we converted the time into orbital cycles using the ephemeris by Diaz-Trigo et al. (2009). In Fig. 2 we show “postage stamps” of the individual nights. We note that the nightly variation in GR Mus is mostly periodic with the minima in the lightcurve corresponding to orbital phase zero of the ephemeris of Diaz-Trigo. However, there are nights (e.g. around orbital cycles 307-309) where the variations cannot be explained solely by a 4 hour periodic variability, but where a longer-term trend is also present that gives rise to a large variation from cycle to cycle. Furthermore, we also note that the amplitude of the variability changes from 0.2 (cycle 283) to 0.7 magnitude (e.g. cycles 301-303) between different cycles. In total this strongly suggests that, just like the X-ray emission (Diaz-Trigo et al. 2009), the optical emission cannot be described by simple orbital motion only.
Since Fig. 1 implies the presence of a longer-term trend in GR Mus, we therefore determined, where possible, the minimum magnitude for each cycle (as Fig. 2 shows that they are better defined than the maximum). Furthermore, for each night we determined the semi-amplitude of the 4 hr periodic variability by fitting simultaneously a sine curve and a linear trend. However, no obvious trends are visible in both minimum and semi-amplitude as a function of cycle, nor is there any trend when plotting the minimum as a function of semi-amplitude.

Another way to obtain more information about the origin of the extra variability in GR Mus is by searching for periodic variation using the Lomb-Scargle technique (Scargle 1982). In Fig. 3/top we present the resulting periodogram. We note that only the region between 4.5-7.5 d-1 shows any strong peaks, and therefore we zoom in on this region in Fig. 3/bottom. The most prominent peak is the known 4 hr variability (indicated as ) at 6.1130.015 d-1 (where the error on the frequency is obtained from the width of the peak). The next two most significant peaks, at 5.1 and 7.1 d-1, are most likely daily aliases of the true period. To confirm this, we created an artificial light-curve of a sine wave with a period of 0.16388875 day (i.e. similar to the period of Diaz-Trigo et al. 2009) with the same time-sampling as our dataset. In the bottom panel of Fig.3 we show the resulting periodogram which indicates that these peaks (labeled as ) are actually daily aliases of and therefore not physical.
More peaks are present that are not reproduced by the periodogram of our synthetic data (see the bottom panel of Fig 3). In order to determine their significance we performed a Monte-Carlo simulation, using 50,000 random lightcurves that have an identical temporal sampling, mean magnitude and standard deviation as the original dataset. For each random lightcurve we obtained the Lomb-Scargle periodogram and searched for the period with the highest power. From the distribution of the resulting powers we estimated the 3 confidence level and have indicated this in Fig. 3 with a dashed line. Furthermore, we also created the window function to check where the most significant peaks will show up due to the sampling of our data.
Two more peaks, indicated as and (plus their daily aliases and ) are above the 3 level and do not correspond to any peak in the window function. The peak at 6.2500.015 d-1 (i.e. ) appears to be highly significant, and we therefore consider this frequency is real. The third peak (), at 5.570.02 d-1, is only marginally above our 3 confidence estimate. Although an estimate for the red-noise component (which our Monte-Carlo simulation does not take into account) shows that it is not important in this region it could still lower the significance of this peak enough to make its identification less certain. However, using the phase dispersion minimization technique (Stellingwerf 1978), this frequency is also present at a confidence level 3. We therefore tentatively conclude that this period could also be real, although we do think that confirmation is still needed.
4 Spectroscopy
Our photometric dataset has shown that there are at least 2 significant periods (corresponding to and in Fig. 3) present in GR Mus, and any physical model will therefore depend on the interpretation of these periods. Although the strongest peak has typically been identified as the orbital period (e.g. Motch et al. 1987), it is not clear that this is necessarily correct since it could also correspond to a superhump modulation. For example, the optical light could be dominated by the stream-impact region (and therefore the origin of ) that has slightly longer period than the orbital one (which is now ). We therefore obtained 24 hrs of phase-resolved spectroscopy to unambiguously determine the true orbital period. From Barnes et al. (2007) we know that a signature of the donor star is present in the Bowen region and we therefore planned the observations in such a way that the two candidate orbital periods (corresponding to and ) would be in anti-phase with each other during our second set of spectra.
4.1 Optical spectrum
We start by presenting the average spectrum in Fig. 4. Note that we have not attempted to subtract the continuum, but have opted to only divide the spectrum by the average count rate around He II 4686. The spectrum is dominated by the emission lines that are typically observed in LMXBs (e.g. Balmer series, He II, Bowen) and, apart from the absence of absorption just “redward” of H, is identical to that presented by Barnes et al. (2007). However, they found several broad unidentified emission features between 4900 and 5300Å, which we now interpret as a large absorption trough from 4900 to 5100Å. Note that the exact interpretation of this region will strongly depend on identifying the precise location of the continuum, which is not possible to model without a flux standard. We therefore will not attempt here to identify these features. Finally, at 4530Å there is an unusual broad feature in our spectrum that was outside the wavelength coverage of Barnes et al. (2007). Again, since it will strongly depend on the exact subtraction of the continuum, it is not possible to identify this feature and we have therefore labeled it with “?” in Fig. 4.

We also created average spectra for each observing night, and note that the properties of the major emission lines have changed between our observations. In Fig. 5 we present the region around He II 4686 and the Bowen blend to show that in particular the strength of He II has changed significantly. In order to quantify these changes we measured for the 3 most prominent emission lines (i.e. He II 4686, H and the Bowen region) their equivalent width (EW) and full width at half maximum (FWHM).
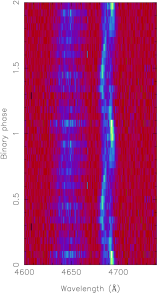
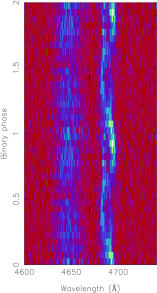
4.2 Trailed spectra and radial velocities
Since He II 4686 is the strongest emission line in our spectrum we also created a trailed spectrogram of this region. We first normalized the continuum around He II 4686 and then phase-folded the resulting spectra in 20 bins for each night separately using the ephemeris published in Diaz-Trigo et al. (2009). The resulting trails for each night are shown in Fig. 6. We have also included the Bowen region in the trails but no obvious patterns are present there. He II 4686 on the other hand consists of a clear S-wave with some underlying structure that could be due to different S-waves. A close inspection of the bright S-wave shows that it has moved 0.05-0.1 orbital phase between the two nights. Since the blue-to-red crossing for this bright S-wave occurs around orbital phase 0.7-0.8 it suggests that it is related to the stream impact region. In Sect. 4.3 we will explore this suggestion in more detail when we consider the Doppler maps of He II 4686.
Fig. 6 does suggest the wings of He II 4686 (in particular at velocities larger than the semi-amplitude of 500 km s-1 of the bright S-wave) are not contaminated by any localized emission sites. We therefore think that the double Gaussian technique of Schneider & Young (1980) can be applied in order to estimate the systemic velocity () and the velocity semi-amplitude of the compact object (). For the double Gaussian technique we used two Gaussians with FWHM of 200 km s-1, separations ranging between 400 and 1700 km s-1, and with steps of 100 km s-1, resulting in the diagnostic diagram shown in Fig. 7.
| He II | H | Bowen | |
|---|---|---|---|
| Night 1 | |||
| EW | 3.470.05 | 1.260.05 | 3.920.06 |
| FWHM | 89919 | 83040 | 165553 |
| Night 2 | |||
| EW | 2.700.04 | 0.810.04 | 3.480.05 |
| FWHM | 97023 | 84048 | 173351 |
As expected, all Gaussian separations 1200 km s-1 are affected by the bright S-wave that is present in Fig. 6 and have blue-to-red crossing phase 0.5. Furthermore, Fig. 6 shows that the emission line cannot be distinguished from the continuum at separations 1700 km s-1 (i.e. 26 Å). This only leaves separations between 1300-1600 km s-1, from which we estimate =0.510.01 phase, =1165 km s-1 and =1833 km s-1. Interestingly, our estimate for is compatible with emission that is related to the compact object. Furthermore, both our estimate of and are consistent with the values obtained by Barnes et al. (2007), but due to the higher quality of our dataset we are able to obtain better constraints.
4.3 Doppler Maps
To probe the origin of the different structures in the most prominent emission lines we used the technique of Doppler tomography (Marsh & Horne 1988). This technique also has the advantage that it uses all spectra simultaneously to enhance features that are too faint in the individual spectra. This advantage is in particular important for the Bowen region where the irradiated donor star signature is expected, since the trail (Fig. 6) has shown that the individual spectra do not show anything. Following Barnes et al. (2007), who also applied Doppler tomography to detect the irradiated donor star, we created Doppler maps of the Bowen region for each individual night. We used the ephemeris by Diaz-Trigo et al. (2009), the velocity determined in Sect. 4.2, and included the emission lines that are typically observed in the Bowen region (i.e. N III 4640.64/4634.12 and C III 4647.42/4650.25) to create the resulting maps shown in Fig. 8.
The most important thing to note is that both maps in Fig. 8 are dominated by a single compact spot and that is in the same position, namely situated on the positive -axis, during each night. Since this is the position where a signature of the irradiated donor star is expected, this not only proves that the ephemeris of Diaz-Trigo et al. (2009) is correct, but also that the true orbital period is 0.1639 days (especially since folding the data on the other significant period corresponding with in Fig. 3, gives two spots in anti-phase to each other).
To test that our assumption for is correct we also created Doppler maps of the Bowen region for each night individually by varying the systemic velocity between 130 and 230 km s-1 in steps of 5 km s-1. The spot in both maps was most compact for the velocities around 180-185 km s-1, strongly suggesting that the velocity we determined in Sect. 4.2 is correct. Furthermore for each night we also produced Doppler maps for a range of and note that the spot during the second night is always larger. These tests strengthened our confidence that the differences in the spot characteristics are real, i.e. that the spot during the second night of observations is truly more extended than during the first night.
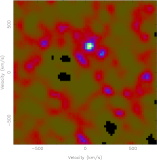
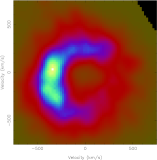
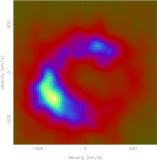
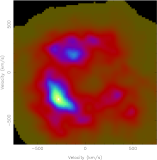
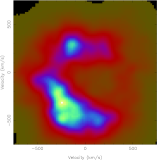
Since the Doppler maps of the Bowen region allowed us to determine the true ephemeris and systemic velocity of GR Mus, we can use these values to create Doppler maps of He II 4686. The resulting maps are shown in Fig. 9, and confirms what was already clear from the trail in Fig. 6. The emission line is dominated by an extended region around orbital phase 0.7-0.8 (i.e. in the bottom left quadrant or close to the negative -axis) that has moved between our observing nights. There appears to be a second, much fainter but more compact spot, that leads the bright region by 0.3 orbital phase (i.e. they are located in the top right quadrant), that has moved by a similar amount as the bright spot between the observations. Furthermore, we also created Doppler maps of H, and they show identical behaviour to the He II maps. However, given that the line is much fainter, thereby producing much lower quality maps, and coupled with the fact that we know from Barnes et al. (2007) that the region is complicated due to the presence of absorption we do not present the resulting maps.

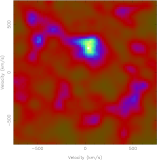
Since we have access to the data by Barnes et al. (2007) we re-created their Doppler maps of the He II 4686 emission line for the two (consecutive) nights where a full orbital period of GR Mus was observed. In Fig. 10 we show the result. We note that these Doppler maps are very similar to that shown in Fig 9, with a bright extended feature in the bottom-left quadrant that moves between nights, and a fainter more compact spot leading the bright spot and moving by a similar amount from night to night (although in these cases only by 0.2 orbital phase, placing the spots in the top-left quadrant). This strongly suggests that the structure in He II 4686 is long lived.
5 Discussion
5.1 Accretion disk morphology
Our 2-week photometric dataset of the LMXB GR Mus shows large morphological changes of its lightcurve from night to night, and provides further evidence for an evolving accretion disk. Diaz-Trigo et al. (2009) suggested that a similar model to that observed in Her X-1, namely a precessing accretion disk that is tilted out of the plane, could also explain the behavior of GR Mus. Although we will show that this model is actually a good description, we think that the mechanism for a tilt of the accretion disk in GR Mus is different than is observed in systems like Her X-1.
More recent modeling of the 35 day super-orbital period of Her X-1 favour a mechanism where the precessing, warped accretion disk is due to strong irradiation by the central X-ray source (e.g. Wijers & Pringle 1999; Ogilvie & Dubus 2001; Leahy 2002). According to Ogilvie & Dubus (2001) such a scenario of radiation-driven warping should only work for LMXBs with orbital periods 1 day, and will not work for systems that have such short orbital periods as GR Mus. However, in the overview of the different mechanisms that could cause periodic morphological changes in the accretion disks of X-ray binaries by Kotze & Charles (2012), they have listed several that could also occur in GR Mus.
One promising effect that could be present in GR Mus is the so-called superhump phenomenon. This effect was first found in a sub-class of Cataclysmic Variables (CVs), namely the SU UMa systems, as the presence of “superhumps” in their lightcurves with periods a few percent longer than their orbital period (see e.g. Warner 1995 for an overview). Although superhumps were originally observed in SU UMa systems, they have also been detected in both black hole LMXBs (see e.g. O’Donoghue & Charles 1996; Zurita et al. 2002) and persistent neutron star LMXBs such as UW CrB (e.g. Hakala et al. 2009). They are thought to be due to a tidal resonance in systems with extreme mass-ratios (i.e. =/0.38) that initiate the precession of the eccentric accretion disk. In our photometric data of GR Mus we do find two significant periods that are only different by a few percent. However, our spectroscopy unambiguously identifies the longer period (corresponding to in Fig. 3) as orbital, and hence the shorter period cannot be attributed to a “standard” (prograde) disk precession due to an eccentric accretion disk (although see Sect. 5.2 below).
So-called negative superhumps, i.e. systems where a second period several percent shorter than the orbital one is present, have also been observed in both CVs and LMXBs (see e.g. Patterson et al. 1993; Retter et al. 2002). The commonly accepted interpretation is that negative superhumps are due to retrograde precession of a tilted disk (e.g. Barrett et al. 1988; Wood & Burke 2007). Although the exact details required to produce a tilted disk that has retrograde precession are still unknown, several promising ideas exist (see Montgomery 2009a for a more extended discussion). For example, a net tidal torque by the secondary on an accretion disk that is fully tilted out of the orbital plane will produce retrograde precession (Montgomery 2009b), while the differing gas streams over and under the accretion disk would produce a lift that is strong enough to cause the tilt (Montgomery 2010).
An important observational parameter is the superhump period deficit =(-/. Using our superhump period and the orbital period by Diaz-Trigo (2009) we estimate for GR Mus that =0.0240.003, which is comparable to what is observed in other systems with a similar period (e.g. Montgomery 2009a). Furthermore, Montgomery & Martin (2010) predicted that for CVs with system dimensions very similar to GR Mus a mass transfer rate of 810-11 yr-1 is enough to lift the accretion disk out of the plane. Since GR Mus has an average accretion rate at least an order of magnitude larger, this scenario could explain the behavior of GR Mus.
The main prediction of this model is that the negative superhumps are produced by the gas stream that (partly) overflows the disk rim and instead produces a bright region where it strikes the face of the accretion disk (Barrett et al. 1988; Wood & Burke 2007). The brightness of this region will vary depending on the amount of material the (for the observer) visible side of the accretion disk receives as the secondary orbits (Montgomery 2009a). Furthermore, the location of this spot would also depend on the precession phase of the tilted disk. Both these effects are visible in our spectroscopic data. In the He II 4686 trail (Fig. 6) we find that the brightness of the spot is modulated as a function of orbital phase, while the corresponding Doppler maps (Figs. 9 & 10) show that the bright region moves from night to night. The only feature that is not naturally explained by a tilted disk is the long-lived feature in Figs. 9&10 that leads the hot-spot by 0.2-0.3 orbital phase. Despite this caveat, we do think that this model gives the best description of our data, and we propose that GR Mus has a disk that is completely tilted out of the plane along its line of nodes in a similar fashion to the negative superhumpers observed in CVs.
Although the proposed origin for the tilt is different, the quantitative model by Diaz-Trigo et al. (2009), which they based on one by Gerend & Boynton (1976), is still correct. Therefore, the main conclusions by Diaz-Trigo et al. (2009) to explain most of the X-ray and optical properties would also still be valid. In this model the optical emission is a combination of the reprocessed emission in the accretion disk plus the irradiated surface of the secondary. The contribution from both components varies depending on the precession phase of the tilted disk, and gives the exact profile of the optical lightcurve during each orbital cycle.


From our observations of the negative superhump period of 0.16000.0004 day plus the orbital period of 0.16388875 day by Diaz-Trigo et al. (2009) we can calculate a precession period of =(-)-1=6.740.07 days. We note that this period is close to twice the wait time between the two “dips” observed in Fig. 1 (around 9.3 and 12.6 days). This is naively what we would expect, since the “dips” will occur when the accretion disk is (as close as possible) aligned with our line of sight. This alignment will occur twice per precession period, and at exactly half a precession period separation. Using the precession period and the time of minimum flux during the second “dip”, we note that none of our observations correspond to the time of any other expected “dip”. Furthermore, we also note that 6.7 days is close to double the 60 hr recurrence period of the X-ray dips found by Diaz-Trigo et al. (2009). Again this is naively what we should expect, since half the time the stream would (mainly) flow “under” the accretion disk where it is blocked from our view, and no dipping is expected during this period. Finally, we divided our photometric dataset into 4 equal phase bins of the 6.7 day precession period and phase-folded the resulting lightcurves on the ephemeris of Diaz-Trigo et al. (2009). In Fig. 11 we present the resulting lightcurves, and note that the shape and amplitude of the lightcurves changes as a function of precession phases. Although each lightcurve in Fig. 11 covers 25% of a precession phase it does illustrate the morphological changes as a function of precession period.

An interesting consequence of the stream overflowing the accretion disk is that there is not necessarily a stream impact region on the rim of the accretion disk. This bulge is typically used to explain the X-ray dips that occur around orbital phase 0.8 (e.g. Motch et al. 1987). Instead, we now have the material overflowing the accretion disk which can then act as a veil covering the X-ray producing regions at certain orbital phases, thereby producing the dips. At other orbital phases the overflowing material would act as the cold and photo-ionized material between the edge and the inner accretion disk, thereby producing the absorption features observed at all orbital and disk precession phases (e.g. Iaria et al. 2007; Boirin & Parmar 2003).
Apart from the change in viewing angle due to the tilt to explain the global characteristics of the dips (as already outlined by Diaz-Trigo et al. 2009), the exact length and strength of each individual dip will also depend on the density and trajectory of the overflowing material. These are components that are much easier to change from orbit to orbit, instead of changing the structure of the stream-impact region, and could explain for example the observations by Courvoisier et al. (1986).
Finally we note that GR Mus is a member of the so-called Atoll sources, i.e. a group of persistently active LMXBs that have similar spectral and timing properties in the X-ray regime (Hasinger & van der Klis 1989). For those Atoll sources where it is known, their orbital periods (4 hrs) and accretion rate are also very similar to that of GR Mus, i.e. all the conditions that made the accretion disk tilt out of the orbital plane in GR Mus are also present in these systems. Coupled with the fact that for CVS there is no correlation between the presence of negative superhumps and any of their system parameters (i.e. they can occur for any value of , , etc; Patterson 1993), it is therefore possible that a tilted disk is a property of the majority of the Atoll sources. Since the inclination in other systems is lower, the effect of a tilted disk will be less obvious (e.g. no dips will be present in X-rays), but that does not exclude the possibility that its effect is observable. For example, at the very least the negative superhump should still be visible in optical photometry and spectroscopy, and could also be an explanation for the sub-Keplerian features that have been observed in the emission lines (in particular He II 4686) of several LMXBs (e.g. Somero et al. 2012). A long-term campaign similar to this one on GR Mus should be able to reveal the presence of a tilted accretion disk in those LMXBs.
5.2 System parameters
Barnes et al. (2007) already concluded that a signature of the irradiated donor star surface is visible in the Bowen region. The updated ephemeris by Diaz-Trigo et al. (2009), together with the clean and clear spots in the Doppler map of the Bowen region (Fig 8) only strengthens this conclusion. In particular the Doppler map of the first night shows a very compact spot at the location very close to where the donor star is expected. From this map we can estimate a radial velocity semi-amplitude of the irradiated surface of =28010 km s-1, and in Fig. 12 we have shifted all spectra into the rest-frame of the donor star to clearly show all the narrow components. We do note that in both nights the spot is just rightward of the -axis (by 30 km s-1). This could either be due to a small error in the phase zero calculations by Diaz-Trigo et al. (2009) or because the left hemisphere of the donor star is obscured by the accretion stream. In any case, this small off-set does not increase the error in the position of the compact spot. Furthermore, we also note that the size of the spot is larger during the second night, and this is most likely due to a lower tilt of the disk blocking less of the donor star surface than during the first night.
Apart from a more accurate estimate of , we also have a better estimate for the radial velocity semi-amplitude of the neutron star (=1165 km s-1). The fact that both estimates of and from the diagnostic diagram were similar to the values that produced the optimal Doppler maps gives us reason to trust our value for . For an ideal LMXB, and together with an estimate for the opening angle of the accretion disk, , would be enough to apply the polynomials of the so-called -correction by Muñoz-Darias et al. (2005). This allows us to obtain the radial velocity semi-amplitude at the center of mass of the donor star (). However, since we now know that GR Mus harbours a tilted accretion disk, it is not possible to apply a “simple” -correction. Instead we can explore what the effect on the system parameters are, assuming that the opening angle in GR Mus is a combination of the traditional disk opening angle plus the tilt of the accretion disk.
De Jong et al. (1996) estimated an opening angle of 12∘ for GR Mus, which is close to the 9-13∘ by Motch et al. (1987). Furthermore, modeling by Motch et al. (1987) showed that the bulge region has an azimuthal height of 17-25∘, which can change to heights 10∘ (Smale & Wachter 1999). Obviously, the true final opening angle will depend on the exact tilt of the disk at the time of our spectroscopic observations. We can still derive an estimate for the -correction using the polynomials by Muñoz-Darias (2005) for opening angles between 8∘ and 14∘. Note that due to the compactness of the spot in Fig. 8(left) we do think larger opening angles are more likely. These -corrections lead to a range for the mass ratio of =0.29-0.35, with increasing for larger opening angles.
Interestingly, for this range of it is possible to have an eccentric accretion disk due to tidal resonance (see Sect. 5.1; Whitehurst 1988). If GR Mus does have an eccentric accretion disk our photometric observations should have shown the presence of positive superhumps. Interestingly, there is the marginal significant peak in Fig. 3 at 5.570.02 d-1 (=0.17950.0007 day). Although uncommon, both negative and positive superhumps have been observed in both CVs and LMXBs (Retter et al. 2002; Olech et al. 2009 and references therein). Furthermore, Patterson et al. (2005) showed that an empirical relationship exists between the superhump period excess (=(-)/=0.18+0.29) and the mass ratio. Assuming that peak is truly a positive superhump (leading to =0.0950.005) we can estimate a mass ratio of =0.33-0.36. This is remarkably close to what we obtain from the -correction.
Retter et al. (2002) found a relation between orbital period and ratio between the period excess and deficit of the two superhumps. Olech et al. (2009) refined this relation by including more CVs that showed both negative and positive superhumps to =/=0.318log-0.161, where is negative and is in days. Although -0.250.006 for GR Mus, and is therefore relatively far removed from the relation of Olech et al. (2009), the scatter in the few points that form this relation is still large. Given that the for GR Mus is not too different compared with other systems that have a similar orbital period, we think it provides another indication that the positive superhump could be real.
We can further constrain the mass of GR Mus if we assume that it truly harbours an eccentric precessing accretion disk, and that the relationship between and by Patterson et al. (2005) is true (thereby providing the strongest constraint on of 0.33-0.36). First of all, from the fact that GR Mus does not show any eclipses we can obtain an upper-limit on the inclination of 73∘ (Paczynski 1974). However, the true inclination will depend on both the tilt of the accretion disk and its opening angle, and could be 12-15∘ lower. Under the assumption that the inclination is close to =73∘, we obtain a mass of the neutron star of 1.30.2, which is very close to the canonical mass of a neutron star. However, if we only assume that 73∘, we obtain a lower-limit on the neutron star mass of 1.2 (95% confidence level).
Finally, taking into account that modeling by Motch et al. (1987) gives a lower limit on the inclination of 65∘, we obtain a maximum mass on the neutron star of 1.8 (95% confidence). This suggests that the largest uncertainty to obtain the mass of GR Mus is the inclination, which can hopefully be better constrained with detailed modeling of our lightcurves.
6 Conclusions
We have detected the presence of superhumps in our 14 nights of photometric observations of the LMXB GR Mus. Together with 24 hrs of spectroscopic observations we identify them as negative superhumps, which are due to an accretion disk that is completely tilted out of the orbital plane along its line of nodes and shows retrograde precession. This not only gives strong support to the model proposed by Diaz-Trigo et al. (2009), but also provides a theoretical framework for further modeling of the optical and X-ray lightcurves of GR Mus. Due to its high inclination we think that GR Mus is an intriguing candidate to further our understanding of negative superhumps. In particular, the existing X-ray observations provide an excellent way to probe the effect of a tilted disk on our view of the inner accretion disk, while the photometry does the same for the outer accretion disk.
Furthermore, we also find marginal evidence for the presence of an eccentric accretion disk in the form of positive superhumps. If true, this provides strong constraints on the mass ratio, and together with our constraints on and modeling of the inclination by Motch et al. (1987) gives a mass of the neutron star of 1.2/1.8 (95% confidence level). Interestingly, we also note that the modeling of the opening angle of the accretion disk by Motch et al. (1987) give =9-13∘. This angle is very similar to that needed to provide the proper -correction (namely 12-15∘) using the polynomials by Muõz-Darias et al. (2005). This does suggest that we have obtained a consistent set of system-parameters, with the largest uncertainty remaining the inclination of GR Mus.
Acknowledgments
This work is based on data collected at the South African Astronomical Observatory and the European Southern Observatory, Paranal, Chile [Obs. Id. 089.D-0274]. We acknowledge the use of PAMELA and MOLLY which were developed by T.R. Marsh, and the use of the on-line atomic line list at http://www.pa.uky.edu/peter/atomic. RC acknowledges a Ramon y Cajal fellowship (RYC-2007-01046) and a Marie Curie European Reintegration Grant (PERG04-GA-2008-239142). RC and JC acknowledge support by the Spanish Ministry of Science and Innovation (MICINN) under the grant AYA 2010-18080. This program is also partially funded by the Spanish MICINN under the consolider-ingenio 2010 program grant CSD 2006-00070.
References
- Barnes (2007) Barnes A.D., Casares J., Cornelisse R., Charles P.A., Steeghs D., Hynes R.I., O’Brien K. 2007, MNRAS, 380, 1182
- Barrett (1988) Barrett P., O’Donoghue D., Warner B., 1988, MNRAS, 233, 759
- Boirin & Parmar (2003) Boirin L., Parmar A.N., 2003, A&A, 407, 1079
- Charles & Coe (2006) Charles P.A., & Coe M.J., 2006, in “Compact stellar X-ray sources”, Cambridge Astrophysics series, No. 39, Cambridge University Press, p. 215
- Cornelisse et al. (2008) Cornelisse R., Casares J., Muñoz-Darias T., Steeghs D., Charles P.A., Hynes R.I., O’Brien K., Barnes A.D., 2008, “A Population Explosion: The Nature & Evolution of X-ray Binaries in Diverse Environments”, AIP Conf. Proc., Vol. 1010, p. 148
- Courvoisier et al. (1986) Courvoisier T.J.L., Parmar A.N., Peacock A., Pakull M., 1986, ApJ, 309, 265
- Diaz-Trigo et al. (2009) Diaz-Trigo M., Parmar A.N., Boirin L., Motch C., Talavera A., Balman S., 2009, A&A, 493, 145
- Gerend & Boynton (1976) Gerend D., & Boynton P.E., 1976, ApJ, 209, 562
- Griffiths et al. (1978) Griffiths R.E., Gursky H., Schwartz D.A., Schwarz J., Bradt H., Doxsey R.E., Charles P.A., Thorstensen J.R., 1978, Nature, 276, 247
- Hakala et al. (2009) Hakala P., Hjalmarsdotter L., Hannikainen D.C., Muhli P., 2009, MNRAS, 394, 892
- Hasinger (1989) Hasinger G., & van der Klis M., 1989, A&A, 225, 79
- Horne (1986) Horne K., 1986, PASP, 98, 609
- Iaria et al. (2001) Iaria R., Di Salvo T., Burderi L., Robba N.R., 2001, ApJ, 548, 883
- Iaria et al. (2007) Iaria R., di Salvo T., Lavagetto G., D’Ai A., Robba N.R., 2007, A&A 464, 291
- de Jong et al. (1996) de Jong J.A., van Paradijs J., Augusteijn T., 1996, A&A, 314, 484
- Kotze & Charles (2012) Kotze M.M., & Charles P.A., 2012, MNRAS, 420, 1575
- Leahy (2002) Leahy D.A., 2002, MNRAS, 334, 847
- MarshHorne (1988) Marsh T.R., Horne K., 1988, MNRAS 235, 269
- Mason (1980) Mason K.O., Middleditch J., Nelson J.E., White N.E., 1980, ApJ, 242, L109
- Montgomery (2009) Montgomery M.M., 2009a, MNRAS, 394, 1897
- Montgomery (2009) Montgomery M.M., 2009b, ApJ, 705, 603
- Montgomery (2010) Montgomery M.M., 2010, ApJ, 722, 989
- Montgomery & Martin (2010) Montgomery M.M., & Martin E.L., 2010, APJ, 722, 989
- Motch et al. (1987) Motch C., Pedersen H., Courvoisier T.J.L., Beuermann K., Pakull M.W., 1987, ApJ, 313, 792
- Muñoz-Darias et al. (2005) Muñoz-Darias T., Casares J., Martinez-Pais I.G., 2005, ApJ, 635, 502
- O’Donoghue (1996) O’Donoghue D., & Charles P.A., 1996, MNRAS, 282, 191
- Ogilvie & Dubus (2001) Ogilvie G.I., & Dubus G., 2001, ApJ, 553, 158
- Olech et al. (2009) Olech A., Rutkowski A., Schwarzenberg-Czerny A., 2009, MNRAS, 399, 465
- Paczynski (1974) Paczynski B. 1974, A&A, 34, 161
- Patterson et al. (1993) Patterson J., Thomas G., Skillman D.R., Diaz M., 1993, ApJS, 86, 235
- Patterson et al. (2005) Patterson J., Kemp J., Harvey D.A., Fried R.E., Rea R., Monard B., Cook L.M., Skillman D.R., Vanmunster T., Bolt G., et al. 2005, PASP, 117, 1204
- Retter et al. (2002) Retter A., Chou Y., Bedding T.R., Naylor T., 2002, MNRAS, 330, L37
- Scargle (1982) Scargle J.D., 1982, ApJ, 263, 835
- Schechter et al. (1993) Schechter P.L., Mateo M., Saha A., 1993, PASP, 105, 1342
- Schneider (1980) Schneider D.P., Young P., 1980, ApJ, 238, 946
- Smale et al. (1992) Smale A.P., Mukai K., Williams O.R., Jones M.H., Corbet R.H.D., 1992, ApJ, 400, 330
- Smale & Wachter (1999) Smale A.P., & Wachter S., 1999, ApJ, 527, 341
- Smale et al. (2002) Smale A.P., Church M.J., Bałucinska-Church M., 2002, ApJ, 581, 1286
- Somero et al (2012) Somero A., Hakala P., Muhli P., Charles P., Vilhu O., 2012, A&A, 539, 111
- Steeghs & Casares (2002) Steeghs D., & Casares J., 2002, ApJ, 568, 273
- Stellingwerf (1978) Stellingwerf R.F, 1978, ApJ, 224, 953
- Warner (1995) Warner B., 1995, Ap&SS, 226, 187
- White & Swank (1982) White N.E., & Swank J.H., 1982, ApJ, 253, L61
- Whitehurst (1988) Whitehurst R., 1988, MNRAS, 232, 35
- Wijers & Pringle (1999) Wijers R.A.M.J., Pringle J.E., 1999, MNRAS, 308, 207
- Wood & Burke (2007) Wood M.A., Burke C.J., 2007, APJ, 661, 1042
- Zurita (2002) Zurita C., Casares J., Shahbaz T., Wagner R.M., Foltz C.B., Rodriguez-Gil P., Hynes R.I., Charles P.A., Ryan E., Schwarz G., & Starrfield S.G., 2002, MNRAS, 333, 791