Novel behaviors of monolayer quantum gases on Graphene, Graphane and Fluorographene
Abstract
This article discusses the behavior of submonolayer quantum films (He and H2) on graphene and newly discovered surfaces that are derived from graphene. Among these substrates are graphane (abbreviated GH), which has an H atom bonded to each C atom, and fluorographene (GF). The subject is introduced by describing the related problem of monolayer films on graphite. For that case, extensive experimental and theoretical investigations have revealed that the phase diagrams of the bose gases 4He and para-H2 are qualitatively similar, differing primarily in a higher characteristic temperature scale for H2 than for He. The phase behaviors of these films on one side of pristine graphene, or both sides of free-standing graphene, are expected to be similar to those on graphite. We point out the possibility of novel phenomena in adsorption on graphene related to the large flexibility of the graphene sheet, to the non–negligible interaction between atoms adsorbed on opposite sides of the sheet and to the perturbation effect of the adsorbed layer on the Dirac electrons. In contrast, the behaviors predicted on GF and GH surfaces are very different from those on graphite, a result of the different corrugation, i.e., the lateral variation of the potential experienced by these gases. This arises because on GF, for example, half of the F atoms are located above the C plane while the other half are below this plane. Hence, the He and H2 gases experience a very different potentials from those on graphite or graphene. As a result of this novel geometry and potential, distinct properties are observed. For example, the 4He film’s ground-state on graphite is a two-dimensional (2D) crystal commensurate with the substrate, the famous R30o phase; on GF and GH, instead, it is predicted to be an anisotropic superfluid. On GF the anisotropy is so extreme that the roton excitations are very anisotropic, as if the bosons are moving in a multiconnected space along the bonds of a honeycomb lattice. Such a novel phase has not been predicted or observed previously on any substrate. Also, in the case of 3He the film’s ground-state is a fluid, thus offering the possibility of studying an anisotropic Fermi fluid with a tunable density. The exotic properties expected for these films are discussed along with proposed experimental tests.
1 Introduction
The properties of monolayer films are core subjects within the fundamental sciences of chemistry and physics, as well as the more applied fields of chemical engineering, electrical engineering and materials science. From a basic science perspective, this subject is enriched by the wide range of phenomena exhibited by the various substrate/film combinations [1]. This article reviews a subset of these problems - quantum films on graphene-related substrates at low temperature. For such systems, quite novel behaviors have been predicted, with many open questions to address. This article describes both problems that are relatively well understood (i.e., films on graphite) and those that have just begun to be investigated. We restrict the focus to helium and hydrogen films because these exhibit similar, intriguing behaviors in spite of having rather different bulk phase properties. We note at the outset that uncertainty about interaction models exists even for the problem of adsorption on graphite; the newly studied systems -graphene and its derivatives- present significantly greater uncertainty in the interactions.
The subject of monolayer quantum films has an intriguing history. Considerable attention has been devoted to a highly idealized problem: the helium film in mathematical two-dimensions (2D), an appropriate model if the third dimension has no significant role. This model was a logical subject of investigation because superfluidity (SF) and Bose-Einstein condensation (BEC) are fundamentally important subjects that have been extensively investigated in 3D. From that research, there has emerged a consensus, beginning with the work of Fritz London, that BEC and SF are causally related properties of bose fluids in 3D. Given this background, particular interest in the subject of He monolayer films was piqued by an apparent contradiction of this consensus view: 4He films down to a few layer thickness were known experimentally to exhibit SF, while rigorous theorems demonstrated that BEC cannot exist in such films at any nonzero temperature [2] . The resolution of this paradox first emerged in the 1970’s, with the introduction, by Kosterlitz and Thouless and by Berezinski, of the concept of topological long range order (TLRO) [3, 4]. This view affirms that while infinite long range order (of the superfluid order parameter) associated with BEC does not exist in 4He films at finite , the decay with distance (an algebraic function) of the two-point correlation function of the local order parameter is sufficiently slow that such very long range correlations suffice to yield SF.
This TLRO hypothesis is more than qualitative; theory predicts that the superfluid density has a jump from a finite value to zero at the transition temperature and yields an explicit relationship for the ratio , with being determined by an instability of the superfluid with respect to unbinding of quantized vortices [4], a prediction that has been confirmed experimentally in multilayer 4He films [5]. The nature of this 2D transition is thus completely different from that of the 3D SF transition (for which vanishes in a continuous way at with a critical behavior in the universality class of the XY model). In 3D, the transition temperature is conventionally described by the phenomenological Landau model, in which the value of is derived from the spectrum of elementary excitations, and by a complementary view, which identifies the transition as the point when BEC disappears.
One may question the relevance of the idealized 2D model of a monolayer film, insofar as the model ignores the substrate, apart from its nominal role of confining the atoms to a plane. Indeed, the experimental behavior of most monolayer films is significantly affected by the substrate surface’s structure. In addition, superfluidity disappears altogether when the film thickness becomes one or two layers, depending on the substrate- the so-called “inert layer”. Many experimental studies have been carried out on disordered materials, in which case the resulting behavior can be quite complicated and different from that expected to occur on ordered surfaces. In fact, there are relatively few studies to date of quantum monolayers on well-characterized, flat surfaces. The principal reason for this is experimental: thermodynamic, structural and scattering probes of films require ”high surface area” materials, meaning those with a high ratio of exposed surface area to volume . This constraint is particularly acute for the quantum films, He and H2, since many conventional surface techniques (e.g., STM, LEED, AFM) are not feasible with these very weakly bound films because the probe itself alters these films. Fortunately, there is at least one class of materials (layered materials) which provide both high surface area and ordered, planar surface facets. Graphite is the most studied member of this group. For example, one commercially available form of porous carbon, Grafoil, possesses specific area of order 20 m2 per gram and presents exposed graphitic facets of characteristic lateral extent greater than 100 Å. This fortunate situation is a consequence of the anisotropy of graphite, i.e. the strong intra-planar binding compared to the weak inter-planar bonding. This anisotropy lets extended facets survive the treatment used to prepare the substrate in high surface area form. Since the 2D density () of monolayer He or H2 on this surface is atoms/Å2, one gram of substrate (corresponding to atoms of carbon and surface area m2) yields a relatively high ratio of monolayer He atoms or H2 molecules to substrate C atoms: . The relative contribution of the film to the thermal properties is significantly enhanced above this ratio because the thermal “background” contribution from the graphite substrate is relatively small at low . Thus, the total specific heat can possess a measurably large contribution from a submonolayer film even though the film represents a minute fraction of the atoms present.
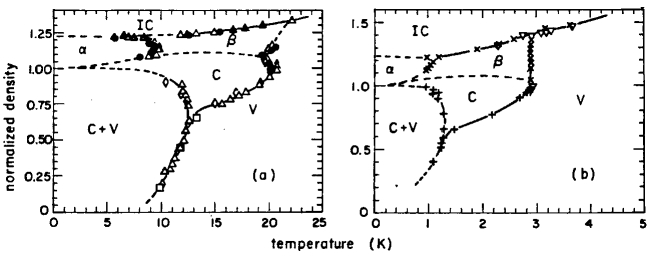
The importance of the substrate in understanding quantum films became evident with the detailed exploration of the phases of He and H2 on graphite, beginning in the late 1960’s. This work has been the subject of several reviews [6, 7, 8]. Phase diagrams for these systems [9] are shown in figure 1. The “normalized density” label of the ordinate scale refers to the ratio of the actual 2D density to that of a commensurate phase ( atoms/Å2). The latter phase, denoted C, is seen to be a prominent feature of both He and H2 monolayers. It is a R30o phase, for which the adatoms occupy 1/3 of the strong binding sites, localized above the centers of the graphite hexagons. This C phase is also present for 3He with an order-disorder transition at a temperature K, essentially identical to that for 4He.
Given such intriguing properties of the quantum films on graphite, one may wonder about the properties to be found for such films on related materials. The present paper explores this problem, with a focus on graphene and two graphene-derived materials, fluorographene (abbreviated GF) [13] and graphane (GH) [14, 15]. These new substrates are obtained from graphene by chemically bonding F or H, respectively, to the C atoms.
The title of this article includes the words “novel behaviors”. Let us summarize what these words refer to, even though space considerations limit our discussion of some of these topics:
-
1.
The strongest binding adsorption potential for these gases;
-
2.
The most corrugated potential, with a novel periodicity;
- 3.
-
4.
An unusual wetting transition on graphene, due to the interaction between adsorbed molecules on opposite sides of free-standing graphene [18];
-
5.
Anticipated large mutual elastic interaction between adatoms, due to the flexibility of graphene [19];
-
6.
Unique controllable “tunability”, with adsorption, of the novel electronic states of graphite [20];
-
7.
Possible novel existence of a two-dimensional 3He liquid ground state;
-
8.
Imbibition transition, in which gas lifts a graphene sheet off of a silica substrate [21];
-
9.
The possibility of two alternative commensurate structures of these films on free-standing graphene.
The next section reviews our current understanding of monolayer adsorption on graphite. In Section 3, we discuss the differences between that behavior and that expected on a free-standing graphene substrate. Sections 4 and 5 describe the very unusual properties that have been predicted recently for the quantum films on GF and GH. To the best of our knowledge, no experiments have tested these predictions thus far. We hope that the exotic behaviors that we describe here will stimulate such investigations. Our conclusions and outlook for the future are contained in Section 6.
2 Monolayer quantum films on Graphite
Figure 1 exhibits an intriguing variety of phases for 4He and H2. Such behavior is completely different from what would occur for the idealized 2D version of these phase diagrams, which would be qualitatively similar to that of 3D He, differing by the absence of commensurate phases and those denoted and in the figure. There remains some controversy about aspects of the monolayer behavior (i.e., the phase boundaries and their interpretations), a situation we shall not address here [22, 23, 24, 25, 26, 27, 28]. Instead, we will describe and interpret the principal features of the various monolayer phases, for which there does exist a consensus opinion.
At low and K, the He film behaves like a weakly interacting 2D gas, with small, but observable, quantum–statistical effects. This behavior was first seen in experiments of the groups of Dash and Vilches at the University of Washington (UW) and Goodstein at Caltech [9, 22]. In particular, the high T specific heat reached the classical 2D limit (). Siddon and Schick demonstrated for both 3He and 4He isotopes that the experimental specific heat data above K can be understood in terms of a 2D quantum virial expansion [29], in which the virial coefficients (distinct values of for the two isotopes due to different spin and therefore statistics) were calculated from a Lennard-Jones (LJ) interatomic potential,
| (1) |
Their 2D analysis employed the same interaction parameters (, 2.56 Å) which are consistent (approximately) with the thermodynamic and structural behavior of 3D helium. The agreement between that virial expansion and the experimental data of the UW group [9] indicated that the low density behavior was quantitatively described by such a 2D model. This finding was very encouraging, insofar as no adsorption system had ever demonstrated such consistency with a 2D theory prior to this work. Refinements of the Siddon-Schick analysis were proposed subsequently, including (a) the use of substrate screening of the pair potential, a 10% effect [30, 31], and (b) the demonstration that the single particle properties exhibit band structure effects arising from the periodic adsorption potential [32, 33].
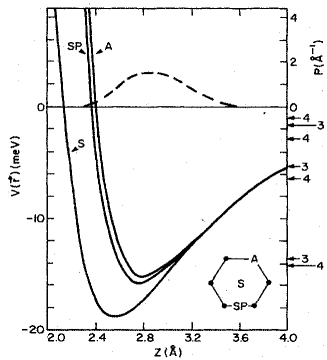
Fig. 2 shows results of semiempirical calculations of the adsorption potential of 4He/graphite and the corresponding band structure [32, 33, 34]. One observes that the lateral variation of the potential well-depth across the surface is of order 15% and the band gaps induced by this corrugation are of order 0.2 meV 2 K. The effective mass enhancement for 4He is modest: ( is the bare mass). These findings might be described as “weak corrugation”, since the lowest band width is much larger ( 10 K) than the gap. That fact explains why the strictly 2D virial analysis is essentially consistent with the experimental data at low . However, there does exist one dramatic consequence of the corrugation, the commensurate phase, which is seen to dominate the monolayer phase diagrams of both gases. It may seem paradoxical that the corrugation potential can be neglected in one regime of coverage but have a significant effect in another regime. One way to rationalize these quite distinct behaviors is to recognize that the thermal de Broglie wavelength for these particles is large compared to the spacing ( 2.5 Å) between hexagons at low temperature ; a He atom (mass 4 amu), has 9 Å at K, four times the lattice constant. While single atoms therefore manifest weak effects of the corrugation, many-particle systems show large effects- the C phases. The analysis of this latter problem is necessarily subtle, requiring detailed quantum statistical calculations. This subtlety is evident from the observed “reentrant” role of the corrugation potential, as a function of atomic diameter . While the corrugation is critically important for the quantum films (characterized by a small value of ), the effect is essentially negligible for Ar, with an intermediate size , but the corrugation becomes important again for gases (CH4, Kr and Xe) with larger values of .
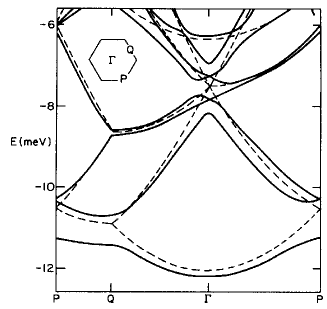
The band structure in Fig. 2 is based on energy band theory and that computation takes into account a large but finite number of Fourier components of the adsorption potential. We have computed the lowest excited state of the single 4He, 3He and H2 as function of the wave vector by a quantum Monte Carlo method described in the next section. As adsorption potential for He we have used the same potential as in ref. [32] and for H2 the potential from ref. [37]. The lowest energy bands along some of the principal directions are shown in Fig. 3 together with a fit based on a nearest neighbor (n.n.) and a next-nearest-neighbor (n.n.n.) tight binding model:
| (2) | |||
Here and are the nearest neighbor and next-nearest neighbor coupling constants and Å is the distance between two carbon atoms. The parameters and have been obtained by fitting the band structure dispersion data displayed in Fig. 3 and take the following values (in Kelvin units): for 3He = 1.70(1), = 0.37(1). For 4He and D2: =1.08(1), = 0.18(1) and for H2 =2.77(2), = 0.63(2).
The band energy of H2 and of D2 on graphite have not been evaluated previously. In table 1 the effective mass at the point are given and in the case of the He isotopes compared with those given by the energy band theory [32]. Note that none of these mass enhancements is large, consistent with the wide bands and the delocalized single particle wave functions.
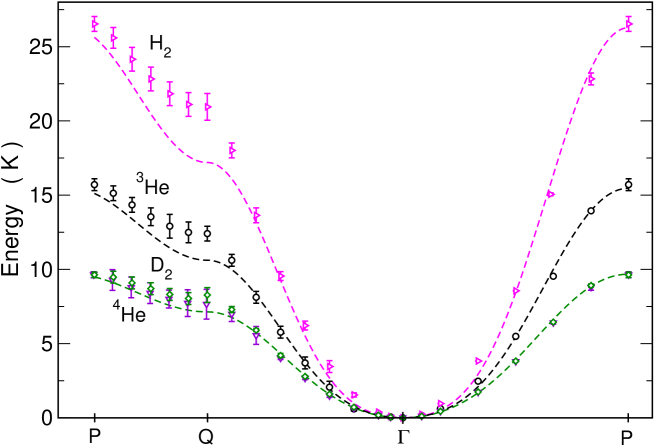
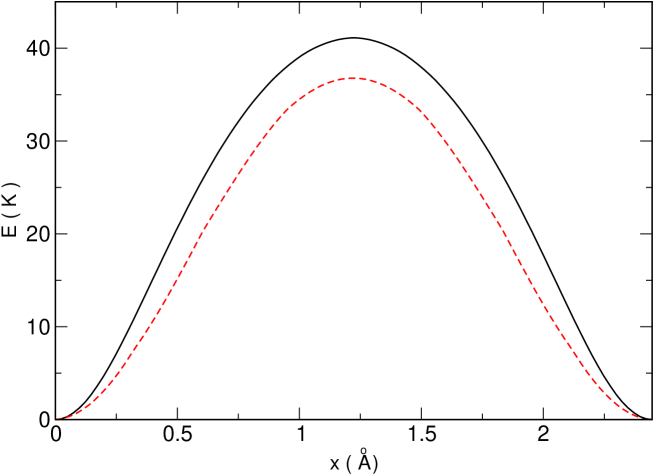
Note in Fig. 3 the near coincidence of the band structures of 4He and D2. This behavior is a result of the near compensation of two differences: the greater mass 4He of is accompanied by a somewhat greater curvature (and potential barrier to translation), as seen in Fig. 4, so the effective frequency of low energy oscillation is similar to that of D2.
| Adsorbate | |
|---|---|
| H2 | 1.03 |
| D2 | 1.10 |
| 3He | 1.08 (1.04) |
| 4He | 1.10 (1.06) |
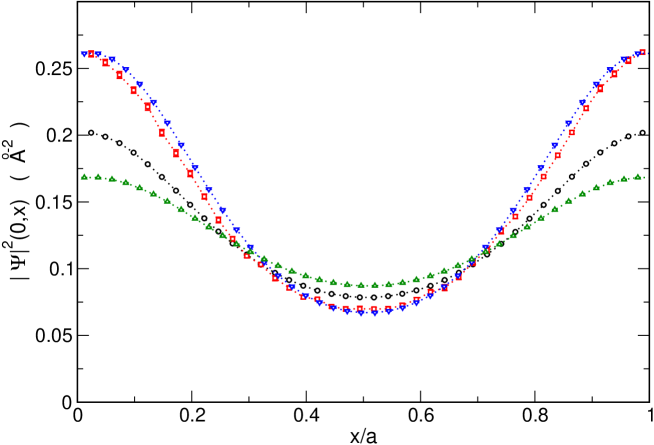
In Fig. 5 the square of the ground state wave function is plotted along the direction connecting neighboring adsorption sites for 3He, 4He, H2 and D2. Again one can notice the similarity of of 4He and D2.
At intermediate coverage, the phase diagrams of these quantum particles in Fig. 1 are seen to be dominated by the R30o phase. One of the very interesting features of the associated order-disorder transition (melting of the commensurate solid) involves the critical temperature of this transition [38, 39]. First, we note that the value of is virtually independent of isotopic species. That is, K for both 3He and 4He while K is common to both H2 and D2. This isotope-independence is striking since the zero-point energy (ZPE) differs by a factor in the two He cases and the ZPE usually plays a prominent role in the physics of condensed quantum fluids; the factor is even larger (1/2) for H2. The explanation of the mass-independence of in the present case is the dominant role played by the highly corrugated adsorption potential. That contribution to the energy localizes the He atoms (H2 molecules), to an extent apparently indifferent to the mass, and this localization energy is overcome only by thermal energy, with ZPE playing a relatively small role. The ratio (20 K)/(3 K) 7 of the two disordering temperatures is presumably due to the significantly larger mutual interaction potential in the hydrogen case than for He.
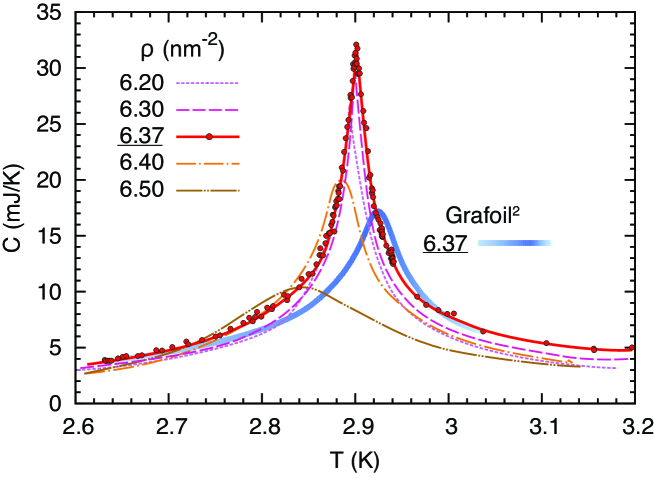
Most of the phase transition behavior attributed to these adsorbates has been identified by and characterized with the specific heat data. One significant example is the commensurate solid melting transition, for which the specific heat of 4He is shown in Fig. 6 for two varieties of graphite substrate [40, 24, 41]. The dramatic peaks in the data rise a factor 10 above the value expected for a 2D classical ideal gas: , i.e. cal/(mol-K). When first seen in 1971 [38]. this transition’s dramatic signature was the most unequivocal thermodynamic evidence of a phase transition in any submonolayer film. Its prominence in the plane helps to confirm the commensurate film coverage which is determined by the spacing (4.26 Å) between second neighbor adsorption sites on graphite. (Neighboring sites are too close, 2.46 Å apart, to become occupied, given the hard-core diameter 2.6 Å of both He and H2.) As seen in Fig. 6, the divergent behavior of the specific heat is most striking at the corresponding density, =0.0637 Å-2. The and dependences of were found to be consistent with the 3-state Potts model, in which the atoms occupy a sublattice corresponding to 1/3 of the available sites. That model, proposed by Alexander [42], groups adsorption sites into sets of three; a variable (1, 2 or 3) is then determined by which specific site (among the three possible sublattices on graphite) is occupied among the group of three sites. The film’s total energy within this model is determined by the interaction between neighboring groups, which is determined by where the relevant atoms are located. The 3-state Potts model is analogous to the 2-state Potts model, i.e., the Ising model, for which there are two choices for the variable characterizing the site occupation; Ising behavior was observed for 4He/Kr/graphite by Tejwani et al. [43], for which the geometry corresponds exactly to that of the Ising model (with two equivalent sets of adsorption sites). Within the spirit of modern phase transition theory, the Ising and Potts models capture the essential physics of their respective transitions, because they incorporate the correct symmetry of each problem. Even though the short-range interaction is oversimplified and the long-range interaction is completely omitted, the critical behavior of these models arises from long-range correlations, which are accurately described by the models. Specifically, the 3-state Potts model predicts that near the transition, the heat capacity is proportional to , where is the critical temperature and =1/3. The agreement with the measured critical value () for this transition on graphite represents a major success for both theory and experiment [40, 41, 44].
Fig. 6 also demonstrates the sensitivity of the thermodynamic measurements to surface quality, especially near the critical transition. The data are shown for both Grafoil and an alternative material, ZYX Graphite. The ZYX facets are an order of magnitude larger than those of Grafoil, but the specific area (2 m2 per gram) of ZYX is an order of magnitude smaller; the price paid by this much lower specific area of ZYX is not a problem when analyzing the singularity, since the background specific heat of the substrate is a smooth function of . One observes in Fig. 6 that the full-width at half maximum of the sharpest peak on ZYX is about 0.05 K, one-half the width on Grafoil. The narrower critical region and higher peak value in the ZYX data reflect the relative absence of inhomogeneous broadening; the correlation length diverges at and one comes closer to model ideal with ZYX than with Grafoil.
We turn next to the high density phase, labeled IC in figure 1, seen with the approach of the coverage to monolayer completion ( atoms/Å2 for 4He and H2, while atoms/Å2 for 3He). This full monolayer phase is an incommensurate 2D solid for both helium and hydrogen. We note that the very high density reflects a factor of 3 compression relative to the 2D ground state phase density ( atoms/Å2). There are two reasons for this large compression. One is simply that these 2D quantum fluids are highly compressible. For example, the sound speed of 2D 4He is predicted [49] to be , about 1/3 of the value for 3D 4He.
The other reason for the huge compression of the monolayer involves the substrate potential. Note that the monolayer coverage represents the point when particles begin to occupy a second layer of the film. This is also the point when the coverage increases rapidly as a function of chemical potential. In the case of adsorption on graphite, is a particularly high coverage because the potential binding the particles to the surface is so attractive; the well-depth meV K (Fig. 2) greatly exceeds all other energies in the problem. In fact, this value was once believed to be more attractive than the adsorption potential for He on any other surface. That statement, however, now needs to be modified, according to our group’s recent results on the GF surface, discussed in Section 4 below.
An intriguing region of these phase diagrams ( and phases) is confined within a narrow coverage domain near . The phase(s) in this region are variously interpreted as a striped incommensurate phase or a reentrant fluid phase. Although its nature is not yet resolved conclusively, the narrow peaks in the heat capacity data [50] leave no doubt that there is such a transition, occurring near 1K for He and 10 K for H2.
From the theoretical point of view most of the ab–initio studies for given atom–substrate and atom–atom potentials deal with Bosons in mathematical 2D [51, 52] or in a translationally invariant adsorption potential [53]. This modeling is not realistic for He or H2 on graphite due to the strong corrugation of the adsorption potential. For instance the ground state of 4He for such models is a superfluid and not a commensurate non–superfluid state as shown by experiment. Only when a realistic representation of the corrugated adsorption potential is used one finds good agremment with experiments. Only few exact microscopic quantum simulations of submonolayer films of 4He and H2 on graphite taking into account the effect of the corrugation for the subtrate potentials have been performed. The simulations were carried out at finite temperature with the path integral monte carlo (PIMC) method [45, 46, 26, 47, 27] and at zero temperature with the Diffusion Monte Carlo method [48]. First 4He on graphite was studied finding the R30o commensurate phase as the stable phase at low coverages [45]; at a coverage below 1/3 these simulations provided evidence that the low-density monolayer consists of solid clusters coexisting with a low–density vapor. The decisive role of the substrate corrugation in stabilizing the commensurate 1/3 phase was assessed as well as the presence of an incommensurate triangular solid phase was proved in a subsequent publication by the same group [46]. More recently, new accurate PIMC simulations have enriched the monolayer phase diagram finding, at higher coverage than the 1/3 phase, a new commensurate (7/16) phase before the incommensurate solid phase [27]; the two commensurate phases were found separated by a domain–wall phase. The role of the substrate corrugation for submonolayer molecular hydrogen on graphite was investigated in ref. [26]. At low temperature the phase diagram was found qualitatively similar to the one of 4He. The transition to an incommensurate solid was studied in a later work [47].
Note that the phase diagrams presented above show no liquid-vapor transition for either H2 or 4He. Such a condensation transition is predicted by a strictly 2D theory [54], but this transition can be preempted by the commensurate phase on bare graphite. Greywall, however, [24] has interpreted his heat capacity data for 4He on graphite as showing a liquid-vapor transition at low coverage, contrary to Fig. 1. This evidence and interpretation are not supported by any other experiments. On the theoretical side, numerous calculations for 4He on graphite agree with the phase diagram of Fig. 1 in the sense that there exists no liquid-vapor transition. Instead, at low and low the commensurate solid is predicted to coexist with a low-density vapor [45, 46]. In principle, the presence, or absence, of a liquid-vapor transition at coverage below that of the commensurate state depends crucially on the corrugation of the adsorption potential. Above a threshold corrugation, the C phase is stable relative to the liquid, a conclusion consistent with nearly all of the experiments and calculations for graphite.
The case of 3He at low density may provide a contrasting phase behavior to that of 4He. Note, first of all, that the 2D ground state of 3He (unlike 4He) is predicted to be a gas; that is, there is no condensation transition [55, 56]. What about 3He on graphite? There is evidence for this isotope that a very low temperature condensation transition does occur at remarkably low density. The transition behavior deduced from specific heat measurements by Sato et al [57] appears in Fig. 7, [58] with speculation concerning the details of the coexistence curve, especially the critical temperature (denoted in the figure). The 3He liquid ground state is seen to have density Å-2, 1/6 that of 4He; the mean interparticle spacing at the critical density is quite large: Å, reflecting the marginal binding of this phase.
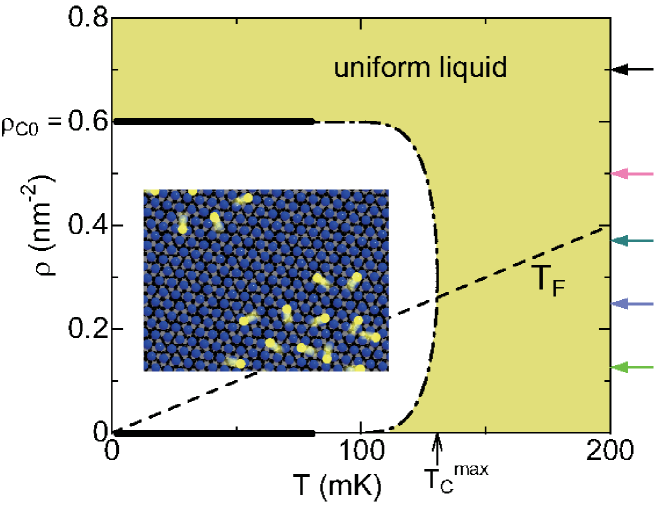
These very recent observations would appear to be inconsistent with calculations showing that a 3He gas does not condense in a strictly 2D world [55, 56], a consequence of quantum statistics since a 2D bose fluid of (imaginary) He atoms with mass 3 amu would be expected to condense [55]. However, on the basis of an approximate variational computation it has been argued [59] that the out-of-plane motion of the film reduces the condensed phase energy, so that the ground state on graphite is a self-bound quasi-2D liquid. This result has not yet been confirmed by more advanced QMC methods like those used to study 3He in 2D [55, 56]. Note in this figure the very low values of the ground state density, 0.006 Å-2. Comparison can be made with the corresponding quantity for 3He in 3D: Å-3; scaling the latter quantity in a plausible way yields a nominal “scaled” 2D density Å-2. The order of magnitude lower values on the graphite surface reflect the very weak binding of this quasi-2D 3He fluid (compared to the 3D case). Another basis for comparison is the behavior predicted [52] for the critical point of 4He in 2D: Å-2 and K, manifestly higher values than for 3He. With respect to the presence of a liquid-vapor coexistence at very low coverage we notice that the size of the graphitic facets could have a significant role. With an interparticle distance of order 10 Å on a facet of lateral extent of order 100 Å typical of Grafoil, on each facet the number of He atoms is of order 100 and no sharp transition can be expected with such small number of atoms. Should a liquid–vapour transition exist for 4He on graphite as for 3He this should be seen only on graphite material with much larger facets like ZYX graphite.
3 Quantum films on Graphene
3.1 General comments
Most treatments of He or H2 adsorption on graphite evaluate the potential energy, of an adparticle at position , as a pairwise sum of contributions from the C atoms, at positions :
| (3) |
Here is the two-body interaction between a C atom and the adparticle. H2 is often treated as though it is one spherically symmetric particle, although such an approach omits the anisotropy of the molecule. This is appropriate at low because the H2 molecules are in the rotational ground state and the adsorption potential does not include any large electrostatic terms, which would couple to the molecular orientation. 222 in the case of H2 in a nanotube, there has been predicted to occur a significant breaking of the rotational symmetry, in agreement with neutron scattering data which reported a breaking of the L-manifold degeneracy. See D. G. Narehood, M. K. Kostov, P. C. Eklund, M. W. Cole, and P. E. Sokol, “Deep Inelastic Neutron Scattering of H2 in Single–Walled Carbon Nanotubes”, Phys. Rev. B 65, 233401 (2002). Eq. (3) can be rewritten as a sum over graphitic layers, with the top layer providing the adsorption potential () on graphene. Within this 2-body approximation, Eq. (3), the difference between adsorption potentials on graphene and graphite corresponds to the net contribution from all layers below the exposed top facet. For the case of the quantum gases, the equilibrium distance above graphite is Å[60], which means that corresponds to the interaction energy contributed by a graphite half-space located beyond a perpendicular distance Å = 6.3 Å from the adatom. Because is so large, this difference potential involves only attractive interactions and is nearly invariant with respect to translation of the adparticle. Thus, the lateral variation (“corrugation”) experienced by a monolayer film is essentially identical for the graphene () and graphite () cases. Representing the “missing” half-space as a continuum, at distance from the adatom, we can approximate the monolayer potential on graphene with the relation derived from summing the attractive part of Eq. (3) over the missing substrate layers, each of which produces an interaction proportional to the inverse fourth power of distance:
| (4) |
The 1/2 in the right-most expression corresponds to the fact that asymptotically, the potential corresponds to a continuum solid, bounded by a plane lying one–half lattice constant outward from the top layer of ions. Here is the coefficient of the atom (molecule)-graphite van der Waals interaction, Å, the interlayer spacing of graphite, and we have used the Euler-MacLaurin summation formula. Theoretical values [61] are meV-Å3 for He (H2). Since is large compared to the atom’s rms fluctuation normal to the surface, Å, Eq. (4) represents a nearly constant shift of the monolayer energy per particle on graphene, compared to that on graphite. From the second term in Eq. (4), these shifts are 21 K (62 K) for He (H2), which are of order one-tenth of the well-depths of these adsorption potentials on graphite [62]. A consequence of this constant shift is that the energy bands of the adsorbed atom or molecule on graphene are negligibly different from those on graphite.
Before discussing the results to date concerning adsorption on graphene, we mention other differences between this substrate and graphite. One involves the importance of the phonon-mediated interaction between two He atoms (H2 molecules). This problem has been explored for atoms on graphite and found to be small [63]. One cannot be certain, however, that the same result would be found on graphene. In particular, the graphene case involves a much more flexible substrate than graphite, suggesting that the so-called “mattress effect” may be important there. In this scenario, two nearby atoms experience an effective attraction since the substrate can deform in a cooperative manner, increasing the dimer’s binding energy. At a formal level, the normal modes of the C atoms of graphene include a branch, the so called flexural phonons, whose dispersion relation at long wave-length for an unstrained sample is proportional to the square of the wave vector and this should change the phonon mediated interaction between adsorbed atoms. While the magnitude of this effect on graphene is unknown it may be sufficient to enhance the cohesion of otherwise marginally bound states, like the 3He liquid. Free-standing graphene is not perfectly flat at a finite temperature but there is a small undulation [64, 65]. However the period of the dominant ripples is of order of 100 Å and we do not expect that this can have a significant effect on the phase behavior of the adsorbed particles.
A second difference between graphene and graphite is relevant to the case of a free-standing graphene layer. In that geometry, gas will adsorb on both the top and bottom sides of the graphene. This means there is an additional attractive interlayer interaction present. The magnitude of the effect was estimated by Bruch , Kim, and Cole [18]. The resulting energy shift is small ( 5% in energy) because of the large separation ( Å) between the “top” and “bottom” films; this result is expected in view of the small difference in Eq.(4) arising from the graphitic layers at similar, and larger, distances.
There exists one intriguing qualitative effect of the 2-sided adsorption problem. Consider atoms which form a commensurate R30o phase on the top side. On the bottom side, then, there exist two alternative possible commensurate structures for the film. In one case, the adatoms occupy the same sublattice of sites as on the top. In the alternative structure, atoms occupy instead a complementary subset of sites. The site degeneracy is three in the former case and six in the latter, so these two possibilities involve phase transitions of different symmetry. Which of the two cases is appropriate for He on graphene is not known and this problem is currently under investigation in our group. In the first case, the Potts model is still appropriate. In the second case a simple extension of Alexander’s argument might suggest but a more thorough study is needed. We note that the nature of the phase transition of the Potts model depends on ; for it is of first order [66].
One of the more interesting problems to explore is the effect of the adlayer on the electrical conductivity and other transport properties in the graphene sheet. Experimental data concerning this property exist thus far only for Kr and He on nanotubes [67]. While there have been many studies of such behavior involving chemisorbed films, there have been few controlled studies of the pressure and temperature dependence for physisorbed films. The latter presents a distinct advantage, insofar as the adatoms provide weak, tunable perturbations of the graphene’s electron gas [20]. This weakness arises from the large equilibrium distance and small charge transfer of the film, implying that the electron-He atom interaction is much smaller than occurs in chemisorption. Some preliminary experimental result on the electric conductivity of graphene as function of adsorption of Ar and He atoms has been reported [68]. This remains one of the interesting domains of future research in this field.
3.2 Calculations for monolayer quantum films on graphene
Since the potential energy on graphene differs from that on graphite only by a ( 10-15%) uniform energy shift, the 2D phase behavior is expected to be essentially the same on these surfaces. Indeed, that expectation has been confirmed thus far in the numerical studies of quantum films on graphene. However, there exist subtle, but qualitative, differences between these computations due to differences in the adsorption potential models and the simulated system size, as well as differences between studies using canonical and grand canonical simulation methods. For example, the use of an anisotropic He-C pair potential (motivated by He scattering experiments) gives rise to a significantly more corrugated potential than results from an isotropic pair potential. This can be quantified by writing the adsorption potential [69] as a 2D Fourier expansion in the surface-parallel plane,
| (5) |
Here and is a 2D reciprocal lattice vector associated with the periodicity of the surface. An 1/3 larger amplitude of , the corrugation potential, with anisotropy included (vs without anisotropy) was inferred [70] from the matrix elements observed [71] in scattering between selectively adsorbed states of atoms which are resonant with the incident beam. Such a large difference in the corrugation yields a significant difference in the energetics of the commensurate phase.
Gordillo, Cazorla and Boronat [72, 73, 48, 74] explored the phase diagrams at of both quantum gases on graphene, finding little qualitative difference from the behavior known to occur on graphite. Their comparisons included that between the R30o phase and a hypothetical liquid phase, conjectured by Greywall and Busch from heat capacity experiments. However, such a comparison suffers from the use of an isotropic He-C pair interaction, which favors the liquid phase, relative to the C phase. One of the findings of their study was the presence of a minute ( 0.7%) supersolid component in the case of commensurate 4He, which is absent from the corresponding state of para-H2. They also report a significant superfluid fraction (up to 14%) in 4He, at , when vacancies are present; the vacancies’ mobility is responsible for the large computed super-component. The finite value of the superfluid fraction for the perfect R30o phase has to be regarded with caution because the quantum simulation method used (diffusion Monte Carlo) suffers from convergence properties [75] as function of the size of the so- called population of random walkers. In addition, the authors also found a finite superfluid fraction for the R30o state of 4He on graphite and this finding is contradicted by experiment [76].
Kwon and Ceperley [77] also explored the 4He phase on graphene at finite with PIMC, with a focus on the effect of varying the adsorption potential. Their results are consistent with those of Gordillo, Cazorla and Boronat, when the isotropic potential is used, but no superfluidity is found at the temperature of the simulation ( K). A very different behavior was found when anisotropy is included. Specifically, they saw no evidence of a superfluid or a supersolid phase in the monolayer on graphene and vacancies in the R30o state are localized. Their results include the analysis of the role of domains, as well as the presence of a high order commensurate phase, with fractional occupation 7/16 of the hexagonal sites. Similar findings are reported by Happacher et al. [78] at temperature 0.5 and 1 K, even with an isotropic He-C pair potential. The latter authors used a particularly large simulation sample and the grand canonical ensemble PIMC, rather than the canonical ensemble used by previous authors.
4 Adsorption potentials on new materials derived from Graphene: Graphane and Fluorographene
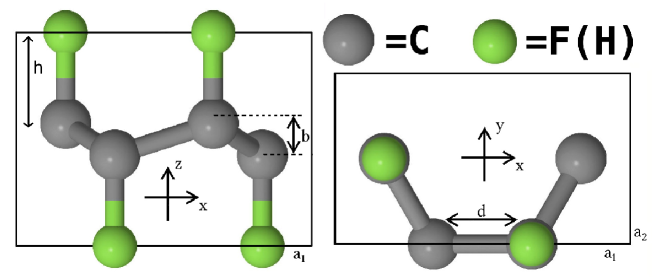
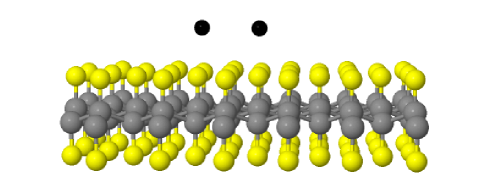
Following the discovery of graphene [79], graphane and graphene–fluoride were considered as new chemical compounds on which respectively hydrogen and fluorine are bound on both sides of the graphene plane. Both have been recently synthesized [13, 15]. Graphane and graphene–fluoride have a similar geometry; half of the F (H) atoms are attached on one side of the graphene sheet to the carbon atoms forming one of the two sublattices of graphene. The other half are attached on the other side to the C atoms forming the other sublattice. The F (H) atoms are located on two planes (see left of Fig. 9); one is an overlayer located at a distance above the pristine graphene plane while the other is an underlayer at a distance below the graphene plane. In addition, as seen in Fig. 8 there is a buckling of the C–plane with the C atoms of one sublattice moving upward by a distance Å while the other sublattice moves downward by the same amount. A He (pH2) atom approaching GF (GH) from above will interact primarily with the F (H) overlayer, but it will interact also with the C atoms and the F (H) atoms of the underlayer.
We have adopted [80] a traditional, semi–empirical model to construct the potential energy of a single He atom (pH2 molecule) at position near a surface [81, 82, 61]. The potential is written , a sum of a Hartree–Fock repulsion derived from effective medium theory, and an attraction, , which is a sum of damped He (pH2) van der Waals (VDW) interactions and the polarization interaction with the surface electric field. The first term is , where is the local density of the electrons of the substrate and the value of is discussed in Reatto et al. [91] and reported in Tab. 2.
The attraction is a sum of contributions; for GF,
| (6) |
The right–most term is the induced dipole energy, where is the static polarizability of the adsorbate and is the electric field due to the substrate. In the case of 4He, this term gives a minor contribution to the adsorption potential and can be safely neglected. Due to the larger value of of H2, that electrostatic contribution is taken into account for H2. The three VDW terms for GF originate from the F overlayer, the graphene sheet and the F underlayer, respectively. These terms are described by the attractive part of a Lennard–Jones potential,
| (7) | |||
| (8) | |||
| (9) |
where the sum is over the Carbon or Fluorine positions; and are the VDW coefficient of He (pH2) with respectively Carbon and Fluorine [83]. The factor is a damping function [84] to avoid the divergence when the adatom comes close to the overlayer. In the case of GH one has to replace F with H in the above formulae.
| Parameter | Value for H2 | Value for He |
|---|---|---|
| 16.38 Å6 | 4.2 Å6 | |
| - | 1.21 Å6 | |
| 9.96 Å6 | 3.45 Å6 | |
| 95.58 Å3 | 53.94 Å3 |
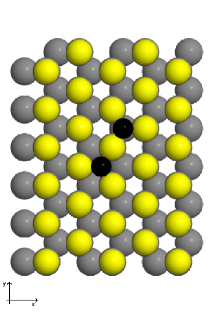
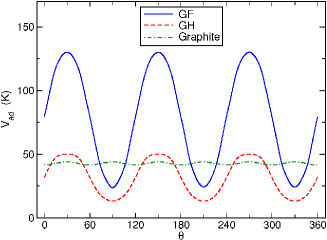
For He atoms, the adsorption sites (see Fig. 10) are above the centers of each triplets of F (H) atoms of the overlayer, forming a honeycomb lattice with the number of sites equal to the number of C atoms, twice as many as those on Gr. Half of the sites are on top of hollow space (see Fig. 9) with no underlying atoms of the substrate and half of the sites are above F (H) of the underlayer but the difference between the well depths for the two kinds of adsorption sites is very small, less than 1%. The well depth for GF is 498 K and for GH it is 195 K (these values do not include the induced dipole energy which gives a contribution below 1% so it has been neglected) whereas it is about 203 K for graphene. The inter–site energy barrier is 24 K for GF and 13 K for GH. Both values are significantly smaller than the barrier height 41K for graphite. The attractive contribution of the F ion is large because of its charge. While a similar contribution would be present on NaF, for example, it would be absent from that on F2 crystal, for example.
As shown in Fig. 10, the energy barrier on graphite does not depend much on the direction in the plane whereas in the case of GF and GH the ratio between maximum and minimum barrier height in the plane is of order of 4–5: the energy landscape of the two last substrates is characterized by a very large corrugation with narrow channels along which low potential barriers are present. Another significant difference is that the distance between two neighboring sites is Å for GF and Å for GH whereas it is Å for graphite and for Gr. Prior to these studies, graphite was believed to be the most attractive surface for He, with a well–depth a factor of 10 greater than that on the least attractive surface (Cs) [62]. The present results indicate that GF replaces graphite, since its well is a factor of 3 more attractive.
The adsorption sites for H2 on GF are the same as for 4He, the difference between the well depths of the two kinds of adsorption sites is of 45 K; the lowest energy adsorption sites are in the hollow positions and the well–depth is 2667 K. For comparison, on graphite the well-depth is 589 K. The inter–site energy barrier on GF is 219 K for the lower minima and 174 K for the other kind; on graphite instead it is 37 K.
5 Adsorption on Graphane and Fluorographene: predictions of novel phenomena for bosonic and fermionic atoms and molecules
The results presented in this section come from “exact” Quantum Monte Carlo simulations. In particular, the results at zero temperature have been obtained with the Path Integral Ground State method [85] and those at finite temperature with the Path Integral Monte Carlo method [86]. Both methods express a quantum expectation value of a bosonic system like a multi–dimensional integral that can be computed exactly with the Metropolis [87] algorithm. A positive attribute of those methods is that they are “exact”, in principle, where “exact” means that the error of the employed approximations can be arbitrarily reduced below the statistical uncertainty of the Monte Carlo methods. Details on the computational methods can be found in Ref. [80].
We have described in the previous section the properties of the adsorption potential between He (H2) and GF (GH). Compared with the adsorption potential of He (H2) on Graphite, remarkable differences arise even at a qualitative level; the symmetry of the adsorption sites is different and the intersite distance is much smaller. In the case of GF the substrate is more attractive than graphite. In addition, the corrugation is stronger and generates channels in which a helium atom is more likely to cross from one adsorption site to another.
5.1 A single atom on GF and GH
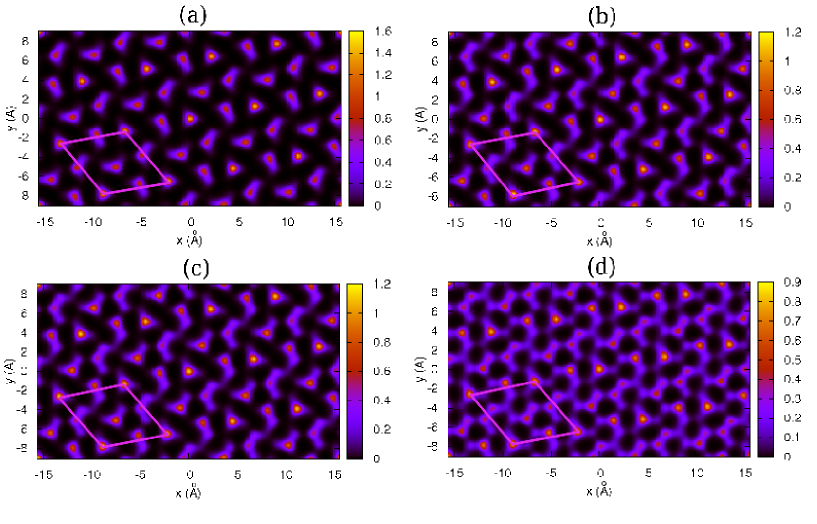
The previously mentioned features of the adsorption potential suggest that a helium atom (or H2 molecule) on GF (GH) is able to tunnel quickly to neighboring adsorption sites and is thus delocalized over the substrate. This is indeed the case, as is shown in Fig. 11, where the square modulus of the wave function of a single Helium atom (H2 molecule) is represented.
The boxes on the left in Fig. 11 compares the two isotopes of Helium on GH; as expected from its larger zero point motion, 3He (c) has a square modulus wave function that is more delocalized than its bosonic counterpart 4He (a). The boxes on the right represents 4He (b) and H2 (d) on GF; the main difference here is that the H2-GF interaction is about five times more attractive than the He-GF one. As a consequence, for H2 the channels that connect two adjacent adsorption sites become narrower and the localization around an adsorption minimum is larger. Another consequence of the larger energy scale of the H2-GF interaction is that the two kinds of adsorption minima are no longer degenerate.
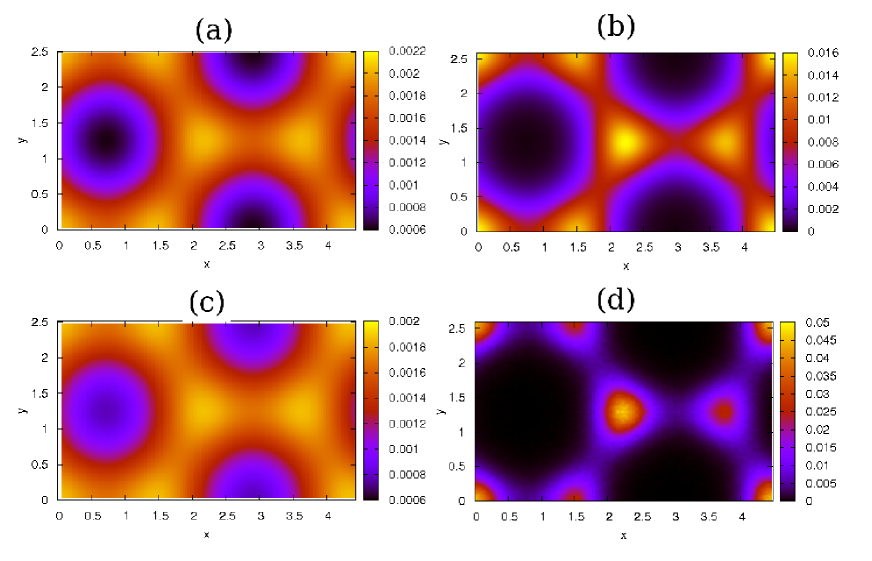
In Fig. 12 we show the lowest energy bands of both He isotopes on GF and GH and H2 on GF; these results have been obtained from the inversion of the Laplace transform [88] of the density-density correlation function in imaginary time, a quantity computed exactly with Path Integral methods. The state of wave vector k of the first energy band, in fact, has a dominant role in the density–density correlation function in imaginary time , , where and is the position of the atom at imaginary time . From the first energy band the effective to bare mass ratio can be computed. This quantity reflects the different corrugation of the adsorption potential and is shown in Table 3.
| Adsorbate | GF | GH | GR |
|---|---|---|---|
| H2 | 2.73 | - | 1.03 |
| 3He | 1.25 | 1.01 | 1.08 |
| 4He | 1.40 | 1.05 | 1.10 |
| Adsorbate | ||
|---|---|---|
| H2 | 1.95 | -0.24 |
| 3He | 5.695(6.434) | 0.33(0.04) |
| 4He | 3.63(4.514) | 0.16(0.021) |
5.2 Monolayer film of 4He and 3He on GF and GH
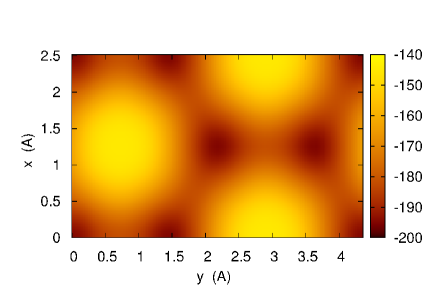
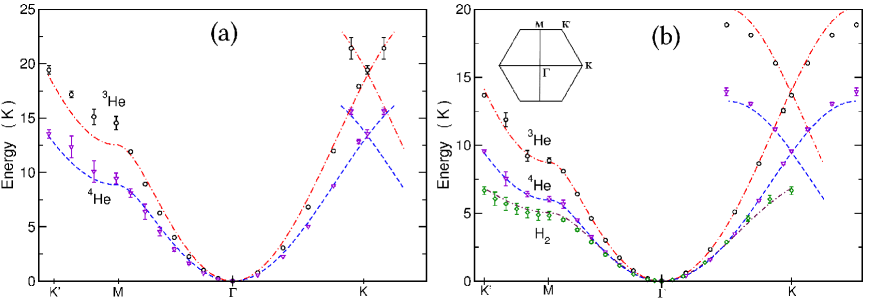
When a monolayer of 4He atoms interacting with an HFDHE2 potential [89] and adsorbed on GF (GH) is considered, the energy per particle has a smooth dependence on density with a minimum at a finite density, the equilibrium density. Therefore the ground state of 4He on GF and GH is a self–bound modulated superfluid of density Å-2 for GF and Å-2 for GH. For comparison, the strictly 2d system [90] of 4He has an equilibrium density of Å-2 which is surprisingly similar. This is different from the case of the monolayer of 4He on Graphite, where the equilibrium density is the R30o solid commensurate phase. A commensurate state similar to that on graphite could be present also on GF(GH) at density Å-2 ( Å-2) at filling factor 1/6 of the adsorption sites (the different values of density are due to different lattice expansions relative to graphite). A scaling analysis [91] of the static structure factor at this coverage as function of the size of the system showed that there is no signature of such a commensurate phase for 4He on GF (GH), i.e. the corresponding Bragg peaks are absent in the static structure factor; this ordered phase is thus unstable on GF (GH). As shown in the equation of state at K in Fig. 13, the equilibrium ground state density is below that of the hypothetical commensurate phase similar to the R30o of graphite. Fig. 14 shows the local density on the – plane for 4He on GH.
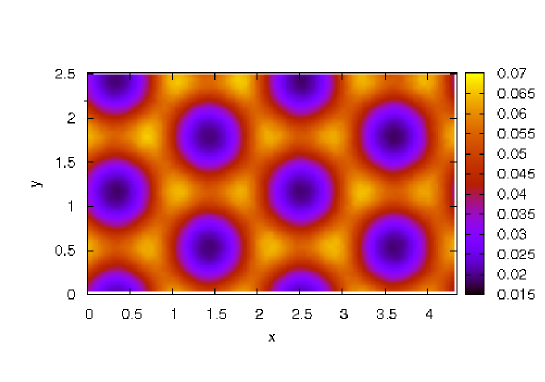
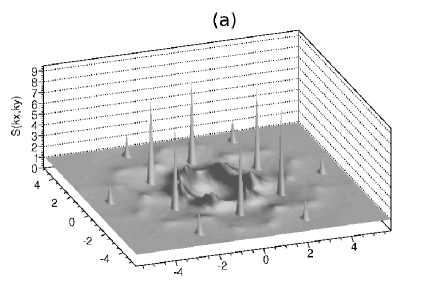
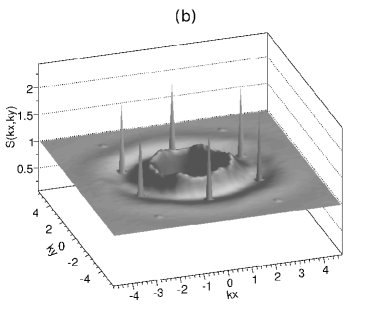
In this figure, clearly visible is the highly modulated local density imposed on the monolayer by the substrate potential. The modulation in density is reflected in Fig. 15, where the static structure factor on the – plane of the reciprocal space has been shown for both GF and GH: we note here the crater–like signal at small wave–vectors that is characteristic of short range order of a fluid phase as well as the presence of sharp peaks at wave vectors that correspond to the expected density modulation induced by the substrate. The static structure factors are consistent with the presence of a liquid phase at equilibrium density, this evidence is confirmed by a scaling analysis of the monolayer that has been presented in Ref. [80], along with the computation of the one–body density matrix and superfluid fraction. The K condensate fraction at equilibrium density is 11.1(1)% for GF and 22.6(13)% for GH. These values are much smaller than the strictly two dimensional case [90], for which ; this is a consequence of the spatial modulation induced by the substrate as well as the smaller effective surface available to the atoms. The K superfluid fraction is 0.60(3) for GF and 0.95(3) for GH. The fact that the superfluid density is not 1 at K was indeed predicted [16, 17] for such kind of adsorption systems as an effect of the corrugation of the external potential. The superfluid fraction has been computed also at finite and we have estimated [80] that the superfluid–normal fluid transition is 0.2-0.3 K for GF and 1.0-1.2 K for GH.
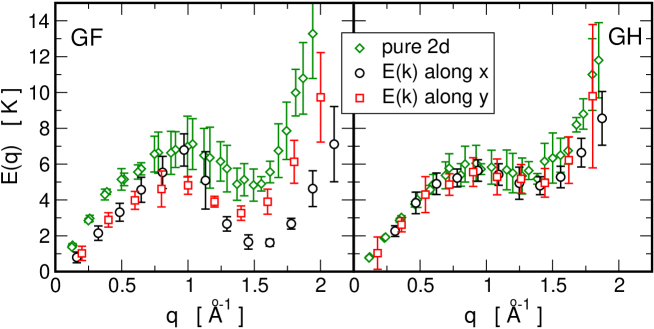
We have also computed [92] the excitation spectrum of the system from the density correlation function for imaginary time and using a powerful inversion method to real frequencies [88]. In Fig. 16 the low–energy excitation spectrum at the equilibrium density is shown for 4He on both GF and GH. The spectrum is of phonon–maxon–roton type, typical of bulk superfluid 4He, but the energy of the roton is anisotropic with respect of the direction of the wave–vector; this novel feature is dramatic in the case of GF. For GH, in contrast, the anisotropy is smaller than the precision of the computation. It is interesting to compare these excitation spectra with that of 4He in mathematical at the same density. The spectrum in has been computed recently [93], and it is shown in Fig. 16 at the densities of the adsorbed film. It can be seen that the spectrum of 4He on GH is very similar to that in . This probably reflects the fact that the 4He local density on GH is modulated by the substrate but it has a sizeable value even at the unfavorable positions on top of the H atoms as can be seen in Fig. 14. The situation is quite different for 4He on GF: obviously the model does not capture the anisotropy of the rotons on GF but also the roton energy of the model is much larger (left panel of Fig. 16). This can be understood by the fact that the local density of 4He on top of the F atoms is essentially zero so that it is as though the 4He atoms are moving in a multiconnected space.
At higher densities of the first monolayer, on both GF and GH a triangular commensurate phase is found to be stable. The phase consists of a triangular lattice rotated by 19.1o with respect to the substrate potential; this lattice is obtained by placing 2 atoms every 7 adsorption sites. In the unit cell (see Fig. 17) one of the 4He atoms is localized on an adsorption site above a triplet of F(H) atoms, other two atoms approach adsorption sites of the other kind and finally the fourth one is centered on a saddle point of the potential.
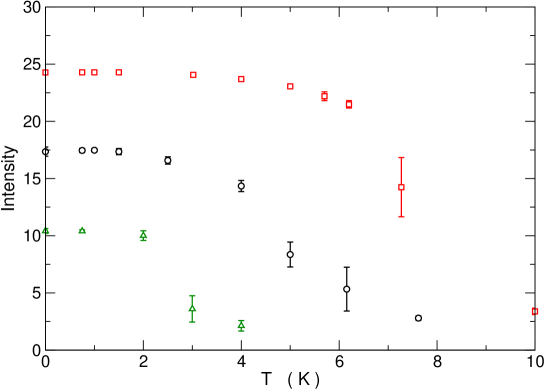
This commensurate phase is analogous to the phase found on the second layer of 4He on Graphite [94]. The local density of the phase for 4He on GF is shown in Fig. 17 for different temperatures ; in this phase, not all atoms are localized around a single adsorption site: some atom visits two or three neighboring sites; as consequence, the atoms are rather mobile and exchange easily, but there is still spatial order; this particularity might give rise to new phenomena and indeed this system is a good candidate for the possibility of supersolidity. Figure 18 shows the average intensity of the Bragg peaks characteristic of the as a function of the temperature . For purpose of comparison the result for 4He an graphite at 1/3 coverage is also shown.
The effect of the temperature introduces particularly large disorder in this commensurate phase of the monolayer. In this context the order is measured by the intensity of the Bragg peaks of the phase, which decreases with increasing temperature until it reaches an intensity comparable with that typical of the short range of the liquid phase. The phase is ordered up to a temperature of roughly 6 K for GF and 7 - 8 K for GH; however, for GH the promotion of some atom to the second layer occurs at a lower temperature, roughly at 6 K, whereas for GF this promotion occurs between 10 - 20 K.
At coverages around 2/7 we found that 4He has an incommensurate triangular order deformed by the substrate potential and defective because such order is not compatible with the periodic boundary contitions imposed at the edges of the simulation box. The static structure factor typical of an incommensurate phase of 4He on GF (GH) (not shown here, see Ref. [80]), has a contribution that comes from a star of six peaks as expected for a triangular solid. The wave vectors of these peaks are close to those expected for an ideal triangular solid at the same density; also the modulus of the peaks increases in a smooth way as the density is increased, following the behavior of a triangular solid. The observed deviation of the wave vectors from the value of an ideal triangular solid arises from the deformation of the lattice and also from the presence of some defects, mainly dislocations, that can be observed from some sampled configurations of the atoms.
Increasing the number of particles in the monolayer, at some point, some atoms begin to be promoted to the second layer. At K this first takes place at a density Å-2 for the GF case and a density Å-2 for the GH case; the higher value for GF reflects the higher binding energy on this surface. Beyond such densities, the occupation of the second layer manifests itself as an increasing secondary peak in the local density along the –direction.
Monolayers of the fermionic 3He at low coverage on GF and GH have been studied [80] with a strategy similar to that adopted in Ref. [56] for 3He in 2d. One starts from Bosons of mass 3 and computes the energy gap between the ground state of the Fermion system and that of the Boson system from a suitable correlation function in imaginary time. For both substrates no commensurate state is found to be stable at low coverage but 3He atoms are found in an anisotropic fluid phase. In the case of GH, no self bound liquid phase is found, i.e. at all finite densities the energy per particle is above the adsorption energy of a single atom. In the case of GF the energy vs has a minimum at a finite density so that the ground state should be a self–bound liquid. However, the minimum is very shallow such that it is within the precision of the computation, so further computations are needed in order to confirm these results. What is firmly established is that 3He on GF and GH gives the possibility of studying a new anisotropic Fermi fluid with tunable density.
The monolayer films of 4He and 3He on GF and GH have thus been proved to exhibit novel physical properties. They are indeed complex systems with rich phase diagrams that are currently under study. In particular, the predicted commensurate phases of 4He are remarkable and very promising candidates for research concerning both superfluidity and Bose-Einstein condensation in solid systems. We have already remarked that our adsorption potential of He on GF and GH is affected by a degree of uncertainty. It is important to notice that the reported results are roboust to details of the adsorption potential. In fact we have verified [80] that the qualitative results do not change when the less certain interaction parameters in Eq. 6 have been modified by up to %.
6 Summary: the future of this field
This review has described a variety of problems involving quantum films on surfaces derived from graphite or graphene. In the case of a graphite surface, most of the monolayer phase behavior is understood semiquantitatively. By the word “understood”, we mean that the phases observed experimentally are, overall, in relatively good agreement with theory or computer simulations. This satisfactory situation represents a significant accomplishment because of the experimental and theoretical complications presented by quantum films weakly interacting with the substrate (compared to heavier, more strongly interacting gases). For example, many traditional surface science probes (STM, LEED, inelastic scattering) are not appropriate for these films because they are either too strongly perturbing or because the film is too weakly interacting. On the theoretical side, the challenge of strong interadsorbate interactions and quantum fluctuations render the analysis particularly challenging, especially for the Fermi system 3He.
The cases of quantum gas adsorption on graphene, fluorographene and graphane have received intense attention recently, from theory and simulations, but relatively little experimental effort. This situation is unfortunate because some remarkable properties have already been predicted for these systems, especially in the 4He case. Most dramatic, perhaps, is the prediction of a highly anisotropic superfluid monolayer with superfluid fraction at and anisotropic roton excitations. Such a film state has never been observed in the laboratory in more than a half-century of study. Another point of interest is the prediction of a commensurate state at 2/7 coverage on GF and GH. In this state only 1/4 of the adsorbed 4He atoms are well localized at adsorption sites, the other atoms do not occupy specific adsorption sites but tunnel among different sites. This appears a possible candidate for a supersolid state.
After completion of this topical review two studies have been published by Boronat, Gordillo and collegues [95, 96]. In the first they have investigated the role of anisotropic pair potential for He on both graphene and a carbon nanotube. In the second they have studied the behavior of H2 on GH at . The main finding is that the ground state is a commensurate solid with order similar to the one, found for H2 and D2 on graphene [72, 74]. Subsequent to this paper’s submission we received a preprint (now published) of a study by Vranješ Markić and collegues [97] concerning helium droplets adsorbed on graphene. That specific topic is not within the domain of the present review. We mention the paper, however, because it provides a detailed discussion of the numerous uncertainties in the adsorption potential, a limitation relevant to all calculations involving adsorption. Only extensive experimental study can help to resolve these uncertainties.
While this review has focused on the monolayer film properties per se, there are numerous fundamental aspects of the broader problem which should stimulate our community to explore this class of systems. One example involves the fact that a physisorbed film represents a controllable, comprehensible, weak perturbation of the electronic properties of the substrate. For graphene (as well as for nanotubes), the latter properties are remarkable, resulting already in one Nobel Prize, so probing with quantum films is potentially invaluable.
Summarizing, this field is blossoming in many directions and we look forward to a coming decade of exciting scientific discovery.
7 Acknowledgements
We would like to acknowledge helpful correspondence with Hiroshi Fukuyama, who kindly provided a figure, and discussions with Tony Novaco and Oscar Vilches.
This work has been supported by Regione Lombardia and CINECA Consortium through a LISA Initiative (Laboratory for Interdisciplinary Advanced Simulation) 2012 grant [http://www.hpc.cineca.it/services/lisa].
References
References
- [1] L. W. Bruch, R. D. Diehl and J. A. Venables, Rev. Mod. Phys. 79, 1381 (2007).
- [2] P. C. Hohenberg, Phys. Rev. 158, 383 (1967).
- [3] V. L. Berezinskii, Zh. Exsp. Teor. Fiz. 59, 907 (1970) [Sov. Phys. JETP 32 493 (1971)]; J. M. Kosterlitz and D. J. Thouless, J. Phys. C: Solid State Phys. 5, L124-126 (1972).
- [4] D.R. Nelson and J.M. Kosterlitz, Phys. Rev. Lett. 39, 1201 (1977); D. R. Nelson, in Fundamental problems in statistical mechanics, ed. E. G. D. Cohen (North Holland, New York, 1980), pp. 53-108.
- [5] D.J. Bishop and J.D. Reppy, Phys. Rev. Lett. 40, 1727 (1978).
- [6] L. W. Bruch, M. W. Cole and E. Zaremba, in Physical Adsorption, Dover Publishing (Mineola, NY, 2007).
- [7] Horst Wiechert, in Adsorption of Molecular Hydrogen Isotopes on Graphite and Boron Nitride; Landolt-Bornstein, in Numerical Data and Functional Relationships in Science and Technology, New Series/Editor in Chief: W. Martienessen: Group III: Condensed Matter, Volume 42, Physics of covered Solid Surfaces, Subvolume A, Adsorbed Layers on Surfaces, Part 3: Surface Segregation and Adsorption Surfaces, Editor: H. P. Bonzel; D. Marx and H. Wiechert, Ordering and Phase Transitions in Adsorbed Monolayers of Diatomic Molecules, Adv. Chem. Phys. Vol XCV, ed. I. Prigogine and S.A. Rice, J. Wiley and Sons, 1996, pp. 213-394.
- [8] J. G. Dash, M. Schick and O. E. Vilches, Surf. Sci. 299/300, 405-414 (1994).
- [9] F. C. Motteler, in Ph.D thesis, U. Washington, (1986) unpublished.
- [10] M. Bretz and T. T. Chung, J. Low Temp. Phys. 17, 479 (1974).
- [11] S. V. Hering, S. W. van Sciver and O. E. Vilches, J. Low Temp. Phys. 25, 789 (1976).
- [12] R. E. Ecke, Q. S. Shu, T. S. Sullivan and O. E. Vilches, Phys. Rev. B 31, 448 (1985).
- [13] R. R. Nair, W. C. Ren, R. Jalil, I. Riaz, V. G.Kravets, L. Britnell, P. Blake, F. Schedin, A. S. Mayorov, S. J. Yuan, M. I. Katsnelson, H. M. Cheng, W. Strupinski, L. G. Bulusheva, A. V. Okotrub, I. V. Grigorieva, A. N. Grigorenko, K. S. Novoselov and A. K. Geim, Small 6, 2877-2884 (2010).
- [14] J. O. Sofo, A. S. Chaudhari and G. D. Barber, Phys. Rev. B 75, 153401 (2007).
- [15] D.C. Elias, R. R. Nair, T. M. Mohiuddin, S. V. Morozov, P. Blake, M. P. Halsall, A. C. Ferrari, D. W. Boukhvalov, M. I. Katsnelson, A. K. Gein and K. S. Novoselov, Science 323, 610 (2009).
- [16] See K. H. Kim and W. F. Saam, Phys. Rev. B 48, 13735 (1993).
- [17] A. J. Leggett, J. Stat. Phys. 93, 927 (1998).
- [18] L. W. Bruch, M. W. Cole and Hye-Young Kim, J. Phys.: Cond. Matt. 22, 304001 (2010).
- [19] The analgous problem for graphite was addressed by F. Ancilotto and F. Toigo, Solid State Comm. 48 593 (1983).
- [20] A. M. DaSilva and M. W. Cole, J. Low Temp. Phys. 163, 122 (2011).
- [21] K. E. Noa, A. D. Lueking and M. W. Cole, J. Low Temp. Phys. 163, 26 (2011).
- [22] R. L. Elgin and D. L. Goodstein, Phys. Rev. A 9, 2657-2675 (1974).
- [23] M. Bretz, J.G.Dash, D.C.Hickernell, E.O.McLean and O.E.Vilches, Phys. Rev. A 8, 1589 (1973).
- [24] D. S. Greywall and P.A. Bush Phys. Rev. Lett. 67, 3535 (1991).
- [25] D. S. Greywall, Phys. Rev. B 47, 309 (1993).
- [26] K. Nho and E. Manousakis, Phys. Rev. B 65, 115409 (2002).
- [27] P . Corboz, M. Boninsegni, L. Pollet and M. Troyer, Phys. Rev. B 78, 245414 (2008).
- [28] M. Boninsegni, J. Low Temp. Phys. 165, 67 (2011).
- [29] R. L. Siddon and M. Schick, Phys. Rev. A 9, 907 and 1753 (1974).
- [30] L. W. Bruch, in Phase transitions in surface films 2, ed. by H. Taub, G. Torzo, H. J. Lauter, and S. C. Fain, Jr., (Plenum, New York, 1991) pp.67-82.
- [31] G. Vidali and M. W. Cole, Phys. Rev. B 22, 4461 (1980); Erratum B 23, 5649 (1981).
- [32] W. E. Carlos and M. W. Cole, Phys. Rev. B 21, 3713 (1980).
- [33] Z. C. Guo and L. W. Bruch, J. Chem. Phys. 77, 1417 (1982).
- [34] M. W. Cole, D. R. Frankl and D. L. Goodstein, Rev. Mod. Phys. 53, 199 (1981).
- [35] G. Boato and P. Cantini, Adv. Electronics and Electron Phys. 60, 95 (1983).
- [36] G.D. Derry, D. Wesner, W.E.Carlos and D. R. Frankl, Surf. Sci. 87, 629 (1979).
- [37] A.D. Crowell and J.S. Brown, Surf. Sci. 123, 296 (1982).
- [38] M. Bretz and J. G. Dash, Phys. Rev. Lett. 27, 647 (1971).
- [39] M. Bretz, Phys. Rev. Lett. 38, 501 (1977).
- [40] S. Nakamura, K. Matsui, T. Matsui, and H. Fukuyama, J. Low Temp. Phys., in press; DOI: 10.1007/s10909-012-0847-5 .
- [41] R. E. Ecke, Q. S. Shu, T. S. Sullivan and O. E. Vilches, Phys. Rev. B 31, 448 (1985).
- [42] S. Alexander, Phys. Lett. 54A, 353 (1975).
- [43] M. J. Tejwani, O. Ferreira, and O.E. Vilches, Phys. Rev. Lett. 44, 152 (1980).
- [44] E. Domany, M. Schick, J. S. Walker and R. B. Griffiths, Phys. Rev. B 18, 2209 (1978).
- [45] M. E. Pierce and E. Manousakis, Phys. Rev. Lett. 83, 5314 (1999).
- [46] M. E. Pierce and E. Manousakis, Phys. Rev. B 62, 5228 (2000).
- [47] K. Nho and E. Manousakis, Phys. Rev. B 67, 195411 (2003).
- [48] M. C. Gordillo, C. Cazorla and J. Boronat, Phys. Rev. B 83, 121406 (2011).
- [49] Value of is obtained from the energy per particle computed in Green’s function Monte Carlo calculations of P. A. Whitlock, G. V. Chester and M. H. Kalos, Phys. Rev. B 38, 2418 (1988). This speed derived from where is the coefficient of the quadratic term in the Taylor expansion of in , the relative density deviation from the equilibrium value .
- [50] S. V. Hering, S. W. van Sciver and O. E. Vilches, J. Low Temp. Phys. 25, 789 (1976).
- [51] P. A. Whitlock, G. V. Chester and M. H. Kalos, Phys. Rev. B 38, 2418 (1988).
- [52] M.C. Gordillo and D.M. Ceperley, Phys. Rev. B 58, 6447 (1998).
- [53] P. A. Whitlock, G. V. Chester and B. Krishnamachari, Phys. Rev. B 58, 8704 (1998).
- [54] M. D. Miller and L. H. Nosanow, J. Low Temp. Phys. 32, 145 (1978).
- [55] V. Grau, J. Boronat and J. Casulleras, Phys. Rev. Lett. 89, 045301 (2002).
- [56] M. Nava, E. Vitali, A. Motta, D.E. Galli, S. Moroni, Phys. Rev. B 85, 184401 (2012).
- [57] D. Sato, K. Naruse, T. Matsui and H. Fukuyama, Phys. Rev. Lett. 109, 235306 (2012).
- [58] See, however, contrary evidence in Phases of 3He Monolayer films adsorbed on grafoil, S. V. Hering and O. E. Vilches, in “Monolayer and Submonolayer Heliuim Films”, Plenum Publishing Corp., J. G. Dauynt and E. Lerner, Editors, New York, pages 1-9, 1973.
- [59] B. Brami, F. Joly and C. Lhuillier, J. Low Temp. Phys. 94, 63 (1994).
- [60] K. Carneiro, L. Passell, W. Thomlinson and H. Taub, Phys. Rev. B 24, 1170 (1981).
- [61] G. Vidali, M. W. Cole and C. Schwartz, Surf. Sci. 87, L273 (1979).
- [62] G. Vidali, G. Ihm, H. Y. Kim and M. W. Cole, Surf. Sci. Rep. 12, 133 (1991).
- [63] K. H. Lau, Sol. State Comm. 28, 757 (1978); J. M. Gottlieb and L. W. Bruch, Phys. Rev. B 48, 3943 (1993).
- [64] J.C. Meyer, A.K. Geim, M.I. Kasnelson, K.S. Novoselov, T.J. Booth and S. Roth, Nature, 446, 60 (2007).
- [65] D.A. Kirilenko, A.T. Dideykin and G. Van Tendeloo,Phys. Rev. B 84, 235417 (2011).
- [66] F.Y. Wu, Rev. Mod. Phys. 54, 235 (1982).
- [67] H. C. Lee, O. E. Vilches, Z. H. Wang, E. Fredrickson, P. Morse, R. Roy, B. Dzyubenko and D.H.Cobden, J. Low Temp. Phys. 169, 338 (2012).
- [68] H.C.Lee, O.E.Vilches,Z.H.Wang,E.Fredrickson, P. Morse, R. Roy, B. Dzyubenko and D.H.Cobden, J. Low Temp. Phys. 169, 338 (2012).
- [69] G. D. Derry, D. Wesner, N. E. Carlos and D. R. Frankl, Surf. Sci. 87, 629 (1979).
- [70] W. E. Carlos and M. W. Cole, Phys. Rev. Lett. 43, 697 (1979).
- [71] G. P. Boato, P. Cantini and R. Tatarek, Phys. Rev. Lett. 40, 887 (1978).
- [72] M. C. Gordillo and J. Boronat, Phys. Rev. B 81, 155435 (2010).
- [73] M. C. Gordillo and J. Boronat, Phys. Rev. Lett. 102, 085303 (2009).
- [74] C. Carbonell-Coronado and M. C. Gordillo, Phys. Rev. B 85, 155427 (2012).
- [75] M. Boninsegni and S. Moroni, Phys. Rev. E 86, 056712 (2012).
- [76] P. A. Crowell and J. D. Reppy, Phys. Rev. B 53 2701 (1996).
- [77] Y. Kwon and D. M. Ceperley, Phys. Rev. B 85, 224501 (2012).
- [78] J. Happacher, P. Corboz, M. Boninsegni and L. Pollet, Phys. Rev. B 87, 094514 (2013).
- [79] A.K. Geim and K.S. Novoselov, Nat. Mat. 6, 183 (2007).
- [80] M. Nava, D. E. Galli, M. W. Cole and L. Reatto, Phys. Rev. B 86, 174509 (2012).
- [81] M. J. Stott and E. Zaremba, Phys. Rev. B 22, 1564 (1980).
- [82] M. W. Cole and F. Toigo, Phys. Rev. B 31, 727 (1985).
- [83] W. Meyer, P.C. Hariharan and W. Kutzelnigg, J. Chem. Phys. 73, 1880 (1980).
- [84] K. T. Tang and J. P. Toennies, J. Chem. Phys. 80, 3726 (1984).
- [85] A. Sarsa, K. E. Schmidt and W. R. Magro, J. Chem. Phys. 113, 1366 (2000).
- [86] D. M. Ceperley, Rev. Mod. Phys. 67, 279(1995).
- [87] N. Metropolis, A. W. Rosenbluth, M. N. Rosenbluth, A. H. Teller and E. Teller, J. Chem. Phys. 21 1087(1953).
- [88] E. Vitali, M. Rossi, L. Reatto and D.E. Galli, Phys. Rev. B 82, 174510 (2010).
- [89] R.A. Aziz, V.P.S. Nain, J.S. Carley, W.L. Taylor and G.T McConville, J. Chem. Phys 70, 4330 (1979).
- [90] P. A. Whitlock, G. V. Chester, and M. H. Kalos, Phys. Rev. B 38, 2418 (1988).
- [91] L. Reatto, M. Nava, D. E. Galli, C. Billman, J. O. Sofo and M. W. Cole, J. Phys.: Conference Series 400, 012010 (2012).
- [92] M. Nava, D.E. Galli, M.W. Cole, L. Reatto, J. Low Temp. Phys., DOI 10.1007/s10909-012-0770-9 (2012).
- [93] F. Arrigoni, E. Vitali, D.E. Galli, L. Reatto, Low Temp. Phys. (in press).
- [94] H. Fukuyama, J. Phys. Soc. Japan 77, 111013 (2008).
- [95] M. C. Gordillo and J. Boronat, J. Low Temp. Phys. 171, 606 (2013).
- [96] C. Carbonell-Coronado, F. de Soto, C. Cazorla, J. Boronat and M. C. Gordillo, J. Low Temp. Phys. 171, 619 (2013).
- [97] L. Vranješ Markić, P. Stipanović, I. Bešlić, R. E. Zillich, Phys. Rev. B (in press).