X-Shooter GTO: evidence for a population of extremely metal-poor, alpha-poor stars††thanks: Based on observations obtained at ESO Paranal Observatory, GTO programme 089.D-0039
Abstract
Context. The extremely metal-poor stars are the direct descendants of the first generation stars. They carry the chemical signature of the pristine Universe at the time they formed, shortly after the Big Bang.
Aims. We aim to derive information about extremely metal-poor stars from their observed spectra.
Methods. Four extremely metal-poor stars were selected from the Sloan Digital Sky Survey (SDSS) and observed during the guaranteed observing time of X-Shooter. The X-Shooter spectra were analysed using an automatic code, MyGIsFOS, which is based on a traditional analysis method. It makes use of a synthetic grid computed from one-dimensional, plane-parallel, hydrostatic model atmospheres.
Results. The low metallicity derived from the SDSS spectra is confirmed here. Two kinds of stars are found. Two stars are confirmed to be extremely metal-poor, with no evidence of any enhancement in carbon. The two other stars are strongly enhanced in carbon. We could not derive iron abundance for one of them, while [Ca/H] is below –4.5. Two of the stars are members of the rare population of extremely metal-poor stars low in alpha elements.
Conclusions.
Key Words.:
Stars: Population II - Stars: abundances - Galaxy: abundances - Galaxy: formation - Galaxy: halo1 Introduction
The extremely metal-poor (EMP) stars with a metallicity Z lower than about the solar metallicity value, are probably among the first low-mass stars that formed in the Universe. They formed from a material enriched in metals (all the elements heavier than He) by the matter ejected by the first generations of massive stars as they exploded as Type II supernovae. They were formed shortly after the Big Bang, at a time when the metal content in the inter-stellar medium was high enough to allow efficient cooling during the phase of star formation, so as to form low-mass stars. The parameters and the chemical composition of these potentially very old EMP stars can give us insight into the condition of the primordial gas from which they formed and into the masses of the Pop. III massive stars. The chemical pattern of these stars, especially the content of carbon, will tell us something about the relative frequency of the channels for star formation from a metal-poor gas in the low-mass regime, i.e. if the cooling of the material occured mainly through C ii and O i (Bromm & Loeb 2003) or through dust (Schneider et al. 2012). In particular, the discovery of SDSS J102915+172927 (Caffau et al. 2011b) supports the notion that, at least to form some stars, the cooling factor must be dust, because C and O abundances in this star are not sufficient to guarantee the cooling. For an introduction on metal-poor stars, see Aoki et al. (2013); Bonifacio et al. (2012); Placco et al. (2011).
We present here a sample of four EMP stars observed during the Italian-guaranteed time observation (GTO) of X-Shooter. The four stars have been selected from SDSS (York et al. 2000; Yanny et al. 2009) to be EMP, and not enhanced in carbon. (For the selection criteria see Bonifacio et al. 2012.) Two of the stars are EMP, not enhanced in carbon, and one of them shows low content in -elements (SDSS J153346+155701) when compared to what is found in the majority of metal-poor stars. The other two stars, SDSS J161956+170539 and SDSS J174259+253135, happen to be carbon-enhanced stars. Both these stars are F-type and hot enough, of 6191 K and 6345 K respectively, to make the G-band not detectable at the resolving power of SDSS, and in SDSS J161956+170539 the molecular band is also hardly visible at the resolution of X-Shooter. The latter star also is low in -elements.
2 Observations and data reduction
The four stars were observed on the 10 July 2012 with the spectrograph X-Shooter (D’Odorico et al. 2006) at Kueyen (VLT UT2) during the Italian GTO. Basic information on the stars are presented in Table 1, while the observation log is presented in Table 2. The observation setup and data reduction method are the same as described in Caffau et al. (2011c). We used the integral field unit (Guinouard et al. 2006) and a on-chip binning along the spectral direction, providing a resolving power R=7 900 in the UVB arm and 12000 in the VIS arm. In this paper we only report the analysis of the UVB and VIS spectra.
| SDSS ID | RA | Dec | l | b | E(B–V) | |||||
|---|---|---|---|---|---|---|---|---|---|---|
| J2000.0 | J2000.0 | deg | deg | [mag] | [mag] | [mag] | [mag] | [mag] | [mag] | |
| SDSS J144256-001542 | 14 42 56.37 | 00 15 42.76 | 351.88263453 | 51.68619352 | ||||||
| SDSS J153346+155701 | 15 33 46.28 | +15 57 01.81 | 24.88837465 | 50.82274117 | ||||||
| SDSS J161956+170539 | 16 19 56.33 | +17 05 39.90 | 32.47870056 | 41.01781927 | ||||||
| SDSS J174259+253135 | 17 42 59.68 | +25 31 35.90 | 49.85799222 | 25.64468718 |
| Star | date | Exp Time (sec) | mode |
|---|---|---|---|
| SDSS J144256-001542 | 2012-07-10 | 1x3690s UVB, 1x3600s VIS, 3x1200s NIR | IFU,Stare; readout: 100k/1pt/hg; binning:1x1 |
| SDSS J153346+155701 | 2012-07-10 | 1x1290s UVB, 1x1200s VIS, 1x1200s NIR | IFU,Stare; readout: 100k/1pt/hg; binning:1x1 |
| SDSS J161956+170539 | 2012-07-10 | 1x3090s UVB, 1x3000s VIS, 5x600s NIR | IFU,Stare; readout: 100k/1pt/hg; binning:1x1 |
| SDSS J174259+253135 | 2012-07-10 | 2x4800s UVB, 2x4710s VIS, 8x1200s NIT | IFU,Stare; readout: 100k/1pt/hg; binning:1x1 |
| SP STD = spectrophotometric standard; Ser BLUE = serendipity blue object; RED STD = reddening standard. | |||
3 Analysis
The analysis was performed with the automatic code MyGIsFOS (Sbordone et al. 2010b, 2013) as in Bonifacio et al. (2012). The main difference is that in this case the grid of synthetic spectra used by MyGIsFOS was computed using version 12.1.1 of turbospectrum (Alvarez & Plez 1998; Plez 2012) and OSMARCS 1D LTE model atmospheres (Gustafsson et al. 2008), computed on purpose for this project. The grid of plane-parallel models covers the range from 5200 K to 6800 K with a step of 200 K in , from 3.5 to 4.5 (c.g.s. units) with a step of 0.5 in , and from to with a step of 0.5 dex in metallicity. Alpha-element abundances, including oxygen, were varied with a step of 0.4 from to . Model structures were computed for a single microturbulence parameter of 1 km/s. Synthetic spectra were computed at a resolution in excess of , for three microturbulent parameters, 0, 1, and 2 km/s. The molecular line lists used for calculating the spectra are those listed in Gustafsson et al. (2008), with the exception of CH from Masseron et al. (in preparation) and CN from Hedrosa et al. (2013), both based on improvements in the lists of Plez described in Hill et al. (2002) and Plez & Cohen (2005). For atomic lines we use data from VALD (Piskunov et al. 1995; Kupka et al. 1999), modified for some of the lines used for the analysis. The complete list of the atomic data of the lines analysed in this work is given in Table 3. Since the stars were selected to have turn-off colours, we fixed the gravity at = 4.0 (c.g.s units) for this analysis, and one single value of microturbulence (1.5) is used (see below). The grid of synthetic spectra we use in the analysis has been interpolated to this value.
| Element | log gf | ||
|---|---|---|---|
| [nm] | [eV] | ||
| Mg i | 382.9355 | 2.709 | |
| Mg i | 383.2299 | 2.712 | |
| Mg i | 383.2304 | 2.712 | |
| Mg i | 516.7321 | 2.709 | |
| Mg i | 517.2684 | 2.712 | |
| Mg i | 518.3604 | 2.717 | |
| Si i | 390.5523 | 1.909 | |
| Ca i | 422.6728 | 0.000 | |
| Ca ii | 849.8023 | 1.692 | |
| Ca ii | 854.2091 | 1.700 | |
| Ca ii | 866.2141 | 1.692 | |
| Fe i | 357.0098 | 0.915 | |
| Fe i | 357.0254 | 2.808 | |
| Fe i | 374.5561 | 0.087 | |
| Fe i | 374.5899 | 0.121 | |
| Fe i | 375.8233 | 0.958 | |
| Fe i | 381.5840 | 1.485 | |
| Fe i | 382.0425 | 0.859 | |
| Fe i | 382.4444 | 0.000 | |
| Fe i | 385.6371 | 0.052 | |
| Fe i | 385.9911 | 0.000 | |
| Fe i | 389.5656 | 0.110 | |
| Fe i | 393.0297 | 0.087 | |
| Fe i | 404.5812 | 1.485 | |
| Fe i | 427.1760 | 1.485 | |
| Fe i | 427.1153 | 2.449 | |
| Fe i | 430.7902 | 1.557 | |
| Fe i | 438.3545 | 1.485 | |
| Fe i | 440.4750 | 1.557 |
As in our previous paper (Caffau et al. 2011c), we derived the effective temperature from the SDSS colour, by means of the calibration presented in Ludwig et al. (2008). The reddening adopted was the one provided by the SDSS data base, which is from the Schlegel et al. (1998) maps. We also derived by fitting the wings of H, with synthetic profiles computed using a modified version of the BALMER code111The original version is available on-line at http://kurucz.harvard.edu/, which uses the theory of Barklem et al. (2000, 2000b) for self-broadening and Stark broadening from Stehlé & Hutcheon (1999). The model atmospheres for the H calculations were computed using version 9 of the ATLAS code (Kurucz 1993, 2005; Sbordone et al. 2004; Sbordone 2005) and = 0.5, as recommended by Fuhrmann et al. (1993) and van’t Veer-Menneret & Megessier (1996).
The fit on the H wings in extremely metal-poor stars is sensitive to the gravity (Sbordone et al. 2010a). A change of dex in gravity for a star at 6350 K would change the temperature by K. For two stars (SDSS J144256-001542 and SDSS J153346+155701), the temperatures derived with the two methods do not agree. SDSS J144256-001542 implies a lower temperature from H wings fit (= 6030 K and 5850 K with = 3.5 and 4.0, respectively, to be compared to = 6161 K from colour). The reddening from the Schlegel maps (Schlegel et al. 1998) is very low (E(B–V)) and could be slightly overestimated. Assuming no reddening, which is consistent with the small equivalent width of the Ca ii-K interstellar component, from photometry (5914 K) is in good agreement with the one derived from the H wings fit. We decided for this star to keep derived from H and = 4.0. Also for SDSS J153346+155701, the from the colour obtained assuming the reddening provided by the Schlegel et al. (1998) maps is 124 K higher than what is implied by the H. In this case the interstellar Ca ii K line is slightly stronger than in SDSS J144256-001542, but still weak. We therefore prefer the temperature derived from the H wings fit (= 6375 K), which is consistent with a reddening that is non-zero, but lower than estimated from the Schlegel et al. (1998) maps (E(B–V) = 0.01 rather than 0.04).
The microturbulence cannot be derived from X-Shooter spectra because weak lines are not detectable at low (R=7 900) resolving power. We attempted to derive a calibration with and , which is relevant for the extremely metal-poor stars, assembling all the stars in the samples of Sbordone et al. (2010a) and Bonifacio et al. (2012) for a total of 45 stars (the different spectra of the same stars in Bonifacio et al. (2012) counting as different stars). For the stars in the present sample, the calibration provides values of the microturbulence between 1.43 and 1.56 . Considering that the r.m.s of the calibration is 0.3 , we decided to adopt 1.5 for all our stars.
All four target stars turned out to be extremely metal-poor, and two of them happened to also be carbon-enhanced (CEMP stars SDSS J161956+170539, SDSS J174259+253135), although the carbon enhancement was not at all apparent in the SDSS spectrum. The resolution of X-Shooter allowed us to detect the C abundance from the G-band, but higher resolution observations are desirable. For SDSS J174259+253135, an observing programme with UVES@VLT is on-going. Both these stars fall in the lower carbon plateau discussed by Spite et al. (2013) in their figure 14.
The results of our analysis are summarised in Tables 4 and 5. The solar abundances are from Lodders et al. (2009) for Mg, Si, and Ca, and from Caffau et al. (2011a) for Fe and C. The table also reports our estimate of [Fe/H] obtained from the SDSS spectra. This is not the estimate provided by the SDSS pipeline (Allende Prieto et al. 2008), but the one obtained by our analysis of the SDSS spectra. This estimate has already been mentioned in our previous papers (Bonifacio et al. 2011; Bonifacio et al. 2012; Caffau et al. 2011c). It has been obtained from our code for automatic analysis Abbo (Bonifacio & Caffau 2003). The effective temperature is determined from the colour, the surface gravity is fixed to =4.0, and microturbulence is set to 1 kms-1. The [Fe/H] and [/Fe] are determined by a fit to ten prominent spectral features, which are measurable at the resolution of SDSS spectra. These include Ca ii K line and infrared triplet, the Ca I 422 nm line, the Mg Ib triplet, the G-band, and several features dominated by Fe i lines. At very low metallicities most features have to be discarded since they are too weak or too noisy, so that the estimate is essentially based on the Ca ii K line, and [/Fe] is undetermined. The grid of synthetic spectra employed assumes [Ca/Fe]=+0.4.
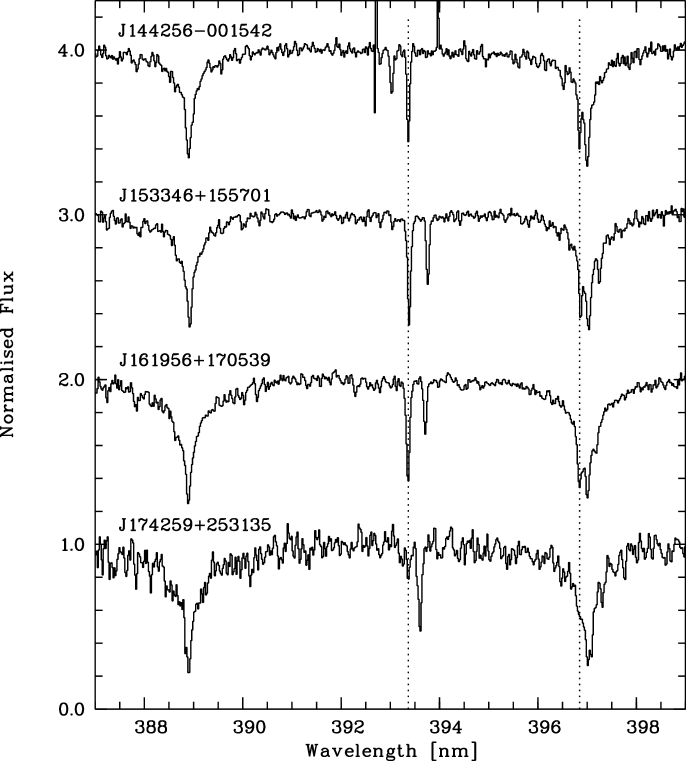
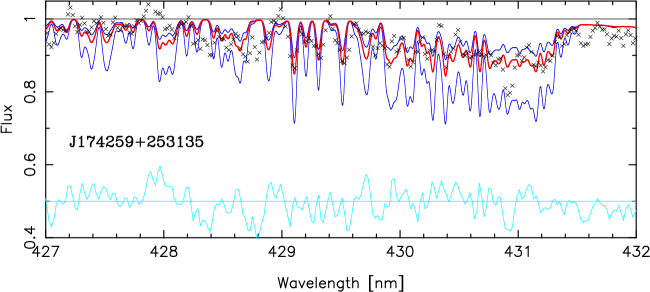
Star SDSS J174259+253135 is the faintest in the sample, and the spectrum shows the lowest S/N. In Fig. 1 the range of the Ca ii-K and -H lines is shown for all four stars, and the low S/N of SDSS J174259+253135 is evident. It is also evident that this star is the most Ca-poor star of the sample. We detect in the X-Shooter spectrum only the G-band (see Fig. 5) and the Ca ii-K line, which is, however, strongly contaminated by interstellar absorption. This is not surprising considering its low Galactic latitude. We derive an upper limit on the Ca abundance of [Ca/H]. From the G-band we deduce that the star is strongly enhanced in carbon (A(C), in Fig. 2 the best fit is shown). To derive an upper limit on the iron abundance in this star, we applied the Cayrel formula (Cayrel 1988) to the two strongest Fe i lines expected in our spectrum: 382.0 nm and 385.9 nm. Applying a criterion, we estimated the Fe abundance needed to produce an equivalent width twice the error provided by the Cayrel formula. This implies [Fe/H].
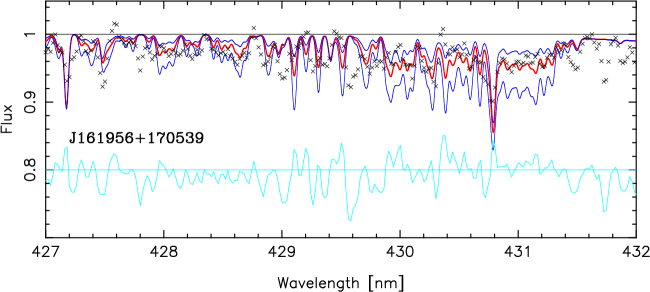
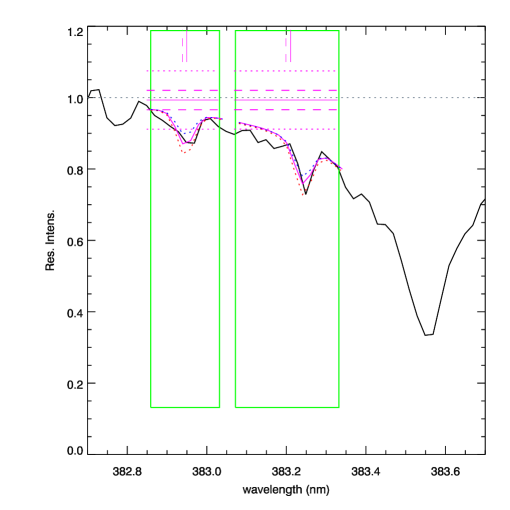
We also analysed the G-band for SDSS J161956+170539 (see Fig. 3), and derived A(C)=7.2. This CEMP star seems peculiar, because it is poor in -elements. Its oxygen abundance cannot be derived. We derived an upper limit of [O/H] from the O i triplet lines at 777 nm that is not significant. Its abundance of Mg is based on four lines, with a low line-to-line scatter (0.11 dex). The [Mg/Fe] we derive is +0.04, and in Fig. 4 the best fit of two Mg i lines is shown. Changes in the stellar parameters do not alter the picture for Mg, maintaining the star poor in Mg. A change in of K alters [Mg/Fe] by dex, and a change in of dex changes [Mg/Fe] by dex. In all these cases the line-to-line scatter increases to 0.22, up to 0.38 dex.
| Star | S/N | [Fe/H]SDSS | [Fe/H] | [/H] | A(C) | |||
| K | [c.g.s.] | @ 400 nm | ||||||
| SDSS J144256-001542 | 5850 | 4.0 | 1.5 | 40 | ||||
| SDSS J153346+155701 | 6375 | 4.0 | 1.5 | 47 | ||||
| SDSS J161956+170539 | 6191 | 4.0 | 1.5 | 46 | 7.2 | |||
| SDSS J174259+253135 | 6345 | 4.0 | 1.5 | 20 | 7.4 | |||
| S/N @ 400 nm is per extracted rebinned pixel, which is of 0.02 nm. | ||||||||
| Star | [Fe/H] | [Mg/H] | N | [Si/H] | N | [Ca i/H] | N | [Ca ii/H] | N | ||||
| SDSS J144256+253135 | 0.18 | 1 | 0.19 | 1 | 0.08 | 2 | |||||||
| SDSS J153346+155701 | 0.13 | 3 | 0.19 | 1 | 0.24 | 3 | |||||||
| SDSS J161956+170539 | 0.11 | 4 | 1 | 0.19 | 0.19 | 1 | 0.23 | 2 | |||||
| The represents the line-to-line scatter when more than one line is measured. It is derived from | |||||||||||||
| Monte Carlo simulations when only one line is measured (see Sbordone et al. 2013) | |||||||||||||
Two stars (SDSS J153346+155701 and SDSS J161956+170539) show a substantial difference in the Ca abundance derived from Ca i and Ca ii lines. This can be explained by the fact that the region of the Ca ii triplet at 850 nm is contaminated by telluric absorption, and the sky subtraction is difficult. The effects of departures from local thermodynamical equilibrium acts in opposite ways on the Ca i and Ca ii lines (Caffau et al. 2012); these effects will be computed in a dedicated paper.
None of the stars shows an identifiable Li feature at 670.7 nm, but the upper limit that we can derive, owing to the resolution of X-Shooter and the S/N ratio of these spectra, is not conclusive. Only SDSS J174259+253135 shows a feature at the wavelength where the Li doublet is expected. The high-resolution UVES spectra will allow us to derive a conclusive answer for Li.
4 Kinematics
The radial velocities measured from our X-Shooter spectra are within 15 of the radial velocities measured by SDSS. This is within the expected combined error of the two measurements and thus does not support the existence of radial velocity variations for any of the stars. All the objects of the present sample have an extreme radial velocity that makes them compatible with a Halo population of stars. For each star we compared the observed radial velocity with a Besançon (Robin et al. 2003) simulation with kinematics of the field in the direction of each star.
The SDSS radial velocity of SDSS J144256-001542 is 225 km/s. The comparison with the Besançon simulation shows that the radial velocity is at the upper extreme of the galactic halo velocity dispersion, i.e. higher than velocity distribution of the stars within 0.1 mag from the stars’ colour and magnitude.
Star SDSS J153346+155701 has a radial velocity of km/s, which makes it an extreme halo star also considering the position in the colour-magnitude diagram of this star. In fact, in the (g-i) colour, this star is 0.3 mag bluer than the bulk of the turn-off population in field. In the corresponding Besançon simulation, there are very few stars to be compared with.
Also, the last two stars J161956+170539 and the CEMP star J174259+253135 are possible members of the halo population. Both radial velocities at km/s for the first and km/s for the second are compatible with the expected velocity distribution in the respective fields of the Besançon simulations.
5 Discussion
This last run of our X-Shooter GTO has confirmed the high reliability with which we can select EMP stars from the SDSS spectra. All four stars are confirmed EMPs from our spectra. It is interesting to note that, up to very recently, the binary system CS 22876-32 (Molaro & Castelli 1990; Norris et al. 2000; González Hernández et al. 2008) has provided the only unevolved stars at [Fe/H] well below –3.5. Our own studies (Caffau et al. 2011b, c, 2012; Bonifacio et al. 2012; Spite et al. 2013) have found five more stars in this metallicity regime, and this paper adds three more stars to the sample.
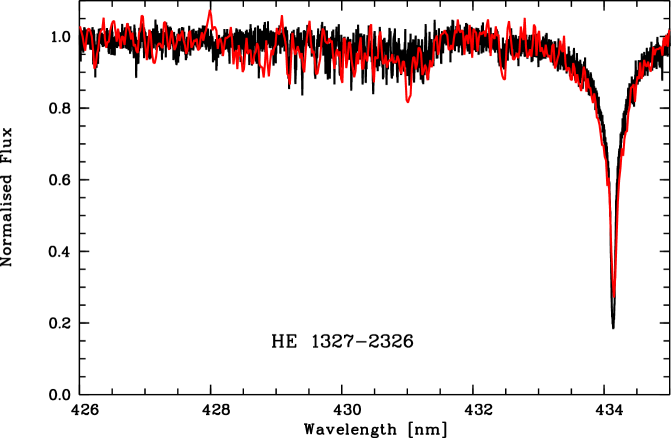
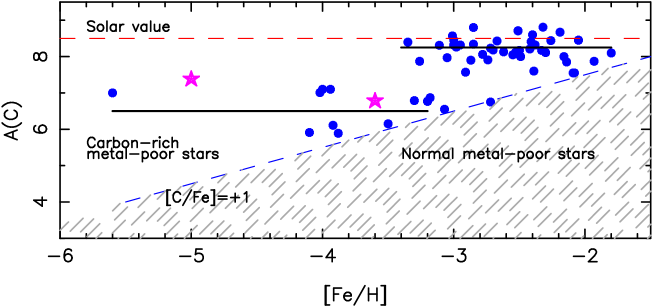
Star SDSS J174259+253135 is clearly the most Fe-poor star of the present sample. Its prominent G-band declares it a CEMP star. A direct comparison of its spectrum with that of HE 1327-2326 ( Frebel et al. 2005, 2008) shows that the G-bands of the two stars are quite similar, as shown in Fig. 5, given that their effective temperatures are the same to within 200 K, the carbon abundances must be roughly the same. It is suggestive that both stars appear on the lower carbon plateau highlighted by Spite et al. (2013) and presented here in Fig. 6. Better understanding of the chemical composition of this star will follow when a high-resolution spectrum is available.
All three other stars appear to be more metal-poor than our estimates from the SDSS spectra. Caffau et al. (2011c) compared the estimates from the SDSS spectra with the ones based on X-Shooter or UVES spectra in their figure 5. The only star in that plot that has a metallicity below , for which the higher resolution spectrum provided an abundance lower than estimated from the SDSS spectrum, was SDSS J102915+172927. Although in Caffau et al. (2011c) it was argued that below this metallicity the estimate derived from SDSS spectra had a large error (about 1 dex), but was unbiased. The present results support the argument in Caffau et al. (2011c) that the metallicity estimate is indeed unbiased and that the SDSS spectra do not systematically underestimate the metallicity for these stars.
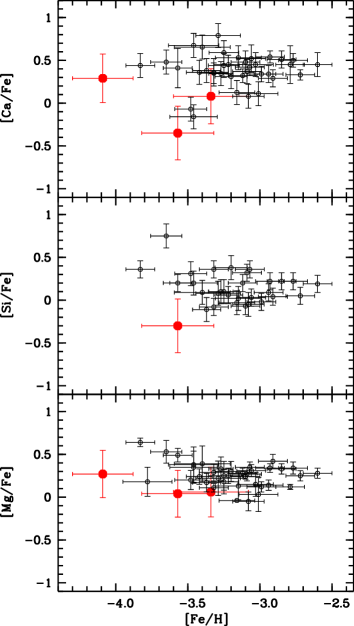
In Fig. 7, we compare -elements versus [Fe/H] from this analysis to the samples of EMP stars from Bonifacio et al. (2009) and (2012). The abundances of Ca are based on Ca i lines. The silicon abundances are based on the only available line for metal-poor TO stars: Si i 390.6 nm (Bonifacio et al. 2009). It is not surprising that it can be measured in one star, but is too weak so has to be discarded in all the other cases. Of the three stars for which we can measure the abundance of Fe and elements, two stars do not present a significant enhancement in the -to-iron ratio. Star SDSS J144256+253135 shows an enhancement in the -elements, Mg and Ca, as expected for EMP stars. In contrast, SDSS J153346+155701 only shows a tiny enhancement in [Mg/Fe] and [Ca/Fe], and SDSS J161956+170539 is depleted in -elements. Such low- stars, in this very low metallicity regime, are becoming evident now that the sizes of the samples increase. A few such stars at slightly higher metallicities are already known: BD+ 80∘ 245 (Carney et al. 1997) with , CS 22873-139 (Spite et al. 2000) with , and SDSS J135046+134651 (Bonifacio et al. 2011) with . Since, the numbers of the analysis of these stars increase, it will be possible to find out whether they constitute a distinct stellar population or if they are somehow peculiar. Such stars have also been found in metal-poor dwarf spheroidal galaxies (see Tafelmeyer et al. 2010; Frebel et al. 2010; Starkenburg et al. 2013; Venn et al. 2012, and for a review see Hill & DART Collaboration 2012).
Nissen & Schuster (2010) in their sample of halo stars highlight two populations, a high- population, showing a constant value of [/Fe] vs. [Fe/H]; and a low- population, with [/Fe] vs. [Fe/H] decreasing with increasing metallicity. They suggest that the high- stars formed from gas enriched by Type II supernovae in a region with a high star formation rate. The low- population should be of stars formed in region where the chemical evolution is slow and the Type I supernovae had time to contribute in iron, inducing the negative trend of [/Fe] increasing metallicity. Our low [/Fe] stars are too metal-poor and too depleted in -elements to be part of this population. The question remains whether these stars and the Nissen& Schuster low- stars are somehow related. If the EMP low- stars are interpreted as the relic of a low star formation region of the Galaxy (or former satellite galaxy), then they could be several Gyr younger than the rest of the halo. A suggestive example of this kind of occurrence is shown by Revaz & Jablonka (2012), who simulate the evolution of a dwarf galaxy of . Their figure 6 shows the [Fe/H] vs. [Mg/Fe] diagram for this simulated galaxy, which displays a rare, but definite, population of low- stars at metallicities centred on –2.0. The galaxy shows a strong starburst at the beginning of its life and a weak secondary starbust about 2 Gyr after. The low- population is formed in this secondary peak, when the Type Ia SNe had time to enrich the gas in Fe, at constant Mg abundance. Our low- stars could have been formed in dwarf galaxies of this kind. In principle, one possibility of forming EMP stars with low oxygen-to-iron ratios is to require an environment dominated by Type II supernovae of relatively low-mass (). The yields of zero-metallicity stars computed by Limongi & Chieffi (2012) for their models of 13 and 15 M☉ imply low [O/Fe] ratios (0.1 – 0.2); however, the corresponding [Mg/Fe] and [Ca/Fe] ratios show no clear dependence on mass and in any case [Ca/Fe] is not seen for any of their models. Thus this occurrence, by itself, cannot explain our observations.
Cayrel et al. (2004) have found a very small scatter in the elements in their sample of extremely metal-poor stars. They conclude that the gas from which the stars formed was well mixed. With these EMP stars with low- to iron ratios, we are induced to conclude that the “well mixed halo” does not hold for our sample. It is possible that we are sampling a more distant population than the giants of Cayrel et al. (2004)222The distances of giant stars are uncertain to the extent that their surface gravities are poorly constrained. The giants in Cayrel et al. (2004) should be 2.5 to 4.5 magnitudes brighter than corresponding TO stars. A typical giant of the Cayrel et al. (2004) sample has V=13.5 and is at comparable distances to TO stars of magnitudes 16 to 18. The uncertainties in the distances of both giants and dwarfs are so large that it is not possible to decide if the two samples are at comparable distances or if one is more distant than the other, but it is also possible that it is the lower mean metallicity of our sample with respect to that of Cayrel et al. (2004) that is the main factor behind this difference.
6 Conclusions
This last X-Shooter GTO run allowed us to discover four new extremely metal-poor stars, some of which display some outstanding characteristics. The CEMP star SDSS J174259+253135 shows no detectable metallic lines other than a weak Ca ii K line, this makes it a good candidate to be one of the most Fe-poor stars known. Star SDSS J161956+170539 shows a peculiar chemical pattern, where the carbon enhancement is accompanied by a low value of measured -elements, making it a unique object. It is remarkable that both these CEMP stars lie on the lower carbon plateau (Spite et al. 2013), helping to confirm its reality. The two carbon-normal stars seem to belong to two distinct populations. SDSS J144256+253135 is a member of the usual -enhanced halo population, while SDSS J153346+155701 belongs to a rare -poor population at extremely low metallicity, possibly the EMP counterpart of the Nissen & Schuster low- population. These findings stress the importance of both increasing the sample sizes and the surveyed volume, reaching for more distant stars.
We may summarise the results of our X-Shooter GTO programme, now finished. This covered 2.5 nights of observations (1.5 nights of Italian and 1 night of French GTO) and 0.75 nights were lost due to bad weather. We could observe twelve stars in the magnitude range 17 to 19, half of which have [Fe/H]. In the sample, SDSS J102915+172927 happens to be the most metal-poor star known to date (Caffau et al. 2011b); SDSS J174259+253135 shows no evident feature except the Ca ii-K line and the G-band; three stars are EMP and low in -elements (SDSS J082511+163459 Caffau et al. 2011c, SDSS J153346+155701, and SDSS J161956+170539); SDSS J135516+001319 is a metal-poor star that is very low in -elements (Bonifacio et al. 2011).
Acknowledgements.
We are grateful to Pascale Jablonka for her useful comments on our manuscript. EC, LS, and HGL acknowledge financial support by the Sonderforschungsbereich SFB881 “The Milky Way System” (subprojects A4 and A5) of the German Research Foundation (DFG). PB, PF, MS, FS, and RC acknowledge support from the Programme National de Cosmologie et Galaxies (PNCG) of the Institut National de Sciences de l’Univers of CNRS. This work has made use of the VALD database, operated at Uppsala University, the Institute of Astronomy RAS in Moscow, and the University of Vienna.References
- Allende Prieto et al. (2008) Allende Prieto, C., Sivarani, T., Beers, T. C., et al. 2008, AJ, 136, 2070
- Alvarez & Plez (1998) Alvarez R., Plez B., 1998, A&A 330, 1109
- Aoki et al. (2013) Aoki, W., Beers, T. C., Lee, Y. S., et al. 2013, AJ, 145, 13
- Barklem et al. (2000b) Barklem, P. S., Piskunov, N., & O’Mara, B. J. 2000b, A&A, 363, 1091
- Barklem et al. (2000) Barklem, P. S., Piskunov, N., & O’Mara, B. J. 2000, A&A, 355, L5
- Bonifacio & Caffau (2003) Bonifacio, P., & Caffau, E. 2003, A&A, 399, 1183
- Bonifacio et al. (2009) Bonifacio, P., et al. 2009, A&A, 501, 519
- Bonifacio et al. (2011) Bonifacio, P., et al. 2011, Astronomische Nachrichten, 332, 251
- Bonifacio et al. (2012) Bonifacio, P., Sbordone, L., Caffau, E., et al. 2012, A&A, 542, A87
- Bromm & Loeb (2003) Bromm, V., & Loeb, A. 2003, Nature, 425, 812
- Caffau et al. (2011a) Caffau, E., Ludwig, H.-G., Steffen, M., Freytag, B., & Bonifacio, P. 2011, Sol. Phys., 268, 255
- Caffau et al. (2011b) Caffau, E., et al. 2011 Nature, 477, 67
- Caffau et al. (2011c) Caffau, E., Bonifacio, P., François, P., et al. 2011c, A&A, 534, A4
- Caffau et al. (2012) Caffau, E., Bonifacio, P., François, P., et al. 2012, A&A 542, A51
- Carney et al. (1997) Carney, B. W. et al. 1997, AJ, 114, 363
- Cayrel (1988) Cayrel, R. 1988, IAU Symp. 132: The Impact of Very High S/N Spectroscopy on Stellar Physics, 132, 345
- Cayrel et al. (2004) Cayrel, R., et al. 2004, A&A, 416, 1117
- D’Odorico et al. (2006) D’Odorico, S., et al. 2006, Proc. SPIE, 6269E, 98
- Frebel et al. (2005) Frebel, A., et al. 2005, Nature, 434, 871
- Frebel et al. (2008) Frebel, A., Collet, R., Eriksson, K., Christlieb, N., & Aoki, W. 2008, ApJ, 684, 588
- Frebel et al. (2010) Frebel, A., Kirby, E. N., & Simon, J. D. 2010, Nature, 464, 72
- Fuhrmann et al. (1993) Fuhrmann, K., Axer, M., & Gehren, T. 1993, A&A, 271, 451
- González Hernández et al. (2008) González Hernández, J. I., et al. 2008, A&A, 480, 233
- Guinouard et al. (2006) Guinouard, I. et al. 2006, Proc. SPIE, 6273E, 116
- Gustafsson et al. (2008) Gustafsson, B., Edvardsson, B., Eriksson, K., Graae-Jørgensen, U., Nordlund, Å., & Plez, B. 2008, A&A 486, 951
- Hedrosa et al. (2013) Hedrosa, R. P., Abia, C., Busso, M., Cristallo, S., Domínguez, I., Palmerini, S., Plez, B., and Straniero, O. 2013, ApJ, 768, L11
- Hill & DART Collaboration (2012) Hill, V., & DART Collaboration 2012, Galactic Archaeology: Near-Field Cosmology and the Formation of the Milky Way, 458, 297
- Hill et al. (2002) , Hill, V., Plez, B., Cayrel, R., et al. 2002, A&A, 387, 560
- Kupka et al. (1999) Kupka, F., Piskunov, N., Ryabchikova, T. A., Stempels, H. C., and Weiss, W. W. 1999, A&AS, 138, 119
- Kurucz (1993) Kurucz, R. 1993, ATLAS9 Stellar Atmosphere Programs and 2 km/s grid. Kurucz CD-ROM No. 13. Cambridge, Mass.: Smithsonian Astrophysical Observatory, 1993., 13
- Kurucz (2005) Kurucz, R. L. 2005, Memorie della Società Astronomica Italiana Supplementi, 8, 14
- Limongi & Chieffi (2012) Limongi, M., & Chieffi, A. 2012, ApJS, 199, 38
- Lodders et al. (2009) Lodders, K., Plame, H., & Gail, H.-P. 2009, Landolt-Börnstein - Group VI Astronomy and Astrophysics Numerical Data and Functional Relationships in Science and Technology Volume 4B: Solar System. Edited by J.E. Trümper, 2009, 4.4., 44
- Ludwig et al. (2008) Ludwig, H.-G., Bonifacio, P., Caffau, E., Behara, N. T., González Hernández, J. I., & Sbordone, L. 2008, Physica Scripta Volume T, 133, 014037
- Molaro & Castelli (1990) Molaro, P., & Castelli, F. 1990, A&A, 228, 426
- Nissen & Schuster (2010) Nissen, P. E., & Schuster, W. J. 2010, A&A, 511, L10
- Norris et al. (2000) Norris, J. E., Beers, T. C., & Ryan, S. G. 2000, ApJ, 540, 456
- Piskunov et al. (1995) Piskunov, N. E., Kupka, F., Ryabchikova, T. A. ,Weiss, W. W., and Jeffery, C. S. 1995, A&AS, 112, 525
- Placco et al. (2011) Placco, V. M., Kennedy, C. R., Beers, T. C., et al. 2011, AJ, 142, 188
- Plez (2012) Plez, B. 2012, Turbospectrum: Code for spectral synthesis, astrophysics Source Code Library
- Plez & Cohen (2005) Plez, B., & Cohen, J.-G. 2005, A&A, 434, 1117
- Revaz & Jablonka (2012) Revaz, Y., & Jablonka, P. 2012, A&A, 538, A82
- Robin et al. (2003) Robin, A. C., Reylé, C., Derrière, S., & Picaud, S. 2003, A&A, 409, 523
- Sbordone (2005) Sbordone, L. 2005, Memorie della Società Astronomica Italiana Supplementi, 8, 61
- Sbordone et al. (2004) Sbordone, L., Bonifacio, P., Castelli, F., & Kurucz, R. L. 2004, Memorie della Società Astronomica Italiana Supplementi, 5, 93
- Sbordone et al. (2010a) Sbordone, L., et al. 2010, A&A, 522, A26
- Sbordone et al. (2010b) Sbordone, L., Bonifacio, P., Caffau, E., & Ludwig, H.-G. 2010, in “Proceedings of the 11th Symposium on Nuclei in the Cosmos. 19-23 July 2010. Heidelberg, Germany.” Proceedings of Science, 294 http://pos.sissa.it/cgi-bin/reader/conf.cgi?confid=100
- Sbordone et al. (2013) Sbordone, L. et al. in preparation
- Schlegel et al. (1998) Schlegel, D. J., Finkbeiner, D. P., & Davis, M. 1998, ApJ, 500, 525
- Schneider et al. (2012) Schneider, R., Omukai, K., Bianchi, S., & Valiante, R. 2012, MNRAS, 419, 1566
- Spite et al. (2000) Spite, M., et al. 2000: A&A 360, 1077
- Spite et al. (2013) Spite, M., Caffau, E., Bonifacio, P., et al. 2013, A&A, 552, A107
- Starkenburg et al. (2013) Starkenburg, E., Hill, V., Tolstoy, E., et al. 2013, A&A, 549, A88
- Stehlé & Hutcheon (1999) Stehlé, C., & Hutcheon, R. 1999, A&AS, 140, 93
- Tafelmeyer et al. (2010) Tafelmeyer, M., Jablonka, P., Hill, V., et al. 2010, A&A, 524, A58
- van’t Veer-Menneret & Megessier (1996) van’t Veer-Menneret, C., & Megessier, C. 1996, A&A, 309, 879
- Venn et al. (2012) Venn, K. A., Shetrone, M. D., Irwin, M. J., et al. 2012, ApJ, 751, 102
- Yanny et al. (2009) Yanny, B., Rockosi, C., Newberg, H. J., et al. 2009, AJ, 137, 4377
- York et al. (2000) York, D. G., et al. 2000, AJ, 120, 1579