Mid-Infrared Atomic Fine-Structure Emission Line Spectra of Luminous Infrared Galaxies: Spitzer/IRS Spectra of the GOALS Sample
Abstract
We present the data and our analysis of mid-infrared atomic fine-structure emission lines detected in Spitzer/IRS high-resolution spectra of 202 local Luminous Infrared Galaxies (LIRGS) observed as part of the Great Observatories All-sky LIRG Survey (GOALS). We readily detect emission lines of [SIV], [NeII], [NeV], [NeIII], [SIII], [OIV], [FeII], [SIII], and [SiII]. More than % of these galaxies are classified as starburst dominated sources in the mid-infrared, based on the [NeV]/[NeII] line flux ratios and equivalent width of the polycyclic aromatic hydrocarbon feature. We compare ratios of the emission line fluxes to those predicted from stellar photo-ionization and shock-ionization models to constrain the physical and chemical properties of the gas in the starburst LIRG nuclei. Comparing the [SIV]/[NeII] and [NeIII]/[NeII] line ratios to the Starburst99-Mappings III models with an instantaneous burst history, the emission line ratios suggest that the nuclear starbursts in our LIRGs have ages of Myr, metallicities of , and ionization parameters of . Based on the [SIII]/[SIII] ratios, the electron density in LIRG nuclei is typically one to a few hundred cm-3, with a median electron density of , for those sources above the low density limit for these lines. We also find that strong shocks are likely present in 10 starburst dominated sources of our sample. A significant fraction of the GOALS sources (80) have resolved neon emission line profiles (FWHM ) and five show clear differences in the velocities of the [NeIII] or [NeV] emission lines, relative to [NeII], of more than . Furthermore, six starburst and five AGN dominated LIRGs show a clear trend of increasing line width with ionization potential, suggesting the possibility of a compact energy source and stratified ISM in their nuclei. We confirm a strong correlation between the sum of the [NeII] and [NeIII] emission, as well as [SIII], with both the infrared luminosity and the m warm dust emission measured from the spectra, consistent with all three lines tracing ongoing star formation. Finally, we find no correlation between the hardness of the radiation field or the emission line width and the ratio of the total infrared to emission (IR8), a measure of the strength of the starburst and the distance of the LIRGs from the star-forming main-sequence. This may be a function of the fact that the infrared luminosity and the mid-infrared fine-structure lines are sensitive to different timescales over the starburst, or that IR8 is more sensitive to the geometry of the region emitting the warm dust than the radiation field producing the HII region emission.
Subject headings:
galaxies: starburst — infrared: galaxies — galaxies: ISM1. Introduction
Luminous infrared galaxies (LIRGs) and ultra luminous infrared galaxies (ULIRGs) are defined to have m infrared luminosities () of and , respectively. The local space density of (U)LIRGs is relatively low, but they play a central role in the understanding of the star formation history and the evolution of black holes in the Universe. The number density of (U)LIRGs increases rapidly between (e.g., Berta et al., 2011). By , LIRGs contribute at least of the total comoving star formation rate density in the Universe (e.g., Seymour, 2009; Magnelli et al., 2013). Despite the importance of high-z LIRGs and ULIRGs as a key source of the cosmic infrared background radiation, it is only recently that local complete samples have become the target of extensive, multi-wavelength studies.
The Great Observatories All-sky LIRG Survey (GOALS 111Visit the GOALS website at http://goals.ipac.caltech.edu; Armus et al., 2009) targets 202 LIRGs in the local Universe drawn from the IRAS Revised Bright Galaxy Sample (RBGS; Sanders et al., 2003), which covers galactic latitudes greater than five degrees and includes 629 extragalactic objects with flux densities greater than 5.24 Jy. The range of the luminosity distances () and the median of the GOALS sample are and Mpc, respectively. The GOALS sample covers the full range of galaxy interaction stages from single isolated disk galaxies, widely separated pairs, to final stage mergers. GOALS is an ideal sample for identifying interesting and rare sources, and most importantly, for creating an accurate picture, through the use of multi-wavelength probes of the gas and dust, of the relationship between star formation and the growth of black holes during periods of intense activity and galactic mergers. Using a number of mid-infrared diagnostics, Petric et al. (2011) estimate the active galactic nuclei (AGN) contribution to the mid-infrared luminosity of the systems as a function of merger stage, infrared luminosity, and spectral shape. A key result of this work is that the vast majority of local LIRGs are dominated by ongoing star formation. While there are indeed a good number of extremely powerful AGN and composite (starburst plus AGN) galaxies in our sample, most of the LIRGs in the local Universe derive the bulk of their power through star formation. In Howell et al. (2010) the relation between the UV and far-infrared emission of the sample is studied and compared to normal galaxies, while Haan et al. (2011) present a thorough analysis of the nuclear structure of the galaxies using high spatial resolution near-infrared and optical images obtained with the Hubble Space Telescope. The low resolution Spitzer mid-infrared spectra of the GOALS sample are ideal for studying the spectral shapes and dust emission and absorption features. They have been presented in a series of papers by Díaz-Santos et al. (2010, 2011) and (Stierwalt et al., 2013, and in prep.), in addition to Petric et al. (2011) as described above. We refer the reader to these papers since we will rely on their findings for the interpretation of our results below. Here, we present the results from the fitting of the atomic, fine-structure emission lines in the Infrared Spectrograph (IRS; Houck et al., 2004) high resolution short-High (SH) and Long-High (LH) for the complete GOALS sample. We present line fluxes, line widths and line centroids, and determine the range of properties of the starburst-dominated LIRGs, and compare these to photo- and shock-ionized models.
One of the most powerful ways to reveal the physical conditions in the gas in and around the dust enshrouded nuclei of LIRGs, is to use the dust-penetrating power of mid-infrared spectroscopy. In particular, the high resolution modules of the IRS on the Spitzer Space Telescope provide access to a suite of fine structure emission lines that can be used to diagnose the central energy source and the physical and chemical conditions of the gas in LIRG nuclei (e.g., the hardness of the radiation field, the gas density, and metallicity). These properties can then be compared to models to estimate the starburst age or velocity of a shock. As a result mid-infrared spectra from the Infrared Space Observatory as well as from the Spitzer Space Telescope have been successfully used to map the ionization field in many types of galaxies (e.g., Thornley et al., 2000; Sturm et al., 2002; Verma et al., 2003; Wu et al., 2006; Dale et al., 2006; Farrah et al., 2007; Groves et al., 2008; Bernard-Salas et al., 2009; Hao et al., 2009; Veilleux et al., 2009).
Several theoretical models are available for studying the radiation field and the interstellar medium of galaxies (e.g., Leitherer et al., 1999; Dopita et al., 2000; Kewley et al., 2001; Snijders et al., 2007; Levesque et al., 2010). While these models have been used to analyze both active (AGN) and starburst galaxies (Sturm et al., 2002; Verma et al., 2003; Bernard-Salas et al., 2009; Tommasin et al., 2010; Pereira-Santaella et al., 2010), complete samples of local LIRGs, of the size of GOALS and with the same abundance of ancillary data, have thus far escaped detailed investigation. In this paper, we attempt to constrain the physical conditions in the starburst galaxies that make up the GOALS sample, via a comparison of the mid-infrared emission line properties to other data, and recent models.
The paper is organized as follows. In Section 2, the details of Spitzer IRS observations and data reduction are presented. In Section 3, the starburst and shock models that we used are described. This is followed by the results in Section 4, where the tables of our measurements for the whole sample are presented, along with a comparison with line ratios predicted by the models and those seen in other samples. Finally, the findings are summarized in Section 5. Throughout this paper, an , , and are assumed.
2. Observations and Data Reduction
The high resolution spectra of the GOALS sources were obtained with Spitzer/IRS. In total, there are 244 and 246 nuclei observed with the SH and LH IRS modules, respectively, within 202 LIRG systems. For LIRGs with multiple nuclei, secondary (fainter) nuclei were observed with the IRS only when their flux density at (as measured from Spitzer MIPS imaging) was equal to or greater than the flux density of the primary (brighter) nucleus. The SH and LH spectra cover a range of and , respectively. The bulk of the IRS observations () were carried out under program 30323 (PI: Armus), with the remainder of the data retrieved from the Spitzer archive. There is a large range in on-source integration times, from to , depending on the brightness of the nuclei.
The data were reduced using the S15, S16, and S18 IRS pipelines at the Spitzer Science Center. The pipeline software removes bad pixels and droop, subtracts the background, corrects for non-linearity, and performs a wavelength and flux calibration. Dedicated backgrounds were subtracted for all data where available, in order to provide the cleanest removal of time varying bad pixels. One dimensional spectra were extracted with the SPICE 222http://irsa.ipac.caltech.edu/data/SPITZER/docs/dataanalysistools/tools/spice/ software package which performs a full slit extraction for the SH and LH data and applies slit loss corrections assuming a point source dominates the flux. This is appropriate since we are interested here in the nuclear starbursts on scales of a few kpc, which drive the bulk of the emission - see below.
All line fluxes were measured by fitting a Gaussian to the IRS emission line profiles. Final line fluxes were derived as a weighted-mean of the line fluxes from each spectral nod position — in standard IRS Staring mode observations the target is placed at two slit positions. When the line was not detected, upper limits were evaluated using a Gaussian with a height three times the local continuum dispersion and a full width at half maximum (FWHM) of (the intrinsic resolution of IRS). In order to estimate the effective measured spectral resolution at each wavelength (including the effects of pointing, undersampling, and spectral extraction), we have made histograms of the measured (Gaussian) line widths for each emission line for the entire sample. This distribution in measured line widths shows a sharp peak for each line, which we take as the effective resolution for that transition. These are 500, 505, and 520 for [NeII], [NeIII], and [NeV] respectively. We use the standard deviations of the distributions in line width, which are 37, 33 and 98 for [NeII], [NeIII], and [NeV] respectively, as measures of the uncertainties in the resolution of each line, and we add these to the fitting errors, in quadrature, for each line in a given galaxy.
3. Models
A primary goal of this paper is to use the complete set of mid-infrared fine structure lines in order to determine the physical properties and the chemical abundances of the gas in the GOALS nuclei. To achieve this, we compare sets of observed line ratios to those predicted by the photoionization models of Levesque et al. (2010) to derive starburst ages, electron densities, gas-phase metallicities, and ionization parameters, as well as the shock models of Allen et al. (2008), to derive shock speeds and magnetic field strengths. The parameter space explored by these models is described in more detail below.
3.1. Photoionization Model
We have used the photoionization model of Levesque et al. (2010) based on the Starburst99-Mappings III code (versions 5.1 and 3q, respectively 333Provided at http://www.emlevesque.com/model-grids/). In this case, the Starburst99 stellar population synthesis code (Leitherer et al., 1999; Vázquez & Leitherer, 2005) is used to generate stellar spectral energy distributions (SEDs), which are used as inputs to the Mappings III photoionization code (Binette et al., 1985; Sutherland & Dopita, 1993; Groves et al., 2004) to predict the resulting nebula emission. We briefly summarize below the parameters assumed with the Levesque models. For more details we refer to Levesque et al. (2010).
Following Levesque et al. (2010), we use a Salpeter initial mass function (IMF; Salpeter, 1955) with an upper mass boundary of , and the stellar atmosphere models of Pauldrach et al. (2001) and the Hillier & Miller (1998). Levesque et al. (2010) then compute models for two different sets of Geneva stellar evolutionary tracks with “Standard” and “High” mass-loss rates. In this paper, we apply only the “Standard” Geneva mass-loss evolutionary tracks, as suggested by Levesque et al. (2010) under consideration for the effect of wind clumping on mass-loss rates (Crowther et al., 2002). The final stellar population spectra are determined for five metallicities (; , , , , and ), and two star formation histories (continuous and instantaneous burst), and sampled every Myr.
For each model age and metallicity, the Mappings III models are used to generate the final nebular emission line spectra, including the mid-infrared lines we examine in this work. An isobaric plane-parallel geometry for the gas is assumed, and two mean electron densities (; and ), together with seven ionization parameters ( 444This is defined as where is the dimensionless ionization parameter.; , , , , , , and ) are modeled. The metallicity of the gas is matched to the stars, assuming the same abundance pattern as detailed in Groves et al. (2004).
This range of metallicities, star formation histories, ages, densities, and ionization parameters should cover the expected parameter space of the star forming regions providing the nebula emission in the GOALS sample. While other variables such as the IMF and differing stellar evolutionary tracks can affect the ionizing SED, and thus the final emission-line spectrum, exploration of these parameters lies beyond the scope of this work.
3.2. Shock-ionization Model
We also used the shock models of Allen et al. (2008) based on the Mappings III shock code (version 3q), to explore the possible presence of shock-ionized gas in the GOALS sources. Note that the models by Allen et al. (2008) do not include any treatment of dust, but this is often taken as a reasonable approximation given that the dust grains can be destroyed by fast shocks. The model parameters are pre-shock densities, abundances, magnetic parameters, and shock velocities. In this investigation, we adopt a shock model with a pre-shock density and solar metallicity, as will be described in the next section.
4. Results
Our Spitzer IRS SH and LH measurements for the entire GOALS sample are presented in Tables 1 and 2, respectively. We readily detect [SIV], [NeII], [NeV], [NeIII], and [SIII], in the SH wavelength range, while between and covered by LH, we identify [SIII], [OIV], [FeII], [SIII], and [SiII]. In general, [NeII] and [SiII] are the strongest emission lines, and they are detected in and of the targets, in the SH and LH spectra, respectively. The [SIII] is most often seen in the LH spectra ( of the galaxies). As we will discuss below, some of the sources exhibit emission lines with asymmetric profiles or relative velocity shifts between lines. A number of hydrogen molecular lines are also detected in the GOALS sources, but they will be the subject of another paper reporting on the properties of the warm molecular gas in LIRGs (Petric et al., Stierwalt et al., in prep.).
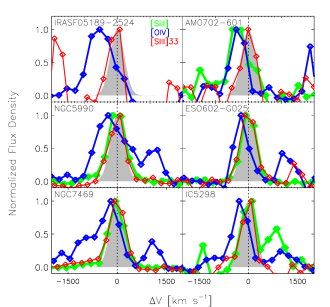
A detailed analysis of various properties of the GOALS sample revealed that of the sources show evidence of a central active galactic nucleus (AGN; see Petric et al., 2011). In this paper, we use the polycyclic aromatic hydrocarbon (PAH) equivalent width (EQW) and the [NeV] emission line flux to classify starburst and AGN dominated sources. While the [NeV] line fluxes are reported in this paper, the EQWs are published in Table 1 of Stierwalt et al. (2013). Purely star-forming or starburst galaxies usually have PAH EQW values in the range of (Brandl et al., 2006). A small PAH EQW is often taken as an indicator of an AGN, since AGN typically have an excess of hot dust which drives down the measured PAH EQW. The emission line at produced by corresponds to an ionization potential of , which is generally too high to be produced by young massive stars. Therefore, its presence in the composite spectrum of a galactic nucleus also can signal the presence of an AGN. Typically, the line flux ratio of the [NeV] to [NeII] is used as a diagnostic of the radiation field, because the ionization potential of is very low () compared with and it is abundantly produced in HII regions. In this paper, for the purposes of classification, sources are considered to be AGN dominated in the mid-infrared if they have PAH EQW or [NeV]/[NeII] . There are 57 GOALS nuclei in this category. Note that this is slightly higher than the number reported in Petric et al. (2011), because we are most interested here in understanding the nature of the dominant starburst population, and have attempted to be a bit more conservative in defining the starburst population among the GOALS sources, and therefore excluding a few more composite sources than Petric et al. (2011). Two sets of representative starburst and AGN dominated spectra are shown in Figure 1.


4.1. Comparisons with Starburst and Continuous Star Formation Models: Densities, Ages, Metallicities, and Ionization Parameters
Ratios of emission lines arising from the same ionized species are strong diagnostics of the interstellar medium (ISM). When these lines originate from different transitions but of the same excitation level, such as [SIII]33.5μm and [SIII]18.7μm, their ratio is a good tracer of the gas density. A total of 183 sources of our sample () have both of these lines detected in LH. The [SIII]33.5μm to [SIII]18.7μm(LH) line flux ratio ranges from to , with mean and median values of 1.66 and 1.61, respectively. There are 112 GOALS nuclei with electron densities, as measured from the [SIII] line flux ratios, more than above the low density limit ( corresponding to an 33.5/18.7 flux ratio of 2.22 at K, Draine, 2010). Of these, 91 are starburst dominated. There are 69 sources that have their [SIII] ratios consistent with gas at the low density limit. The mean and median electron densities found for the GOALS sources with electron densities above the low density limit are and , respectively. If we only consider the starburst galaxies among these, then the mean and median values are and , respectively. There are 2 galaxies with the [SIII] line flux ratios more than above 2.22 (NGC 3221 (catalog ) and NGC 7771 (catalog )_N), implying electron densities below the low density limit. These sources may have significant amounts of line-emitting gas at lower temperatures ( K, see Draine, 2010) or they may have extended [SIII] emission which preferentially raises the [SIII] line flux due to light scattering into the slit at longer wavelengths. Throughout this paper, we employ a model with a density of . This is the closest available value to our estimated electron densities and is sufficiently accurate given the coarse resolution of the models (the next higher density is ) and the slow change in the derived properties with density at these values.
In order to reproduce the widest range of model parameters and avoid degeneracies in the emission line ratios, we have selected the [SIV]/[NeII] and [NeIII]/[NeII] line ratios as the primary diagnostics for this study. Out of the 244 nuclei in our LIRG sample, [NeII], [NeIII], and [SIV] emission lines are detected in 239, 234, and 103 objects, respectively. We note that because the SH and LH slit sizes are different and many LIRGs are resolved in the SH wavelength range, we try to avoid direct comparisons between emission lines detected in different slits. When the emission lines from different apertures are compared, we explicitly note that in the text or the figure captions.
The ionization potentials of the , , and emission lines are , , and , respectively. Even though the [SIV] emission line at falls near the edge of silicate absorption feature, we do not correct the measured line fluxes for extinction in this paper. The range of the optical depth of this absorption feature () for the GOALS sources spans (Stierwalt et al., 2013). The apparent silicate optical depth can be converted to the extinction at the -band as (Roche & Aitken, 1984). Although this does not directly trace the extinction in the gas, if we were to use and the equation (4) in Smith et al. (2007) to correct the [SIV], [NeII], and [NeIII] emission lines for dust extinction, the [SIV]/[NeII] ([NeIII]/[NeII]) ratios would increase (decrease) on the order of only 4% (3%). Therefore, even if the silicate dust absorption seen in the GOALS sources were applied, the relative extinction between the mid-infrared emission lines and its effect on line ratio diagnostics would be very small.
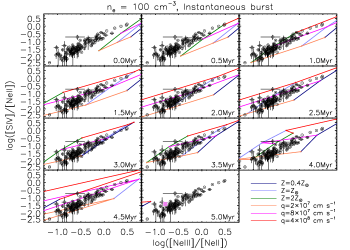
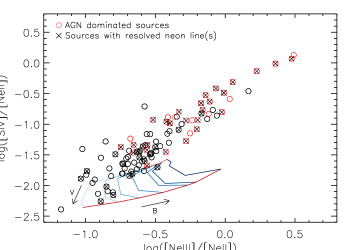
In Figure 2, we present the [SIV]/[NeII] vs. [NeIII]/[NeII] as a function of age for an instantaneous starburst for the entire GOALS sample. The vertical lines and the horizontal lines denote metallicities and ionization parameters, respectively. The median values of and are and , respectively.
We have selected the [SIV]/[NeII] and [NeIII]/[NeII] line ratios as primary diagnostics. We can see from the model grids that both [SIV]/[NeII] and [NeIII]/[NeII] are sensitive to metallicity and ionization parameter, but this combination of the line ratios let us avoid degeneracies and maximizes the number of the sources in a diagram for better statistical analysis. However, if we use [SIV]/[SIII]18.7μm(SH) instead of [SIV]/[NeII], the model grids would move toward higher ionization (upward in Figure 2).
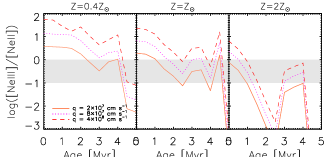
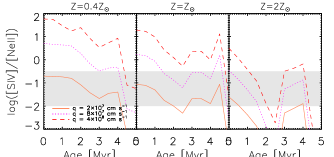
With the assumption of the instantaneous star formation history, the Pauldrach/Hillier & Miller atmospheres, the standard Geneva stellar evolution track, and the Salpeter IMF (see also § 3.1), the majority of the GOALS sources have line flux ratios in agreement with the starburst models with ages between Myr. Note that we are showing all the GOALS data in this figure, including those sources that are thought to harbour AGN which dominate their mid-infrared emission. These AGN sources are explicitly labeled in Figure 3, and they populate the tail of the distribution of sources towards the upper right, but do not change our estimate of the typical starburst age because they run parallel to the age lines here. In this age range there is a dramatic evolution indicated by the line flux ratios; massive stars are disappearing while Wolf-Rayet (W-R) stars start to dominate the spectra (Levesque et al., 2010). This evolutionary path can be seen in Figure 4, where the ratios of [NeIII]/[NeII] and [SIV]/[NeII] against the age are shown. The regions filled with the gray color correspond to the ranges of line ratios of only the starburst GOALS sources. In all of the metallicity ranges, the line ratios decrease from to Myr due to the death of O/B-type stars. After this phase, the line ratios rise rapidly because of the emergence of the W-R stars. The implied ionization parameters range from for the entire sample, but only for the starburst dominated sources (see Figure 3).
The metallicities of the sources are constrained to be (Figure 2) showing that LIRGs are usually metal-rich systems. For 22 GOALS systems, whose metallicities were measure by Rupke et al. (2008) via optical spectra, we find a general agreement on the derived oxygen abundances when the Tremonti et al. (2004) calibration is used. These results are also in agreement with recent studies of the metallicity gradients of LIRGs showing overall metal rich systems using the Kewley & Dopita (2002) calibration, which differs from the Tremonti et al. (2004) calibration by dex (Rupke et al., 2010; Rich et al., 2012).
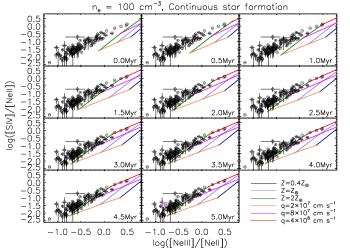
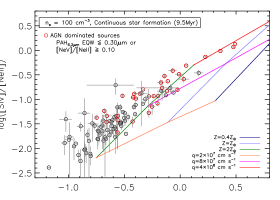
In the top panels of Figure 5, we present the same data as in Figure 2, but here we compare the GOALS data to a model of continuous star formation. Most of the sources have [NeIII]/[NeII] ratios which are too low to be reproduced by the continuous star formation model, unless we invoke metallicities greater than and ages above Myr. Even then the continuous star formation models can only fit a small fraction of the sample. This is not surprising given the fact that many of the LIRGs are major mergers, which are modeled to have strong starburst peaks at closest passage and final coalescence. For reference, in the bottom panel of Figure 5 we also show the same plot at the age of Myr (the oldest age allowed by the model). This is long after the ionizing spectrum has reached a steady state so that line ratios have become fully stabilized. For the remainder of this paper we only consider the instantaneous starburst models when comparing to the IRS data.
The relatively narrow range in starburst ages ( Myr) we find for the sample is expected, since young stars dominate the ionization of the gas producing the emission lines visible in the IRS data. However, to place these ages into context, here we compare them to other age estimates from the literature for LIRGs and ULIRGs.
Based on measurements of the EQW of the H absorption feature in high resolution optical spectra in a sample of 25 nearby ULIRGs, Soto & Martin (2010) find central starbursts surrounded by intermediate age stellar populations indicating a rapid decrease in the star formation rate Myr ago on radial scales of kpc. At the median distance of our sample ( Mpc), our IRS spectra cover the central kpc of the GOALS sources. While the H absorption EQW is most sensitive to A-type stars which have longer lifetimes (a few Gyr), our emission line diagnostics are most sensitive to young stars (O/B-type stars). The stellar age estimated by Soto & Martin (2010) traces the time since the most recent episode of star formation, but the age that we estimate from the mid-infrared emission lines probes the age of the most recent major starburst. In addition, differences in ages could be caused by differential extinction between the youngest and oldest stars in these dusty nuclei, since some fraction of the young starburst probed with our IRS data might be undetected in the visual.
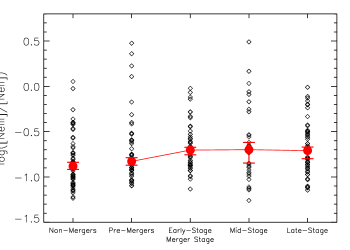
Since many of our LIRGs have experienced an interaction or merger, we have compared our starburst ages to the dynamical timescales estimated from imaging (Haan et al., 2011) and -body simulations (Lotz et al., 2008). From a detailed study of the HST NICMOS imaging of GOALS sources with , Haan et al. (2011) estimate a median time until merger of Myr, with peaks at Myr (corresponding to first pass) and Myr (final coalescence). Similarly, merger simulations (e.g., Lotz et al., 2008) suggest timescales of a few Gyr for a major merger, with star formation being enhanced at first passage and final merger (Mihos & Hernquist, 1994; Hopkins et al., 2008). Although late-stage mergers tend to have higher infrared luminosities (e.g., Veilleux et al., 2002; Petric et al., 2011), we find no trend of the fine-structure line ratios as a function of merger stages. As an example, in Figure 6 we show the [NeIII]/[NeII] line ratio as a function of merger stage. The merger stages are from Table 2 of Haan et al. (2011) and Table 1 of Stierwalt et al. (2013). This is likely due to the fact that these ratios are always dominated by the youngest, most massive stars, and hence they do not accurately probe intermediate age populations formed earlier in the merger.
Super star clusters, which are often produced in great numbers during a merger, can trace star formation over a longer time baseline, provided extinction effects can be estimated (Whitmore & Schweizer, 1995; Chien et al., 2007). For example, in the GOALS source NGC 2623 (catalog ), star clusters are seen with ages consistent with Myr (Evans et al., 2008). In another luminous merger, II Zw 096 (catalog ) (CGCG 448-020 (catalog )), there are two populations of clusters with ages of Myr and Myr (Inami et al., 2010). Young and old cluster populations are also found in NGC 7469 (catalog ) (Díaz-Santos et al., 2007). The younger star clusters ( Myr) in II Zw 096 (catalog ) are assumed to have been generated at the most recent merger event. While the dynamical age of II Zw 096 (catalog ) is around 2 Gyr, it does host extremely young star clusters. Therefore, while we are not sensitive with our mid-infrared ionized gas lines to earlier bursts, the ages we are estimating are consistent with at least some populations of extra-nuclear clusters in merging galaxies, suggesting that we are probing the latest generation of stars in these systems.
4.1.1 The Myr Starburst Models
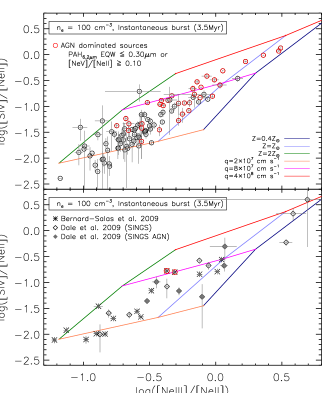
In order to explore the detailed distribution of sources shown in Figure 2, we expand the Myr photoionization model grids in Figure 3. For completeness in presenting the entire distribution of GOALS sources, galaxies for which an AGN may have a significant contribution to the mid-infrared line flux (those with PAH EQW or [NeV]/[NeII] ) are included in this figure, but explicitly marked on the plot. While many of these sources may still have their bolometric power dominated by star formation (see Petric et al., 2011), there mid-infrared spectra are likely to have a significant contribution from an AGN. Since the primary goal of this paper is to explore the properties of the starbursts in LIRGs via their mid-infrared fine-structure lines, we will exclude these AGN-like sources from our analysis, even though we include them in many plots after marking them where appropriate. Most of the starburst sources lie in the bottom left corner of the diagram with median values of and of and , respectively. They typically have ionization parameters between and metallicities between .
There are five highly ionized starburst sources in the top right of Figure 3 ( and ). These sources, along with their infrared luminosities in parenthesis, are: IRAS 03582+6012 (catalog )_W (), IRAS 05129+5128 (catalog ) (), NGC 6052 (catalog ) (), CGCG 448-020 (catalog )_W 555The nucleus of CGCG 448-020 we refer to is at J2000 (RA, Dec) (20:57:23.939, 17:07:36.098). The other nucleus (CGCG 448-020_E) at (20:57:24.229, 17:07:40.110) in this system also has high [SIV]/[NeII] and [NeIII]/[NeII] ratios. However, although this nucleus seems to be dominated by an extreme starburst (Inami et al., 2010), its PAH EQW is , which is slightly smaller than our starburst threshold. (), and ESO 148-IG002 (catalog ) (). The high ionization can be caused by young stellar population or metal poor gas. We found that the oxygen abundance of one of these galaxies, NGC 6052 (catalog ), has been measured by Rupke et al. (2008) to be or , assuming the calibration of Tremonti et al. (2004). This is consistent with the median value of their LIRG sample. While we do not have accurate metallicities for all the sources with high excitation, it seems unlikely that metallicity drives this effect in LIRGs. The PAH EQWs of these sources are large (), with the exception of ESO 148-IG002 (catalog ), which is on the boundary of our AGN classification with a PAH EQW of . Its X-ray (Iwasawa et al., 2011) and optical (Rich et al. 2013) spectra indicate that the southern nucleus is dominated by AGN. The corresponding [OIV]/[NeII] ratios of IRAS 03582+6012 (catalog )_W, IRAS 05129+5128 (catalog ), NGC 6052 (catalog ), and ESO 148-IG002 (catalog ) are , , , and (CGCG 448-020 (catalog )_W does not have a [OIV] detection). Note that, while these highly ionized starburst LIRGs exist, their measured [NeIII]/[NeII], [SIV]/[NeII], and [OIV]/[NeII] line flux ratios are still significantly lower than the mean values found for the sources we believe to harbor a mid-infrared dominant AGN.
4.1.2 Comparisons with Other Starburst Samples
A comparison of our sample with local starburst and star-forming galaxies from Bernard-Salas et al. (2009) and Dale et al. (2009) is presented at the bottom panel of Figure 3. The 24 targets in Bernard-Salas et al. (2009) consist of 22 starburst galaxies and two galaxies with evidence of AGN ( or PAH EQW from Brandl et al., 2006). Since we require a detection in the [SIV], [NeII], and [NeIII] lines, only 15 of the Bernard-Salas sources appear in the panel 666In total there are 16 sources which have all of [SIV], [NeII], and [NeIII] detections. However, the one that we excluded here, NGC 4945, has a [SIV]/[NeII] ratio of and lies outside the plotted y-axis range. For reference, its [NeIII]/[NeII] ratio is .. Seven of these sources (NGC 1365 (catalog ), NGC 1614 (catalog ), NGC 2146 (catalog ), NGC 2623 (catalog ), NGC 3256 (catalog ), NGC 4194 (catalog ), and NGC5256_S (catalog )) are also in the GOALS sample, and the comparison of the measured line fluxes agrees in nearly all cases to within . These objects have an infrared luminosity between with a median of . Also, a subset of 15 out the 67 objects of Dale et al. (2009) appear in our figure due to a lack of large numbers of [SIV] detections among the SINGS sources (Spitzer Infrared Nearby Galaxies Survey) sources. The SINGS galaxies cover a range of Hubble types and infrared luminosities from to (Kennicutt et al., 2003). Although primarily star-forming and earl-type galaxies, the SINGS sample also includes some sources with (weak) AGN – these are marked in the figure to avoid confusion.
There are 13 starbursts from Bernard-Salas et al. (2009) and six SINGS star-forming galaxies that overlap with the location of the GOALS LIRGs in Figure 3. A few SINGS galaxies with no AGN signature display extremely high ionization, reaching . Their corresponding ratios are also high. Two of these, NGC 1705 (catalog ) and NGC 2915 (catalog ), are classified as blue compact dwarfs 777Four starburst galaxies with even more extreme mid-infrared line ratios have been identified among a lower IR luminosity local blue compact dwarf sample by Hao et al. (2009).. The oxygen abundances () of IC 4710 (catalog ), NGC 1705 (catalog ), and NGC 2915 (catalog ) were found to be , , and respectively (Moustakas et al., 2010). These values are lower than the average LIRG metallicity (see Figure 2 in Rupke et al., 2008). Because the [NeIII]/[NeII] ratios depend on the metallicities, these three sources and the sources which harbor weak AGN (diagnosed by optical spectra; Moustakas et al., 2010) are excluded from a following comparison with the GOALS starburst LIRGs. The rest of the SINGS objects have similar [SIV]/[NeII] and [NeIII]/[NeII] ratios to the GOALS starbursts, covering a range of and .
Since the detection of the high-ionization, weak [SIV] emission line greatly limits the comparison of the GOALS sources to the the bulk of the Bernard-Salas et al. (2009) and Dale et al. (2009) sources, we can focus on examining the distribution of the [NeIII]/[NeII] line flux ratios among the three datasets. The GOALS starburst sources are highly concentrated in the range of , similar to the starburst galaxies of Bernard-Salas et al. (2009). The SINGS galaxies show a wider distribution while covering the same general range in [NeIII]/[NeII]. The two-sample Kolmogorov-Smirnov (K-S) statistical tests between the GOALS starburst sample and Bernard-Salas et al. (2009) and Dale et al. (2009) yields -values of and , respectively, suggesting that the [NeIII]/[NeII] ratios of the GOALS starburst sample and the starburst sample of Bernard-Salas et al. (2009) are consistent with being drawn from the same parent distribution, with a K-S test confidence level of . Surprisingly, although the SINGS sources have more quiescent star formation than the GOALS sources, their median [NeIII]/[NeII] value is higher (0.22 for SINGS vs. 0.14 for GOALS). The range of the oxygen abundances of the SINGS star-forming nuclei with both [NeIII] and [NeII] detections is (Moustakas et al., 2010) with the median of , while it is with the median of for the GOALS starbursts (Rupke et al., 2008), both calibrated with Pilyugin & Thuan (2005). Therefore the slightly higher [NeIII]/[NeII] flux ratios seen in the SINGS nuclei are not caused by an overall lower metallicity compared with the GOALS starbursts. The difference may however, be related to the smaller projected area of the IRS nuclear data for the SINGS galaxies, which may provide less contamination from surrounding, lower excitation gas. The median projected area of the SINGS and GOALS galaxies are and , respectively.
It is well known that the [NeIII]/[NeII] line ratio reflects the hardness of the radiation field. Thus it allows us to examine the upper mass cutoff of the initial mass function (IMF) at a given metallicity, star formation history, and starburst age (Thornley et al., 2000). Our GOALS starburst dominated sources have [NeIII]/[NeII] ratios in the range of , which limits the upper mass cutoff to . This range extends toward lower masses than what was found by Thornley et al. (2000, ) in their starburst sample.
4.2. Comparison with Shock Models: Existence of Shocks and Shock Speeds
In addition to photoionization, shocks can also excite gas in LIRGs (Monreal-Ibero et al., 2010; Rich et al., 2011). In the following sections, we compare the IRS line flux ratios to those predicted to arise from shocked gas, as well as discuss the location of LIRGs with resolved or shifted emission lines with respect to the model grids.
4.2.1 Shock Ionization
In Figure 7, we overlay the shock model grids of Allen et al. (2008), with shock speeds of and magnetic field strengths of , on the [SIV]/[NeII] vs. [NeIII]/[NeII] emission line diagnostic diagram. The model is consistent with the lines ratios of 10 starburst LIRGs. They are at the low-end of the [SIV]/[NeII] and [NeIII]/[NeII] ratios seen in the GOALS sample. While these galaxies are consistent with shock ionization, very young starbursts with ages around Myr (with an ionization parameter of ; see Figure 2) can also reproduce these line ratios.
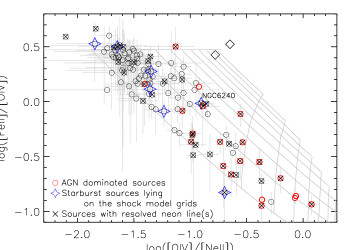
Due to strong depletion of Fe onto grains in the ISM (Savage & Sembach, 1996), the [FeII]/[OIV] together with the [OIV]/[NeII] line flux ratios can be used to distinguish sources with strong shocks (which can destroy grains and release Fe into the gas phase) from starbursts and AGN (e.g., Lutz et al., 2003; Sturm et al., 2006). We plot the [FeII]/[OIV] vs. [OIV]/[NeII] line flux ratios of the GOALS sources in Figure 8. Shock dominated sources (e.g., supernovae, SNe) typically have both strong [FeII] and strong [OIV] emission, as indicated by the positions of IC 443 and RCW 103 from Oliva et al. (1999a, b), and are clearly offset from the location of starbursts (with weak [OIV] emission) and AGN (with very strong [OIV] emission). As expected, most of the AGN dominated LIRGs are found at the lower right of Figure 8, while the starburst dominated LIRGs mostly populate the upper left corner. However, there are LIRGs with elevated [FeII]/[OIV] line flux ratios (for their [OIV]/[NeII] line flux ratios) which depart from the locus connecting the starburst dominated and AGN dominated LIRGs, towards the SNe. Only one of these source, NGC 6240 (catalog ), which is known to exhibit strong shock gas emission due to the interaction of two counter-rotationg disks (Armus et al., 2006, and references therein), falls on the shock model ionization grids discussed earlier (Figure 7). The fact that the majority of the LIRGs consistent with the Allen et al. (2008) shock models do not show enhanced [FeII] emission may suggest that these LIRGs are indeed dominated by very young starbursts. Similarly, the sources with excess [FeII] emission may have some contribution from shocks to their line ratios at the level (see the mixing lines in the figure proposed by Lutz et al., 2003).
4.2.2 Gas Kinematics
Despite the limited spectral resolution of IRS data for determining gas kinematics, in some ULIRGs and AGN, IRS spectra have been successfully used to study outflows and gas motion around black holes (Spoon et al., 2009; Spoon & Holt, 2009; Dasyra et al., 2011). Here we compare the widths and velocity offsets between the [NeII], [NeIII], and [NeV] emission lines to detect large-scale motions of the ionized gas, and associate these with the ionization state of the gas.
We find that five sources show velocity shifts greater or equal to in the [NeIII] or [NeV] emission lines relative to the [NeII] emission line. All five sources are detected in [NeV], indicating the presence of an AGN and only one (ESO 602-G025 (catalog ); and PAH EQW ) is not classified as an AGN dominated source. In these galaxies at least, the highly ionized gas is kinematically distinct from the bulk of the emission, perhaps being located closer to the ionizing source and participating in an outflow (or infall). A total of 80 sources have at least one resolved neon emission line with a FWHM corresponding to an intrinsic line width of . These sources cover a wide range in the emission line flux ratios. Approximately (48) of the sources with resolved neon lines are starbursts, with the remaining 31 being AGN-dominated. All of the sources with large neon line velocity shifts also have FWHM . The profiles of these emission lines and a table with the measured FWHM are given in the Appendix. In addition, there are 10 objects in our sample exhibiting [OIV] emission lines shifted in velocity with respect to [NeII] by more than . There are 98 GOALS sources with resolved [OIV] emission lines, and 69 of these are starburst-dominated.
The sources with resolved Ne emission lines are indicated in Figure 7. Among the 10 sources lying on the shock model grids, five of them have resolved neon emission lines, including NGC 6240 (catalog ). One of these sources, IRAS 13120-5453 (catalog ), also shows evidence of outflows in the optical data: an asymmetric profile in its H emission and broad, blue-shifted wings in its Na D absorption profile (Rich et al. 2013, in preparation). The rest of the LIRGs with resolved emission are either starbursts or AGN. On average, the AGN have broader emission lines than the starburst dominated LIRGs. The median FWHMs of [NeIII] for starburst and AGN dominated sources are and , respectively.
Correspondence between the line widths and ionization may also be able to shed light on the distribution of the ionized gas. In its simplest form, the emission line nebula around a compact energy source may show a correlation of ionization potential and line width, reflecting the energetic input of the source into the gas. More ionized species, which arise closer to the energy source, may display broader lines. In the case of AGN, line widths, luminosities, and black hole masses are also found to be correlated (Dasyra et al., 2011). There are 11 GOALS sources (six starbursts and five AGN) that show a clear correlation of line width and ionization potential. All show increasing line width for the higher ionization lines. The plots of line width vs. ionization potential are shown in Figure 9. An additional eight LIRGs (six starbursts and two AGN) may also show the same trends, but with less than four detected lines in each source, we consider these as marginal correlations.


4.3. Line Fluxes as Star Formation Indicators
Since the [NeII] and [NeIII] lines typically have the strongest emission in the region, and their emitted fluxes are correlated with (Ho & Keto, 2007), they can be used to estimate star formation rates in starburst galaxies. The [NeII] and [NeIII] luminosity as a function of (Taken from Table 1 of Armus et al., 2009) for the GOALS sample is presented in the top panel of Figure 10. In this plot, for completeness, we include the sources whose mid-infrared spectra appear to be dominated by AGN, and mark them in red. The correlation between and for the GOALS sources is consistent with that seen by Ho & Keto (2007), although some objects are offset from the best fit line. These outliers are mostly at the low- and high-luminosity end. Excluding the AGN dominated sources, the best fit line for the GOALS sample has a slope of and an intercept of . Both slope and intercept are consistent with the least-squares regression of Ho & Keto (2007) over five orders of magnitude in the infrared luminosity ().
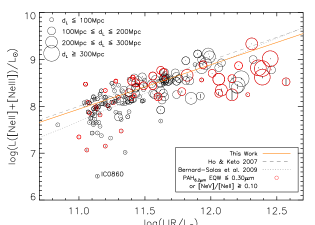
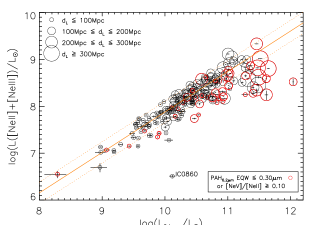
In the bottom panel of Figure 10, we show the correlation of the luminosity to the m luminosity (calculated from the LH spectra using the MIPS m response curve). The m luminosity traces the warm dust emission and can also be used to derive the star formation rate in star-forming galaxies (Calzetti et al., 2007). Compared with , the correlation between the neon line and m luminosity is significantly tighter. The slope and the intercept of the starburst dominated sources alone are and , respectively. None of the sources at the low-luminosity end exhibits a large scatter, except IC 0860 (catalog ) (IRAS F13126+2453 (catalog )), which lies far below the regression line at . At the high-luminosity end, the AGN clearly fall below the correlation, most likely due to an excess of warm dust emission, which is heated by the active nucleus.
A tighter correlation between and the synthetic , compared to and , can be attributed to two factors. First, warm dust emission detected in is more directly related to massive stars which heat the dust. Replacing the with therefore lowers the scatter in the correlation. Second, the closest objects ( Mpc), which are mostly at the low-luminosity end, fall below the correlation line in the upper panel of Figure 10. Varying amounts of the total [NeII] and [NeIII] emission may therefore be missed in the narrow IRS slit. Using provides a closer match of the neon and warm dust emission, substantially improving the correlation (the bottom panel in Figure 10) for the nearest LIRGs.
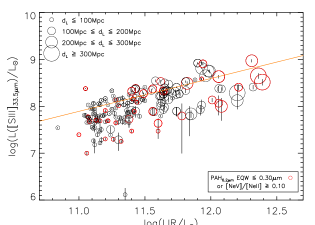
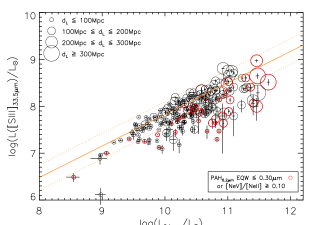
In addition to the [NeII] and [NeIII] lines, the [SIII] and [SiII] lines can also be extremely strong in the GOALS spectra. Furthermore, since both lines are in the IRS LH spectra, they can be directly compared to the m flux with no potential aperture effects. The ionization potentials of and are and , respectively. Although the [SiII] emission line is generally stronger than [SIII]33.5μm, the use of [SiII] for calibrating star formation rates is problematic, because it may have a contribution from older stars due to its low ionization potential. Of course, this is also true for the far-infrared emission in general, but much less so in LIRGs and ULIRGs which tend to have much warmer emission associated with the starburst. In Figure 11, the [SIII]33.5μm luminosity is compared with (upper panel) and the synthetic m luminosities (lower panel). The AGN are again offset below the correlation for the starburst LIRGs. As with the Ne lines, a tighter correlation is found for starbursts than when is used. For the starburst dominated sources alone, the best fit lines are and , for the comparisons with the infrared luminosities and the synthetic m luminosities, respectively. The [SIII]33.5μm emission line can also be used as a star formation rate indicator. Although the correlation of vs. is not as tight as that of vs. , its scatter is as small as that of the correlation in Ho & Keto (2007) between and over five orders of magnitude in .
4.4. IR8 vs. Ionization and Linewidth
Recent studies have revealed that the ratio of total infrared luminosity () to rest-frame luminosity (), IR8, can be used to distinguish between “main sequence” normal star-forming galaxies, and those undergoing a “starburst”, characterized by high specific star formation rates (Daddi et al., 2010; Genzel et al., 2010; Elbaz et al., 2011). High values of IR8 have also been associated with compact starbursts (Elbaz et al., 2011). With our large sample of powerful starbursts in GOALS, we can examine possible correlations of IR8 with other starburst properties.
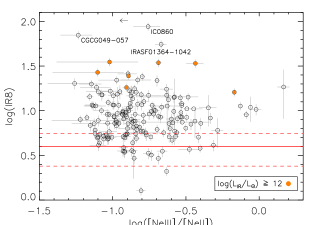
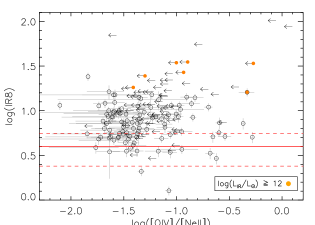
In Figure 12, we compare IR8 to the [NeIII]/[NeII] and [OIV]/[NeII] ratios. We note that all sources that appear to be AGN dominated as classified at the beginning of Seciton 4 are excluded in these figures to minimize AGN contamination in particular for the [OIV] line. The total infrared luminosities are taken from Armus et al. (2009) and the luminosities are measured using the Spitzer IRAC images. Most GOALS sources lie well above the “main sequence” of star-forming galaxies (which has an average IR8 of , Elbaz et al., 2011), consistent with them having compact, powerful starbursts. Although some of the sources with high [OIV]/[NeII] limits also have large IR8 values, among the LIRGs with solid detections, there is no correlation of either [NeIII]/[NeII] or [OIV]/[NeII] with IR8. Therefore, the LIRGs with the highest specific star formation rates (sSFR) and the most compact starbursts do not have a harder radiation field. This lack of correlation may be due to the different timescales probed by the IR8 ratio and high ionization mid-infrared lines as traced by the [NeIII]/[NeII] or [OIV]/[NeII] ratios. The far-infrared flux, includes dust heated by stellar populations with ages older than 10 Myr. The [NeIII] and [OIV] lines, however, trace the youngest stars, and as such they are not sensitive to stellar populations older than about Myr. As a consequence, changes in the line ratios can occur on much shorter timescales than changes in IR8, if the starburst has been going for 10 Myr or more. Alternatively, the lack of correlation may simply reflect the fact that IR8 is more sensitive to the geometry of the region emitting the (warm) dust, than the hardness of the radiation field as measured in the HII regions themselves.
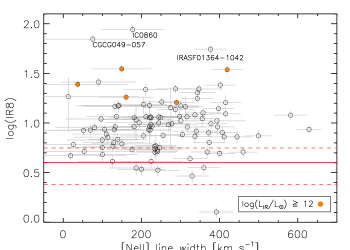
Since we might expect the most compact, powerful starbursts to also be the ones having the most turbulent ISM, we plot IR8 vs. the measured line widths in Figure 13. As with the mid-infrared line flux ratios, we see no clear trend of line width and IR8 among the GOALS sources. The LIRGs with the broadest lines do not appear farther from the star-forming main sequence of galaxies. Even though the IRS data are only sensitive to relatively high gas velocities, the LIRGs with the largest IR8 seem to exhibit nearly the full range in intrinsic line widths of the sample. Therefore, the compact starbursts seen in many LIRGs are not significantly increasing the average ionized atomic gas motions – at least not on the few hundred scales that can be probed with the high resolution IRS spectra.
5. Summary
We use the Starburst99 and the Mappings III models to diagnose the physical properties and chemical abundances of the local LIRGs in the GOALS sample. Comparing mid-infrared diagrams of emission line ratios with the photoionization starburst and shock-induced models, we find that
-
1.
Using the [SIV]/[NeII] and [NeIII]/[NeII] line flux ratios, we estimate starburst ages of , and metallicities of , which are comparable with various optical metallicity measurements, showing that LIRGs are metal rich (e.g., Rupke et al., 2008). The electron densities of the GOALS starbusts range from one to a few hundred cm-3, as measured from the [SIII] emission lines. For the 91 starburst-dominated sources significantly above the low density limit of the [SIII] emission lines, we estimate mean and median electron densities of and , respectively. Although the GOALS sources have a large dispersion in ionization parameter, most of the starburst sources are consistent with ionization parameters of . Most of the LIRGs with appear to be AGN dominated (they have very small PAH EQW or strong [NeV] line emission relative to [NeII]). However, there are five GOALS LIRGs which are very high ionization starbursts. These sources could be slightly younger than the average LIRG. We find no significant correlation of the fine structure line ratios with merger stage throughout the sample.
-
2.
We have used the [SIV]/[NeII], [NeIII]/[NeII], [FeII]/[OIV], and [OIV]/[NeII] line flux ratios as well as their measured line profiles and line centroids to isolate LIRGs that might be experiencing large scale shocks. We find that overall the number of shocked starburst LIRGs is small (10), and that the individual diagnostics often do not agree. There appear to be five starburst LIRGs (including NGC 6240 (catalog )) that show evidence in at least one of these diagnostics for shock excitation and fast gas motions. An additional five may have experienced shocks as indicated by their intense [FeII] emission, but they are now mostly ionized by young stars.
-
3.
Resolved neon lines with FWHM (or corrected for the intrinsic velocity dispersion) are seen in of the sample (80 objects). About of these (48 galaxies) are starburst dominated LIRGs. The [NeIII] linewidths of the AGN dominated sources are slightly greater, on average, than those of the starbursts. At least 11 and as many as 19 LIRGs show a positive correlation of line width and ionization parameter, consistent with compact energy sources and possibly a stratified ISM. Five GOALS sources show [NeIII] or [NeV] lines that are shifted by more than relative to [NeII], indicative of rapidly moving highly-ionized gas which may be closer to the ionizing source and participating in an outflow (or infall).
-
4.
The [NeII]+[NeIII] luminosities of the starburst dominated sources show a correlation with . Although its dispersion is consistent with Ho & Keto (2007), who found that this relation holds for over five magnitudes in infrared luminosity, the correlation becomes significantly tighter when the neon emission line luminosities are compared with the synthetic luminosities measured in the LH spectra. The luminosities of the emission line, which has a similar ionization potential to and typically has a strong line flux like [NeII] and [NeIII], also correlate with and . Thus can be used as a star formation rate indicator as well.
-
5.
We do not find a correlation between (IR8, the ratio of total infrared luminosity to rest-frame luminosity) and the [NeIII]/[NeII] or [OIV]/[NeII] ratios. This implies that while IR8 may be tracing the compactness of dusty star formation (Elbaz et al., 2011) and the geometry of the warm dust emission in the starburst, it is not sensitive to the hardness of the ionizing radiation field, as probed by the mid-infrared atomic fine-structure emission line ratios. The more compact star-forming regions in starbursts are expected to also have the more turbulent ISM, which can be probed by line profiles. However, IR8 does not correlate with the [NeII] line width either. The LIRGs with the largest IR8 seem to cover nearly the full range in line widths in the GOALS starburst sample.
The mid-infrared fine-structure features detected with Spitzer IRS high resolution spectroscopy, as presented here, provide an insight to the basic physical properties of starburst and AGN dominated LIRGs in the local Universe. In conjunction with the forthcoming results of [CII], [OI], and [OIII] with the Herschel Space Observatory, these results will lead to a more detailed understanding of the ionized and neutral gas in local LIRGs. Furthermore, the same techniques shown in this paper can be applied using the higher resolution and more sensitive instruments of the James Webb Space Telescope (JWST) and the Space Infrared Telescope for Cosmology and Astrophysics (SPICA) in the near future for understanding both low- and high-z galaxies.
References
- Allen et al. (2008) Allen, M. G., Groves, B. A., Dopita, M. A., Sutherland, R. S., & Kewley, L. J. 2008, ApJS, 178, 20
- Armus et al. (2006) Armus, L., et al. 2006, ApJ, 640, 204
- Armus et al. (2009) —. 2009, PASP, 121, 559
- Bernard-Salas et al. (2009) Bernard-Salas, J., et al. 2009, ApJS, 184, 230
- Berta et al. (2011) Berta, S., et al. 2011, A&A, 532, A49
- Binette et al. (1985) Binette, L., Dopita, M. A., & Tuohy, I. R. 1985, ApJ, 297, 476
- Brandl et al. (2006) Brandl, B. R., et al. 2006, ApJ, 653, 1129
- Calzetti et al. (2007) Calzetti, D., et al. 2007, ApJ, 666, 870
- Chien et al. (2007) Chien, L.-H., Barnes, J. E., Kewley, L. J., & Chambers, K. C. 2007, ApJ, 660, L105
- Crowther et al. (2002) Crowther, P. A., Dessart, L., Hillier, D. J., Abbott, J. B., & Fullerton, A. W. 2002, A&A, 392, 653
- Daddi et al. (2010) Daddi, E., et al. 2010, ApJ, 714, L118
- Dale et al. (2006) Dale, D. A., et al. 2006, ApJ, 646, 161
- Dale et al. (2009) —. 2009, ApJ, 693, 1821
- Dasyra et al. (2011) Dasyra, K. M., Ho, L. C., Netzer, H., Combes, F., Trakhtenbrot, B., Sturm, E., Armus, L., & Elbaz, D. 2011, ApJ, 740, 94
- Díaz-Santos et al. (2007) Díaz-Santos, T., Alonso-Herrero, A., Colina, L., Ryder, S. D., & Knapen, J. H. 2007, ApJ, 661, 149
- Díaz-Santos et al. (2010) Díaz-Santos, T., et al. 2010, ApJ, 723, 993
- Díaz-Santos et al. (2011) —. 2011, ApJ, 741, 32
- Dopita et al. (2000) Dopita, M. A., Kewley, L. J., Heisler, C. A., & Sutherland, R. S. 2000, ApJ, 542, 224
- Draine (2010) Draine, B. T. 2010, Physics of the Interstellar and Intergalactic Medium (Princeton University Press)
- Elbaz et al. (2011) Elbaz, D., et al. 2011, A&A, 533, A119
- Evans et al. (2008) Evans, A. S., et al. 2008, ApJ, 675, L69
- Farrah et al. (2007) Farrah, D., et al. 2007, ApJ, 667, 149
- Genzel et al. (2010) Genzel, R., et al. 2010, MNRAS, 407, 2091
- Groves et al. (2008) Groves, B., Nefs, B., & Brandl, B. 2008, MNRAS, 391, L113
- Groves et al. (2004) Groves, B. A., Dopita, M. A., & Sutherland, R. S. 2004, ApJS, 153, 9
- Haan et al. (2011) Haan, S., et al. 2011, AJ, 141, 100
- Hao et al. (2009) Hao, L., Wu, Y., Charmandaris, V., Spoon, H. W. W., Bernard-Salas, J., Devost, D., Lebouteiller, V., & Houck, J. R. 2009, ApJ, 704, 1159
- Hillier & Miller (1998) Hillier, D. J., & Miller, D. L. 1998, ApJ, 496, 407
- Ho & Keto (2007) Ho, L. C., & Keto, E. 2007, ApJ, 658, 314
- Hopkins et al. (2008) Hopkins, P. F., Hernquist, L., Cox, T. J., & Kereš, D. 2008, ApJS, 175, 356
- Houck et al. (2004) Houck, J. R., et al. 2004, ApJS, 154, 18
- Howell et al. (2010) Howell, J. H., et al. 2010, ApJ, 715, 572
- Inami et al. (2010) Inami, H., et al. 2010, AJ, 140, 63
- Iwasawa et al. (2011) Iwasawa, K., et al. 2011, A&A, 529, A106
- Kennicutt et al. (2003) Kennicutt, Jr., R. C., et al. 2003, PASP, 115, 928
- Kewley & Dopita (2002) Kewley, L. J., & Dopita, M. A. 2002, ApJS, 142, 35
- Kewley et al. (2001) Kewley, L. J., Dopita, M. A., Sutherland, R. S., Heisler, C. A., & Trevena, J. 2001, ApJ, 556, 121
- Leitherer et al. (1999) Leitherer, C., et al. 1999, ApJS, 123, 3
- Levesque et al. (2010) Levesque, E. M., Kewley, L. J., & Larson, K. L. 2010, AJ, 139, 712
- Lotz et al. (2008) Lotz, J. M., Jonsson, P., Cox, T. J., & Primack, J. R. 2008, MNRAS, 391, 1137
- Lutz et al. (2003) Lutz, D., Sturm, E., Genzel, R., Spoon, H. W. W., Moorwood, A. F. M., Netzer, H., & Sternberg, A. 2003, A&A, 409, 867
- Magnelli et al. (2013) Magnelli, B., et al. 2013, A&A, 553, A132
- Mihos & Hernquist (1994) Mihos, J. C., & Hernquist, L. 1994, ApJ, 437, L47
- Monreal-Ibero et al. (2010) Monreal-Ibero, A., Arribas, S., Colina, L., Rodríguez-Zaurín, J., Alonso-Herrero, A., & García-Marín, M. 2010, A&A, 517, A28
- Moustakas et al. (2010) Moustakas, J., Kennicutt, Jr., R. C., Tremonti, C. A., Dale, D. A., Smith, J., & Calzetti, D. 2010, ApJS, 190, 233
- Oliva et al. (1999a) Oliva, E., Lutz, D., Drapatz, S., & Moorwood, A. F. M. 1999a, A&A, 341, L75
- Oliva et al. (1999b) Oliva, E., Moorwood, A. F. M., Drapatz, S., Lutz, D., & Sturm, E. 1999b, A&A, 343, 943
- Pauldrach et al. (2001) Pauldrach, A. W. A., Hoffmann, T. L., & Lennon, M. 2001, A&A, 375, 161
- Pereira-Santaella et al. (2010) Pereira-Santaella, M., Diamond-Stanic, A. M., Alonso-Herrero, A., & Rieke, G. H. 2010, ApJ, 725, 2270
- Petric et al. (2011) Petric, A. O., et al. 2011, ApJ, 730, 28
- Pilyugin & Thuan (2005) Pilyugin, L. S., & Thuan, T. X. 2005, ApJ, 631, 231
- Rich et al. (2011) Rich, J. A., Kewley, L. J., & Dopita, M. A. 2011, ApJ, 734, 87
- Rich et al. (2012) Rich, J. A., Torrey, P., Kewley, L. J., Dopita, M. A., & Rupke, D. S. N. 2012, ApJ, 753, 5
- Roche & Aitken (1984) Roche, P. F., & Aitken, D. K. 1984, MNRAS, 208, 481
- Rupke et al. (2010) Rupke, D. S. N., Kewley, L. J., & Chien, L. 2010, ApJ, 723, 1255
- Rupke et al. (2008) Rupke, D. S. N., Veilleux, S., & Baker, A. J. 2008, ApJ, 674, 172
- Salpeter (1955) Salpeter, E. E. 1955, ApJ, 121, 161
- Sanders et al. (2003) Sanders, D. B., Mazzarella, J. M., Kim, D.-C., Surace, J. A., & Soifer, B. T. 2003, AJ, 126, 1607
- Savage & Sembach (1996) Savage, B. D., & Sembach, K. R. 1996, ARA&A, 34, 279
- Seymour (2009) Seymour, N. 2009, in Panoramic Radio Astronomy: Wide-field 1-2 GHz Research on Galaxy Evolution
- Smith et al. (2007) Smith, J. D. T., et al. 2007, ApJ, 656, 770
- Snijders et al. (2007) Snijders, L., Kewley, L. J., & van der Werf, P. P. 2007, ApJ, 669, 269
- Soto & Martin (2010) Soto, K. T., & Martin, C. L. 2010, ApJ, 716, 332
- Spoon et al. (2009) Spoon, H. W. W., Armus, L., Marshall, J. A., Bernard-Salas, J., Farrah, D., Charmandaris, V., & Kent, B. R. 2009, ApJ, 693, 1223
- Spoon & Holt (2009) Spoon, H. W. W., & Holt, J. 2009, ApJ, 702, L42
- Stierwalt et al. (2013) Stierwalt, S., et al. 2013, ApJS, 206, 1
- Sturm et al. (2002) Sturm, E., Lutz, D., Verma, A., Netzer, H., Sternberg, A., Moorwood, A. F. M., Oliva, E., & Genzel, R. 2002, A&A, 393, 821
- Sturm et al. (2006) Sturm, E., et al. 2006, ApJ, 653, L13
- Sutherland & Dopita (1993) Sutherland, R. S., & Dopita, M. A. 1993, ApJS, 88, 253
- Thornley et al. (2000) Thornley, M. D., Schreiber, N. M. F., Lutz, D., Genzel, R., Spoon, H. W. W., Kunze, D., & Sternberg, A. 2000, ApJ, 539, 641
- Tommasin et al. (2010) Tommasin, S., Spinoglio, L., Malkan, M. A., & Fazio, G. 2010, ApJ, 709, 1257
- Tremonti et al. (2004) Tremonti, C. A., et al. 2004, ApJ, 613, 898
- Vázquez & Leitherer (2005) Vázquez, G. A., & Leitherer, C. 2005, ApJ, 621, 695
- Veilleux et al. (2002) Veilleux, S., Kim, D., & Sanders, D. B. 2002, ApJS, 143, 315
- Veilleux et al. (2009) Veilleux, S., et al. 2009, ApJS, 182, 628
- Verma et al. (2003) Verma, A., Lutz, D., Sturm, E., Sternberg, A., Genzel, R., & Vacca, W. 2003, A&A, 403, 829
- Whitmore & Schweizer (1995) Whitmore, B. C., & Schweizer, F. 1995, AJ, 109, 960
- Wu et al. (2006) Wu, Y., Charmandaris, V., Hao, L., Brandl, B. R., Bernard-Salas, J., Spoon, H. W. W., & Houck, J. R. 2006, ApJ, 639, 157
| Object | RA (J2000) | Dec (J2000) | PA | [SIV] | [NeII] | [NeV] | [NeIII] | [SIII] |
|---|---|---|---|---|---|---|---|---|
| NGC0023 | 00:09:53.280 | 25:55:26.698 | -76.3197 | |||||
| NGC0034 | 00:11:06.434 | -12:06:26.003 | -78.7347 | |||||
| Arp256 | 00:18:50.759 | -10:22:36.353 | -79.5735 | |||||
| ESO350-IG038 | 00:36:52.588 | -33:33:17.757 | 119.642 | |||||
| NGC0232_W | 00:42:45.666 | -23:33:40.697 | -88.0222 | |||||
| NGC0232_E | 00:42:52.658 | -23:32:27.487 | -88.0338 |
Note. — Spitzer/IRS Short-High line fluxes for the GOALS sources. The central wavelength of each line is indicated. The RA and DEC of the center of the slit is given for each source. Line fluxes are in units of . Sources without line fluxes or upper limits were either not observed with the Short-High module, or they have lines that fall outside the Short-High bandpass. The other parameters used in this paper and their references are: (Armus et al., 2009, Table 1), PAH EQW and merger stages (Stierwalt et al., 2013, Table 1), and IR8 (Díaz-Santos et al. in prep.). The full table is available in the electronic version of the paper.
| Object | RA (J2000) | Dec (J2000) | PA | [SIII] | [OIV] | [FeII] | [SIII] | [SiII] | |
|---|---|---|---|---|---|---|---|---|---|
| NGC0023 | 00:09:53.322 | 25:55:22.955 | -161.130 | ||||||
| NGC0034 | 00:11:06.484 | -12:06:29.735 | -163.545 | ||||||
| Arp256 | 00:18:50.811 | -10:22:40.084 | -164.383 | ||||||
| ESO350-IG038 | 00:36:52.639 | -33:33:14.027 | 34.8284 | ||||||
| NGC0232_W | 00:42:45.762 | -23:33:44.269 | -172.832 | ||||||
| NGC0232_E | 00:42:52.755 | -23:32:31.060 | -172.844 |
Note. — Spitzer/IRS Long-High line fluxes for the GOALS sources. The central wavelength of each line is indicated. The RA and DEC of the center of the slit is given for each source. Line fluxes are in units of . The units of is . Sources without line fluxes or upper limits were either not observed with the Long-High module, or they have lines that fall outside the Long-High bandpass. The other parameters used in this paper and their references are: (Armus et al., 2009, Table 1), PAH EQW and merger stages (Stierwalt et al., 2013, Table 1), and IR8 (Díaz-Santos et al. in prep.). The full table is available in the electronic version of the paper.
Appendix A The Line Profiles of Neon and Oxygen Emission Lines
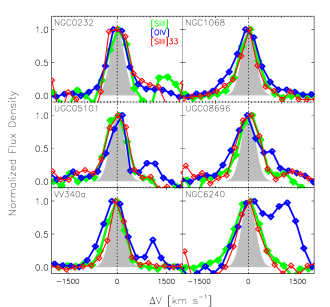
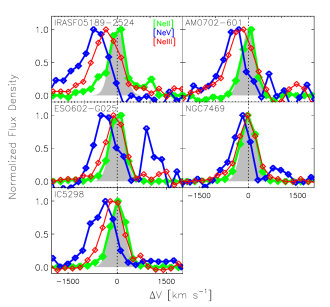
In Figure 14, the five GOALS sources showing [NeIII] or [NeV] emission line velocity shifts of relative to the [NeII] emission are shown. All of these objects have asymmetric profiles with blue wings. Since all of these sources have [NeV] detected, they are likely to harbor buried AGN. However, not all of these sources are AGN dominated. For example, ESO 602-G025 (catalog ) has and , and thus most of the emission is probably coming from a starburst. Two of the sources with high velocity shifts, IRAS F05189-2524 (catalog ) () and NGC 7469 (catalog ) (), are presented in Spoon & Holt (2009) and Dasyra et al. (2011), respectively. Spoon & Holt (2009) show a clear correlation of blue shifted emission and ionization in in local ULIRGs. We find a similar result for the GOALS sources studied here.
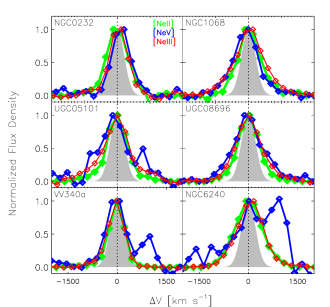
In Figure 15, representative objects possessing resolved line profiles (FWHM ) 888This corresponds to a velocity dispersion of corrected with the instrumental intrinsic velocity dispersion of . This FWHM is over the average width of the unresolved neon emission line in the GOALS sources. in at least one of the neon emission lines are shown. There are 80 sources in total that have at least one resolved neon emission line with FWHM . All of the sources show velocity shifts are in this category as well. Line widths, corrected for instrumental resolution, are given in Table 3.
As in Figure 14 and Figure 15, representative [OIV] emission line profiles are shown in Figures 16 and 17. There are ten objects in our sample exhibiting [OIV] emission lines shifted in velocity with respect to [NeII] by more than . There are 98 GOALS sources with resolved [OIV] emission lines, and 69 of these are starburst dominated.
| Object | [NeII] | [NeIII] | [NeV] |
|---|---|---|---|
| NGC0034 | … | ||
| NGC0232_W | … | … | |
| NGC0232_E | |||
| NGC0317B | … | … | |
| MCG-03-04-014 | … | … | |
| RR032_N | … | … |
Note. — Resolved neon emission line widths for the 80 sources which show at least one resolved neon emission line features. More can be found in the electronic version of the paper. Intrinsic linewidths, corrected for instrumental broadening, are given in . See text for a full description.