The Angular Broadening of the Galactic Center Pulsar SGR J1745-29: A New Constraint on the Scattering Medium
Abstract
The pulsed radio emission from the Galactic Center (GC) magnetar SGR J1745-29 probes the turbulent, magnetized plasma of the GC hyperstrong scattering screen through both angular and temporal broadening. We present the first measurements of the angular size of SGR J1745-29, obtained with the Very Long Baseline Array and the phased Very Large Array at 8.7 and 15.4 GHz. The source sizes are consistent with the scatter–broadened size of Sagittarius A* at each frequency, demonstrating that SGR J1745-29 is also located behind the same hyperstrong scattering medium. Combining the angular broadening with temporal scattering obtained from pulsar observations provides a complete picture of the scattering properties. If the scattering occurs in a thin screen, then it must be at a distance kpc. A best-fit solution for the distance of a thin screen is kpc, consistent with being located in the Scutum spiral arm. This is a substantial revision of the previously held model in which the scattering screen is located very close to the GC. As also discussed in Spitler et al. (2013), these results suggest that GC searches can detect millisecond pulsars gravitationally bound to Sgr A* with observations at GHz and ordinary pulsars at even lower frequencies.
1 Introduction
A pulsar in orbit around Sagittarius A*, the black hole at the center of the Galaxy, has the potential to provide a powerful probe of general relativity and the structure of space-time in the strong field limit (e.g., Backer & Hellings, 1986; Wex & Kopeikin, 1999; Pfahl & Loeb, 2004; Cordes et al., 2004; Liu et al., 2012). There have been numerous searches for such a pulsar without success (e.g., Kramer et al., 2000; Johnston et al., 2006; Deneva et al., 2009; Macquart et al., 2010; Siemion et al., 2013; Eatough et al., 2013b). Searches of this kind have been assumed to be challenging due to the presence of very large temporal broadening of radio pulses due to strong interstellar scattering (Cordes & Lazio, 1997) that is inferred from the very large angular broadening seen for Sgr A* and other GC sources, with sizes of arcsec at 1.4 GHz (van Langevelde et al., 1992; Bower et al., 2006). The GC hyperstrong scattering screen has been modeled with a turbulent, ionized thin screen at a distance from the GC of pc (Lazio & Cordes, 1998). The large angular broadening and the proximity of the screen to the GC implies a temporal broadening of pulsed emission of seconds at 1.4 GHz, eliminating any opportunity to detect pulsars at low frequencies. Pulsar searching at higher frequencies, however, is less sensitive due to the typical steep pulsar spectrum. Detection of a pulsar in the GC provides us with the opportunity to simultaneously probe the angular and temporal properties of the scattering medium.
The pulsar SGR J1745-29 was discovered serendipitously through its X-ray emission by the Swift telescope (Kennea et al., 2013). Subsequent NuSTAR observations detected periodic flux variations with s and a hydrogen absorption column characteristic of a GC location (Mori et al., 2013). Chandra observations demonstrated that the source was offset from Sgr A* by approximately 3 arcseconds, or a projected separation of 0.1 pc (Rea et al., 2013). The measured period derivative implies a magnetic field G and a characteristic age of kyr. The spin down power is inadequate to account for the X-ray flux, identifying SGR J1745-29 as a magnetar (Thompson & Duncan, 1995).
Radio pulsations were detected from SGR J1745-29 at frequencies ranging from 1.4 to 20 GHz (Eatough et al., 2013a; Shannon & Johnston, 2013; Spitler et al., 2013). The radio observations confirm the X-ray pulse period and period derivative. They also determine the dispersion measure and the rotation measure . These two measures of the line of sight plasma properties indicate that SGR J1745-29 is very likely to be physically close to Sgr A* and shares many of the same line of sight characteristics; the DM is consistent with predictions of the galactic electron density model (Cordes & Lazio, 2002).
We present here the first very long baseline interferometric (VLBI) observations of SGR J1745-29 obtained with the Very Long Baseline Array (VLBA) and the phased array output of the Karl G. Jansky Very Large Array (VLA). These observations provide a direct measurement of the angular size of SGR J1745-29. Coupled with temporal broadening from pulsar observations (Spitler et al., 2013), we are able to place a new set of constraints on the geometric model for hyperstrong scattering screen. We present our observations and data analysis in § 2 and discuss results in § 3.
2 Observations and Data Reduction
SGR J1745-29 has been observed 4 times using the VLBA + phased VLA as part of a campaign to measure the proper motion of SGR J1745-29 (project codes BB336, BB337; Table 1). Each observation was 6 hours in duration and used Sgr A* as a delay and phase calibrator. In the first observation, the VLA was in the D configuration and the synthesized beam was large enough to encompass both SGR J1745-29 and Sgr A* simultaneously. For this observation only, an external phase reference calibrator (J1752–3001) was observed for 1 minute every 5 minutes. For all other observations, the VLA synthesized beam was too small to include both Sgr A* and SGR J1745-29 simultaneously, and so we performed a nodding cycle of total duration 2.5 minutes, with 36 seconds spent on Sgr A* and 96 seconds on SGR J1745-29.
| Epoch | VLA configuration | phased VLA resolution | Observing frequency |
|---|---|---|---|
| (MJD) | (″) | (GHz) | |
| 56422 | D | 8.5 | 8.540 – 8.796 |
| 56444 | C | 2.6 | 8.540 – 8.796 |
| 56473 | C | 1.5 | 15.240 – 15.496 |
| 56486 | C | 2.6 | 8.540 – 8.796 |
Due to scatter–broadening, Sgr A* appears as a Gassian with major axis size 1.32 mas at a wavelength cm (Bower et al., 2006). Nearby background sources are also scatter–broadened, making it impossible to calibrate the longest VLBA baselines. We were unable to calibrate the Saint Croix, Mauna Kea and Hancock stations; only short timeranges of useful data were obtained for Brewster, North Liberty and Owens Valley. The first observation which included an external calibrator provided better results for the more distant stations than the subsequent observations. Difficulties with array phasing resulted in the loss of 2 hours of data from the second epoch, reducing sensitivity and coverage.
Before VLBI correlation proceeded, the phased VLA data were analysed to provide contemporaneous timing information to enable pulsar gating (e.g. Deller et al., 2007). For VLBI observations, the phased VLA records baseband voltage in VDIF format (Whitney et al., 2009), which we then processed using DiFX correlator tools (Deller et al., 2011) and the DSPSR software (van Straten & Bailes, 2011). Then, for each observation of SGR 174529, a 256-channel coherently dedispersing filterbank was applied to split the full band into 1-MHz wide channels, and remove interstellar dispersion at the known DM of the pulsar. This was followed by full-Stokes detection and averaging into 4096-bin single pulse profiles (1 ms time resolution). By measuring the amplitude of the VLA 10 Hz switched noise calibration signal as a function of frequency and polarization, we were able to correct for differential gain and subtract the switched noise signal from the filterbank data. The calibrated, 10-Hz-removed pulse profiles were averaged into 5-minute integrations for MJD 56422 and 90-second integrations for following epochs, from which we generated pulse times of arrival (TOAs) in four 64-MHz subbands using the PSRCHIVE software (Hotan et al., 2004; van Straten et al., 2012). The pulse reference phase, average pulse period and DM for each observing session were measured using the TEMPO software111http://tempo.sourceforge.net. This information was then used to determine an on-pulse gate for VLBI correlation.
The average pulse profile (Figure 1) determined from our VLA data consists of two broad features with an overall width 150 ms, and a low-level trailing component extending another 100 ms. However, individual pulses vary dramatically in shape, and exhibit structure on ms timescales. The width of these subpulses can be used to constrain the temporal scatter broadening affecting the pulsar. To quantify this, we reprocessed our MJD 56486 data into 32768-bin single pulse profiles (0.1 ms time resolution). We computed the average autocorrelation function (ACF) of all the high-resolution pulses using an on-pulse window of 0.40.6 turns pulse phase. To remove potential bias due to any non-pulsar noise processes we subtracted the average ACF measured in two adjacent off-pulse windows of identical length (pulse phase 0.20.4 and 0.60.8). The ACF shows a sharp, fully resolved component with a width of 1.9 ms. Temporal scatter-broadening in excess of this value would push power to larger lags, so we interpret this as a conservative upper limit on the scatter-broadening timescale at 8.7 GHz. This upper limit is consistent with a measured timescale at 8.36 GHz of ms (Spitler et al., 2013).

The VLBA and phased VLA data were correlated using the DiFX correlator (Deller et al., 2011). Three correlator passes were employed:
-
1.
a gated pass using the ephemeris information derived from the VLA and the position of SGR J1745-29 for all scans on SGR J1745-29 or Sgr A* (the “gated” pass);
-
2.
an ungated pass using the position of SGR J1745-29 for all scans on SGR J1745-29 or Sgr A* (the “ungated” pass); and
-
3.
an ungated pass using the position of Sgr A* for all scans on SGR J1745-29 or Sgr A* (the “calibrator” pass).
A simple pulsar gate of width approximately 150 ms was used, boosting the S/N by a factor of on SGR J1745-29 in the gated pass.
Data reduction used the AIPS software package (Greisen, 2003) with the ParselTongue interface (Kettenis et al., 2006). Visibility amplitudes were corrected for the logged system temperatures (and the nominal correction for the VLA, since no logged information was available). Delay calibration was performed using the ungated dataset with J1752–3001 in the first epoch and Sgr A* in subsequent epochs. Phase and amplitude self calibration with a timescale of 20s was performed using Sgr A*. The solutions and visibilities were flagged to remove outliers and Sgr A* was imaged using natural weighting with visibility weights raised to the power 0.5 to reduce the dominance of the VLA baselines. The calibration and flags were then applied to the gated and ungated correlator pass data.
Imaging at the position of SGR J1745-29 requires an accurate subtraction of Sgr A*, which is only several hundred synthesized beamwidths away and around 5000 times brighter than SGR J1745-29 in the ungated image. This is particularly problematic in the second and subsequent epochs, because Sgr A* moves through the sidelobe pattern of the phased VLA during observations of SGR J1745-29, suffering large gain variations. We remove Sgr A* by visibility peeling. Phase and amplitude self–calibration solutions were determined for the VLA using the ungated pass visibilities and the Sgr A* model derived from the calibrator pass. This calibration was applied to the gated pass dataset and the model of Sgr A* from the clean image was subtracted; then, the calibration was reverted using the AIPS task CLINV. In this way, optimal signal–to–noise was obtained for both the peeling solutions and the final gated image.
For the 3rd epoch at 15 GHz, Sgr A* is further into the sidelobes of the phased VLA, making the effective VLA gain in the direction of Sgr A* during the scans on SGR J1745-29 even lower and more rapidly variable. Unsurprisingly, this epoch suffered from much worse dynamic range issues resulting from the imperfect subtraction of Sgr A*.
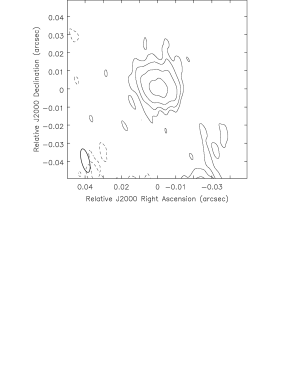
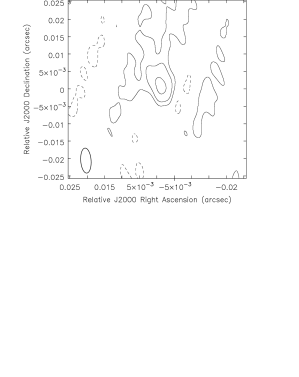
After imaging with IMAGR using the same weighting scheme the sources were fitted using the AIPS task JMFIT. The resulting deconvolved, scatter–broadened sizes for SGR J1745-29 and Sgr A* are listed in Table 2. Images of SGR J1745-29 at 8.7 and 15.4 GHz are shown in Figure 2. The 15.4 GHz image clearly shows the residual effects of imperfect calibration and subtraction of Sgr A*, and highlight that the fitted values at this frequency should be interpreted with caution.
|
| Observation | Deconvolved SGR J1745-29 fit | Deconvolved Sgr A* fit | VLBI beam |
|---|---|---|---|
| (MJD) | (mas) | (mas) | (mas) |
| 8.7 GHz | |||
| 56422 | 16.1 9.4 at 87° | 16.48 7.71 at 83.3° | 13.34.3 at 14° |
| 56444 | 15.6 10.1 at 81° | 15.9 6.8 at 89.5° | 17.68.1 at 9° |
| 56486 | 16.1 10.9 at 71° | 16.07 8.02 at 82.0° | 15.08.0 at 6° |
| Average | at 82° | at 82.7° | … |
| 15.4 GHz | |||
| 56473 | 6.8 4.4 at 35° | 5.44 3.66 at 81.5° | 7.33.0 at 5° |
3 Discussion and Conclusions
The measured size for Sgr A* is consistent with past measurements of the scattering law. Bower et al. (2004) obtained a size of mas in position angle degrees at a frequency of 8.4 GHz. Scaling by the law to 8.7 GHz, the observation frequency of these new measurements, we find a size mas, which is in agreement with the measured sizes for Sgr A* in Table 2. SGR J1745-29 has an angular size that is statistically indistinguishable from that of Sgr A* at 8.7 GHz. The small difference in the 15.4 GHz fits is almost certainly due to residual calibration/subtraction errors. The similarity between the angular broadening seen for SGR J1745-29 and Sgr A* confirms that SGR J1745-29 must be close to the GC and share a similar line of sight scattering medium. In particular, it rules out the possibility that SGR J1745-29 resides in front of the hyperstrong GC scattering screen, which would otherwise be a possible explanation for the low temporal broadening discussed below.
The temporal scattering, , is related to the angular broadening due to the longer path length required for scattered photons to reach the observer. The time delay is proportional to the path integral of the solid angle and, therefore, has a different weighting with distance than the angular broadening angle. For the same angular broadening, the temporal broadening is much larger if the scattering occurs close to the source. The angular and temporal scattering scales for a thin scattering screen are related by the following equation:
| (1) |
where kpc (Genzel et al., 2010) is the distance to the GC, is the distance from the GC to the pulsar, and is the observing frequency in GHz (Cordes & Lazio, 1997). is the observed angular size extrapolated to a frequency of 1.0 GHz using a scaling of . This equation assumes a symmetric scattering medium, which is accurate to a factor of 2 in this case. The effects of anisotropy on scattering tend to be small (Chandran & Backer, 2002). We use the geometric mean of the major and minor scattering axes at 8.7 GHz for our calculations, mas, implying mas.
Lazio & Cordes (1998) determined kpc, implying that ranges from 18 to 120 s at 1.4 GHz for the range of . The maximal broadening occurs for the screen closest to Sgr A*. Thus, this estimate for is clearly inconsistent with the detection of pulsed emission at frequencies below a few GHz in a pulsar with even a period as large as s.
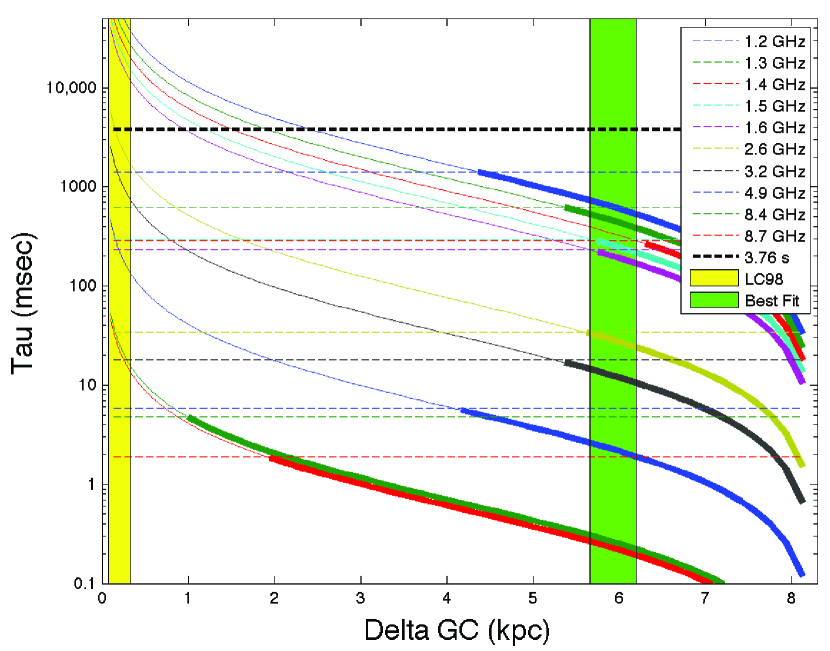
We combine our angular broadening measurement with temporal broadening measurements from Spitler et al. (2013) and our 8.7 GHz VLA data to constrain (Figure 3). Solutions are permitted for values of where falls below the measured pulse width. We consider only measurements at frequencies GHz; above this frequency, the scattering timescale becomes much smaller than the intrinsic pulse widths. A thin screen solution is consistent for all frequencies with kpc. A best-fit solution using a scattering time scale at 1 GHz of s (Spitler et al., 2013) for a thin screen scattering distance is kpc.
This estimate for is significantly larger than the upper bound on set by the OH/IR star distribution and the number counts of extragalactic background sources Lazio & Cordes (1998). Recent results provide a counter to each of these arguments. First, while a subset of the OH/IR stars within the central 0.5 degree do show very strong scattering, scattering angles that are smaller by only a factor of two are seen as far away as 6 deg from Sgr A*. The discovery of patchiness in the scattering medium (Roy, 2013) suggests that the line of sight towards Sgr A* may not be as unique as previously stated and that the assumption of a single uniform screen for Sgr A* and the OH/IR stars is not sufficient. Second, new extragalactic background source counts indicate that deficit in source counts previously found may not be as significant as previously estimated. Lazio & Cordes (1998) reported a significant deficit in 1.3 and 1.7 GHz surveys of the GC, which was accounted for by very strong scattering that leads to angular broadening of for extragalactic sources. However, Roy (2013) recently used 154 and 255 MHz extragalactic source counts to show that only a small fraction of sources are missing due to scattering. Additionally, other scattering sources that are either very close to or more distant from the GC could affect extragalactic background sources without influencing Sgr A* or SGR J1745-29.
Additionally, the detection of Sgr A* at 330 MHz demonstrates that the free-free optical depth towards Sgr A* is (Nord et al., 2004). As van Langevelde et al. (1992) demonstrate, a low optical depth requires that the scattering screen be located at a distance kpc, consistent with our much larger distance.
Since the hyperstrong scattering medium is not local to the GC, it must be located in one or more scattering screens along the line of sight to the GC. A few other lines of sight, such as towards NGC 6334B and the Cygnus region, have comparable or larger scattering measures, which are argued to be due to random superposition of very turbulent clouds (Wilkinson et al., 1994; Trotter et al., 1998; Desai & Fey, 2001). The characteristic turbulent clump size in the interstellar medium of 50 pc (Fey et al., 1991) has a sufficiently large angular size at 5.9 kpc to be responsible for Sgr A*, SGR J1745-29, and many of the OH/IR masers. A distance of 5.9 kpc from the GC falls within or close to the Scutum arm, which hosts giant molecular clouds and HII regions that could be responsible for the scattering (Reid et al., 2009).
Radio continuum measurements towards the GC constrain the physical conditions of the scattering screen with a relationship between , , the outer scale of the turbulent electron density (in pc), and , the electron temperature (in K; Lazio & Cordes, 1998):
| (2) |
For kpc, we find solutions at typical warm and hot ionized medium temperatures ( and K) of pc and pc. These estimates for the outer scale are consistent with the lower limit of pc found from other galactic measurements (Armstrong et al., 1995). Thus, the scattering screen appears to have properties that are consistent with other turbulent regions in the interstellar medium.
The scatter broadening may occur in a thick screen or other unconventional geometric model in which Equation 1 does not hold. Spitler et al. (2013) discuss thick screen models and the evidence that may support that interpretation. Our results demonstrate, however, that the angular broadening of SGR J1745-29 resembles that of Sgr A* and we have very strong constraints on that image: the angular size scales as and the angular size at a given wavelength is very well parametrized as a Gaussian (Bower et al., 2004). These facts point to a conventional thin screen model for the pulsar scattering.
The absence of strong temporal broadening for the SGR J1745-29, coupled with clear evidence that SGR J1745-29 sees the same scattering medium as Sgr A* via the angular broadening, makes clear that millisecond pulsar companions to Sgr A* can be detected at frequencies GHz, while ordinary pulsars can be detected at frequencies of a few GHz. Searches at 10 GHz will face temporal broadening of less than a millisecond, making observations sensitive to even the fastest spinning pulsars orbiting the black hole. It is surprising that past attempts to search for GC pulsars have not been successful given the expected large number of compact objects near Sgr A* and the broad frequency range of those surveys (Macquart et al., 2010, and references therein). The detection of a pulsar through the hyperstrong scattering medium demonstrates that past failures to discover a pulsar orbiting Sgr A* must inform us about search methodologies and/or the population of GC pulsars.
References
- Armstrong et al. (1995) Armstrong, J. W., Rickett, B. J., & Spangler, S. R. 1995, ApJ, 443, 209
- Backer & Hellings (1986) Backer, D. C. & Hellings, R. W. 1986, ARA&A, 24, 537
- Bower et al. (2004) Bower, G. C., Falcke, H., Herrnstein, R. M., Zhao, J., Goss, W. M., & Backer, D. C. 2004, Science, 304, 704
- Bower et al. (2006) Bower, G. C., Goss, W. M., Falcke, H., Backer, D. C., & Lithwick, Y. 2006, ApJ, 648, L127
- Chandran & Backer (2002) Chandran, B. D. G. & Backer, D. C. 2002, ApJ, 576, 176
- Cordes et al. (2004) Cordes, J. M., Kramer, M., Lazio, T. J. W., Stappers, B. W., Backer, D. C., & Johnston, S. 2004, New A Rev., 48, 1413
- Cordes & Lazio (1997) Cordes, J. M. & Lazio, T. J. W. 1997, ApJ, 475, 557
- Cordes & Lazio (2002) —. 2002, ArXiv Astrophysics e-prints
- Deller et al. (2011) Deller, A. T., Brisken, W. F., Phillips, C. J., Morgan, J., Alef, W., Cappallo, R., Middelberg, E., Romney, J., Rottmann, H., Tingay, S. J., & Wayth, R. 2011, PASP, 123, 275
- Deller et al. (2007) Deller, A. T., Tingay, S. J., Bailes, M., & West, C. 2007, PASP, 119, 318
- Deneva et al. (2009) Deneva, J. S., Cordes, J. M., & Lazio, T. J. W. 2009, ApJ, 702, L177
- Desai & Fey (2001) Desai, K. M. & Fey, A. L. 2001, ApJS, 133, 395
- Eatough et al. (2013a) Eatough, R. P., Falcke, H., Karuppusamy, R., Lee, K. J., Champion, D. J., Keane, E. F., Desvignes, G., Schnitzeler, D. H. F. M., Spitler, L. G., Kramer, M., Klein, B., Bassa, C., Bower, G. C., Brunthaler, A., Cognard, I., Deller, A. T., Demorest, P. B., Freire, P. C. C., Kraus, A., Lyne, A. G., Noutsos, A., Stappers, B., & Wex, N. 2013a, Nature
- Eatough et al. (2013b) Eatough, R. P., Kramer, M., Klein, B., Karuppusamy, R., Champion, D. J., Freire, P. C. C., Wex, N., & Liu, K. 2013b, in IAU Symposium, Vol. 291, IAU Symposium, 382–384
- Fey et al. (1991) Fey, A. L., Spangler, S. R., & Cordes, J. M. 1991, ApJ, 372, 132
- Genzel et al. (2010) Genzel, R., Eisenhauer, F., & Gillessen, S. 2010, Reviews of Modern Physics, 82, 3121
- Greisen (2003) Greisen, E. W. 2003, in Astrophysics and Space Science Library, Vol. 285, Astrophysics and Space Science Library, ed. A. Heck, 109
- Hotan et al. (2004) Hotan, A. W., van Straten, W., & Manchester, R. N. 2004, PASA, 21, 302
- Johnston et al. (2006) Johnston, S., Kramer, M., Lorimer, D. R., Lyne, A. G., McLaughlin, M., Klein, B., & Manchester, R. N. 2006, MNRAS, 373, L6
- Kennea et al. (2013) Kennea, J. A., Burrows, D. N., Kouveliotou, C., Palmer, D. M., Göğüş, E., Kaneko, Y., Evans, P. A., Degenaar, N., Reynolds, M. T., Miller, J. M., Wijnands, R., Mori, K., & Gehrels, N. 2013, ApJ, 770, L24
- Kettenis et al. (2006) Kettenis, M., van Langevelde, H. J., Reynolds, C., & Cotton, B. 2006, in Astronomical Society of the Pacific Conference Series, Vol. 351, Astronomical Data Analysis Software and Systems XV, ed. C. Gabriel, C. Arviset, D. Ponz, & S. Enrique, 497
- Kramer et al. (2000) Kramer, M., Klein, B., Lorimer, D., Müller, P., Jessner, A., & Wielebinski, R. 2000, in Astronomical Society of the Pacific Conference Series, Vol. 202, IAU Colloq. 177: Pulsar Astronomy - 2000 and Beyond, ed. M. Kramer, N. Wex, & R. Wielebinski, 37
- Lazio & Cordes (1998) Lazio, T. J. W. & Cordes, J. M. 1998, ApJ, 505, 715
- Liu et al. (2012) Liu, K., Wex, N., Kramer, M., Cordes, J. M., & Lazio, T. J. W. 2012, ApJ, 747, 1
- Macquart et al. (2010) Macquart, J.-P., Kanekar, N., Frail, D. A., & Ransom, S. M. 2010, ApJ, 715, 939
- Mori et al. (2013) Mori, K., Gotthelf, E. V., Zhang, S., An, H., Baganoff, F. K., Barrière, N. M., Beloborodov, A. M., Boggs, S. E., Christensen, F. E., Craig, W. W., Dufour, F., Grefenstette, B. W., Hailey, C. J., Harrison, F. A., Hong, J., Kaspi, V. M., Kennea, J. A., Madsen, K. K., Markwardt, C. B., Nynka, M., Stern, D., Tomsick, J. A., & Zhang, W. W. 2013, ApJ, 770, L23
- Nord et al. (2004) Nord, M. E., Lazio, T. J. W., Kassim, N. E., Goss, W. M., & Duric, N. 2004, ApJ, 601, L51
- Pfahl & Loeb (2004) Pfahl, E. & Loeb, A. 2004, ApJ, 615, 253
- Rea et al. (2013) Rea, N., Esposito, P., Israel, G. L., Papitto, A., Tiengo, A., Baganoff, F., Haggard, D., Mereghetti, S., Burgay, M., Possenti, A., & Zane, S. 2013, ATeL, # 5032
- Reid et al. (2009) Reid, M. J., Menten, K. M., Zheng, X. W., Brunthaler, A., Moscadelli, L., Xu, Y., Zhang, B., Sato, M., Honma, M., Hirota, T., Hachisuka, K., Choi, Y. K., Moellenbrock, G. A., & Bartkiewicz, A. 2009, ApJ, 700, 137
- Roy (2013) Roy, S. 2013, ArXiv e-prints
- Shannon & Johnston (2013) Shannon, R. M. & Johnston, S. 2013, ArXiv e-prints
- Siemion et al. (2013) Siemion, A., Bailes, M., Bower, G., Chennamangalam, J., Cordes, J., Demorest, P., Deneva, J., Desvignes, G., Ford, J., Frail, D., Jones, G., Kramer, M., Lazio, J., Lorimer, D., McLaughlin, M., Ransom, S., Roshi, A., Wagner, M., Werthimer, D., & Wharton, R. 2013, in IAU Symposium, Vol. 291, IAU Symposium, 57–57
- Spitler et al. (2013) Spitler et al., L. 2013, ApJ, submitted
- Thompson & Duncan (1995) Thompson, C. & Duncan, R. C. 1995, MNRAS, 275, 255
- Trotter et al. (1998) Trotter, A. S., Moran, J. M., & Rodriguez, L. F. 1998, ApJ, 493, 666
- van Langevelde et al. (1992) van Langevelde, H. J., Frail, D. A., Cordes, J. M., & Diamond, P. J. 1992, ApJ, 396, 686
- van Straten & Bailes (2011) van Straten, W. & Bailes, M. 2011, PASA, 28, 1
- van Straten et al. (2012) van Straten, W., Demorest, P., & Oslowski, S. 2012, Astronomical Research and Technology, 9, 237
- Wex & Kopeikin (1999) Wex, N. & Kopeikin, S. M. 1999, ApJ, 514, 388
- Whitney et al. (2009) Whitney, A., Kettenis, M., Phillips, C., & Sekido, M. 2009, in Proceedings of the 8th International e-VLBI Workshop. 22-26 June 2009. Madrid, Spain Published online at http://pos.sissa.it/cgi-bin/reader/conf.cgi?confid=82., p.42, 42–+
- Wilkinson et al. (1994) Wilkinson, P. N., Narayan, R., & Spencer, R. E. 1994, MNRAS, 269, 67