Nature of GRBs observed by RT-2 onboard CORONAS-PHOTON Satellite
Abstract
The RT-2 Experiment, a low energy gamma-ray telescope, onboard CORONAS-PHOTON satellite is designed to study the temporal, spectral and spatial properties of the hard X-ray solar flares mainly in the energy range of keV, which is extendable upto keV. During the operational period of months, it has been able to detect a few solar flares and at least four Gamma-Ray Bursts (GRBs). In this paper, we discuss the properties of the GRBs as observed by RT-2 in the energy band of 15 to 1000 keV. We will present the results of spectral and timing properties of the GRBs (specially for the GRB 090618) using RT-2 detectors. Temporal analysis suggests that all four GRBs belong to the category of long duration bursts.
Keywords: gamma-ray burst:general – instrumentation:detectors – supernovae:general
1 Introduction
RT-2 (named after Röntgen) Experiment (Debnath et. al. 2011, Nandi et. al. 2011, Kotoch et. al. 2011, Sarkar et. al. 2011, Sreekumar et. al. 2011, Rao et al. 2010, 2011a) is a part of Russian Solar mission satellite named Coronas-Photon. It was launched into 550 Km polar LEO (Low Earth Orbit) on 30th January, 2009 from Plesetsk Cosmodrome, Russia. The mission was dedicated to study mainly the solar flares in a wide energy band of electromagnetic spectrum ranging from UV to high-energy -rays (2000 MeV). But the mission has lost its functionality after months of its successful launch due to the failure of the main power-bus of the satellite.
RT-2 is an Indian Space Research Organization (ISRO) sponsored X-ray and low-energy -ray (up to 1 MeV) solar experiment in collaboration with MEPHI, Russia. It consists of an ensemble of three low-energy hard X-ray/gamma-ray payloads (RT-2/S, RT-2/G & RT-2/CZT). RT-2/S & RT-2/G are mainly sensitive in the energy range of keV. They also have extended detection capabilities, up to keV for RT-2/S and up to keV for RT-2/G (Debnath et al. 2011). But, RT-2/CZT is sensitive to the spectral energy range of keV with imaging capability.
The main scientific objectives of the RT-2 experiment were to explore temporal, spectral and spatial behaviors of the Sun and solar events, such as solar flares etc. Due to the large FOV of the RT-2 instruments and having the capability to act as an omni-directional detector in high energy range ( keV), detectors have been able to detect a few extra-solar events such as Gamma-Ray Bursts (GRBs). During the mission life time, RT-2 has co-discovered four GRBs - GRB 090618 (Rao et al. 2009, 2011a), GRB 090820, GRB 090926A, and GRB 090929A (Chakrabarti et al. 2009a, 2009b, 2009c).
In this paper, we discuss the timing and spectral properties of the first observed GRB 090618 and preliminary results of the other GRBs. The paper has been organised in the following way: in §2, a brief discussion on RT-2 observations and data analysis procedures is given, in §3 observational results of the GRBs are discussed and in §4 discussion and concluding remarks.
2 Observation and Data Analysis
In this paper, we present the results of the four GRBs as observed by RT-2. During its operational period, RT-2 has successfully co-discovered GRB 090618, GRB 090820, GRB 090926A & GRB 090929A. All these four GRBs were detected by RT-2/S and RT-2/G. However, RT-2/CZT has not been able to image any of these GRBs, because of the long duration commissioning phase of RT-2/CZT operation and the entire payload is shielded with Ta material, which restricts the detection of GRBs as these were observed at high inclination angle. In this Section, we will discuss about the observations and the data analysis procedure in briefly.
RT-2/S and RT-2/G are generally operated in the solar quiet mode (SQM) when the satellite orbits in the“GOOD” regions (i.e., outside the high background regions of Polar Caps and SAA), when count rates in eight channels (for each detector) are stored every second. The spectral data are stored every 100 s. The low energy spectra are stored separately for NaI(Tl) ( keV) and NaI(Cs) ( keV) detectors based on the pulse shape along with the high-energy spectrum in the energy range of keV (see, Debnath et al. 2011, for details). The onboard software automatically stores the data in finer time resolution ( s count rates and s spectra) during the solar flare mode (SFM), when the count rates exceed a pre-determined threshold limit. RT-2/CZT operates only in the SQM when s count rates, s spectra, and images are stored. It has no solar flare operation mode. The onboard performance of the RT-2 instruments are discussed in Nandi et al. (2009) and Rao et al. (2011b).
RT-2 light curve and spectral data were extracted from the ‘raw’ data using ground-based software. The data is processed further with the NASA’s software package heasoft6.8 using FTOOLS and XSPEC.
3 Results
3.1 GRB 090618
The GRB 090618 was discovered with the Swift BAT on 2009 June 18 at 08:28:29 UT (Schady et al. 2009) at a redshift of (Cenko et al. 2009a). The temporal profile of Swift/BAT showed that the GRB was very intense with multi-peak emission in gamma-rays. The GRB was also detected by various observatories in X-ray and gamma-ray energies such as AGILE (Longo et al. 2009), Fermi GBM (McBreen et al. 2009), Suzaku WAM (Kono et al. 2009), Konus-Wind on board the Wind satellite and Konus-RF on board the Coronas-Photon satellite (Golenetskii et al. 2009a), the RT-2 Experiment on board the Coronas-Photon satellite (Rao et al. 2009), etc. The optical afterglow of GRB 090618 was also immediately detected with the ROTSE-IIIb (Rujopakarn et al. 2009), Palomar 60 inch telescope (Cenko et al. 2009b). The Swift X-ray Telescope (XRT) was able to detect the X-ray afterglow (very bright in X-rays), just 121 sec after the BAT trigger. Within a few secs, the X-ray flux decayed rapidly with a slope of before breaking at s ( UT) to a almost flatter slope of (Beardmore et al. 2009).
GRB 090618 was very intense in hard X-rays and gamma-rays during the prompt emission phase that makes enable to study the time-resolved spectral characteristics of the different peak profiles. The GRB (band) model fitted spectra in the energy range of keV - MeV that obtained from the Konus-RF (from to s; UT) detector on board the Coronas-Photon satellite, provided the important parameters of the low-energy photon index (), high-energy photon index (), and peak energy () as , , and keV (Golenetskii et al. 2009a). The BAT light curve of the GRB in the energy band of 15-150 keV was found to be of a multi-peak structure with a duration of about s. The multi-peaked profile was also observed in the keV - MeV range light curve of the Suzaku Wide-band All-sky Monitor (Kono et al. 2009).


RT-2 instruments detected the GRB 090618 with a large off-axis angle of , which triggered at and lasted for almost 150 sec. During the event, the RT-2 payload was completely in the “SHADOW” mode (away from the Sun) with “GOOD” time (away from SAA and polar regions), which started at UT and ended at UT. Data from RT-2/S and RT-2/G are used for the present analysis.
3.1.1 Timing analysis results for GRB 090618
GRB 090618 was detected in the different energy bands of RT-2/S and RT-2/G detectors. The 1 sec binned light curves of the GRB, as seen by RT-2/S and RT-2/G are shown in Figure 1. The multi-structured burst profile is clearly seen in the light curve of 59 - 215 keV. The emission peaks are registered at +65 s, +85 s and at +115 s. To find the widths of the peaks, we tried to fit RT-2/G light curve data of 59-215 keV energy band with fast-rise-exponential-decay (FRED) profile developed by Kocevski et al. (2003).
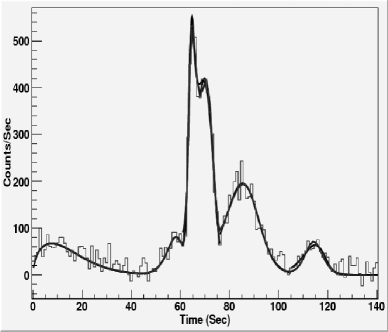
According to the FRED profile GRB photon flux can be defined as:
where is the maximum flux at time , and are the decaying indices for rising and decaying phases of any pulse (peak) respectively. We first fit individual peaks and then total light curve with the pulse profile of Eqn. (1). This model fitted light curve for RT-2/G detector in the energy band of 59 - 215 keV is shown on Fig. 2. We also fitted this model in the other energy bands of RT-2/G light curves. Finally we calculated widths of each peaks from our fittings. All the fitted parameters and pulse widths are noted in Table 1. We also compared our fitted results with Swift BAT data (Rao et al. 2011a).
| Pulse | Energy range (keV) | (s-1) | (s) | (s) | (s) | Width (s) |
|---|---|---|---|---|---|---|
| 1 | 532.0 | 65.0 | 81.1 | 13.8 | 6.30 | |
| 2 | 59-215 | 422.0 | 70.0 | 34.5 | 34 | 7.15 |
| 3 | 210.0 | 85.0 | 20.0 | 20.0 | 14.60 | |
| 4 | 72.0 | 114.0 | 42.0 | 40.0 | 9.49 | |
| 1 | 315.0 | 65 | 82.5 | 16.4 | 5.59 | |
| 2 | 215-330 | 200.0 | 70.0 | 41.6 | 34.2 | 6.17 |
| 3 | 76 | 85.0 | 25.0 | 22.0 | 12.17 | |
| 1 | 330-1000 | 144.0 | 65.0 | 78.3 | 22.5 | 4.77 |
| 2 | 64.0 | 70.0 | 88.0 | 84.0 | 2.93 |
3.1.2 Spectral analysis results for GRB 090618
Spectral analysis for the GRB was done by using the RT-2/S and Swift BAT data. We used keV BAT, keV -2/S G1, and keV -2/S G2 data for our combined spectral fitting analysis. While fitting the combined spectrum of BAT and RT-2, the relative normalisation factor was kept fixed at 1.30. Detailed spectral analysis is given in Rao et al. (2011a). The combined spectrum is well fitted with the standard BAND model. Spectral fitted results showed that the time averaged peak energy is at keV and integrated fluence in keV energy band is equal to ergs/cm2.

The GRB spectrum can be well fitted with the double power-law model introduced by Band et al. (1993). In this model, two power-laws join at break frequency E0, where and are the first and second power-law indices respectively, and is the break energy. Now one can calculate the peak energy by the relation . Figure 3 shows the unfolded BAND model fitted BAT and -2/S combined energy spectrum of the GRB 090618.
3.2 GRB 090820
The Fermi Gamma-Ray Burst Monitor (GBM) first detected the GRB 090820 by its trigger number 272421498 (Connaughton V. 2009) on 20th August, 2009 at 00:38:16.19 UT. The source location was at RA(J2000) = 87.7 degrees (5h 51m) and Dec(J2000) = 27.0 degrees (). The light curve of this bright GRB shows GBM triggered on a weak precursor, followed by a bright pulse beginning 30 sec later and lasting a further 30 seconds. The integrated event fluence is around ergs/cm2 in the energy band of 8-1000 keV.
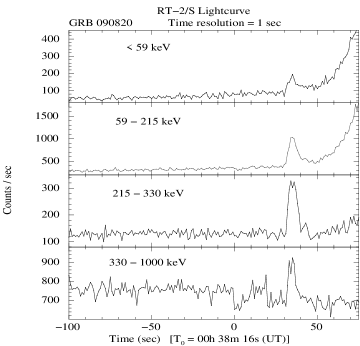
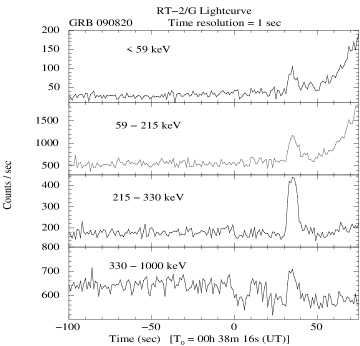
Both the RT-2 phoswich detectors (RT-2/S & RT-2/G) have detected this bright astrophysical event (Chakrabarti et al., 2009a). The satellite was in the GOOD/LIGHT mode with Earth latitude = and longitude = with 600 sec duration of GOOD time observation, starting at 00h 29m 16sec (UT) and ending at 00h 39m 16sec (UT). After 30 sec of the event, the satellite completely entered into the BAD mode of high charge particle region.
The 1 sec binned light curves of RT-2 detectors are shown in Figure 4. The GRB light curve shows a simple profile of a strong emission peak at T0+34 sec with a weak precursor (T0 = 00:38:16 UT). The time duration of the brightest emission is around sec with counts/sec in the energy band of 59 - 215 keV.
3.3 GRB 090926A
The very bright GRB 090926A was first detected by the Fermi-GBM trigger 275631628 (Bissaldi 2009) on 26th September, 2009 at 04:20:26.99 UT. The source location was at RA(J2000) = degrees (23h 38m), DEC(J2000) = degrees (), with an uncertainty of . The GBM light curve consists of single pulse with a duration (T90) of 20 sec. The integrated fluence in the energy range of 10 keV to 10 GeV is around ergs/cm2.


RT-2 instruments (RT-2/S & RT-2/G) also detected this bright GRB at T0 = 04h 20m 27s (UT) (Chakrabarti et al., 2009b). The satellite was in the LIGHT mode (pointing towards the Sun) for a short duration at a high latitude in its orbit. During this time, the GOOD time (away from the polar and SAA regions) observation was for 348 sec starting at 04h 16m 55sec (UT) and ending at 04h 22m 43sec (UT). This burst was also detected by KONUS-RF, another instrument onboard CORONAS-PHOTON satellite (Golenetskii et al., 2009b).
The burst light curve consists of multiple peaks of total duration of sec, followed by a weak tail ending at T0+30 sec. The strongest peak count rate is counts/sec in the energy band of 59- 215 keV. The 1 sec binned light curves of both the detectors at different energy band are shown in Figure 5.
3.4 GRB 090929A
The Fermi Gamma-Ray Burst Monitor first reported the GRB 090929A by its trigger (Rau, A., 2009). The event occurred at 04:33:03.97 UT on 29th September, 2009 in the sky location of RA(J2000) = 51.7 degrees (03h 27m), DEC(J2000) = -7.3 degrees (), with an uncertainty of 1.3 degrees. The integrated fluence in the energy range of 8-1000 keV is around ergs/cm2.


Both the phoswich detectors (RT-2/S & RT-2/G) of the RT-2 Experiment, have also detected this GRB (Chakrabarti et al., 2009c). During the time of GRB, the satellite was in the LIGHT mode (pointing towards the Sun) with GOOD time (i.e., away from the polar charge particle and SAA regions) observation of 1537 sec starting at 04h 21m 20sec (UT) and ending at 04h 46m 57sec (UT). This burst is also detected by KONUS-RF (Golenetskii et al., 2009c).
The 1 sec binned burst light curves show double peak profile of a total duration of just around 5 sec. The strongest peak count rate is counts/sec in the energy band of 59-215 keV. In Figure 6., the light curves are plotted at various energy bands for both the detectors.
4 Discussions and Concluding Remarks
In this paper, we have discussed briefly about the instruments of RT-2 Experiment onboard Russian CORONAS-PHOTON mission and discuss the observational results obtained from the four GRBs, observed by RT-2.
Immediately after the commissioning phase of RT-2 payloads, GRB 090618 was co-observed by RT-2 along with other X-ray and gamma-ray satellites. A complex, multiple peaks were observed in the light curve of GRB 090618. Spectro-timing analysis showed a systematic softening of the spectrum for the successive pulses which is associated with the variations in the timing parameters. The measured isotropic energy () and intrinsic peak energy () of this GRB are around ergs and keV. The results suggest that the GRB 090618 closely follows the ‘Amati’ relation. It has been recently suggested that GRB090618 has a multiple components, possibly even the signatures of the black holes (Izzo et al. 2012).
Timing analysis of other GRBs show that the burst width decreases with the increase of the energy ranges and also show the nature of the energy dependence of the gamma-ray variations. The GRBs that are detected by RT-2, belong to the category of long-duration bursts.
Acknowledgments The RT-2 project was made possible in part from a grant from Indian Space Research Organization (ISRO). We also acknowledge other scientific and technical team members of the RT-2 project.
References:
References
- [1] Beardmore, A. P., et al., 2009, GCN Circ., 9528, 1
- [2] Bissaldi, E., GCN Circ., 9933, 1
- [3] Cenko, S. B., et al., 2009a, GCN Circ., 9513, 1
- [4] Cenko, S. B., et al., 2009b, GCN Circ., 9518, 1
- [5] Chakrabarti, S. K., et al., 2009a, GCN Circ., 9833, 1
- [6] Chakrabarti, S. K., et al., 2009b, GCN Circ., 10009, 1
- [7] Chakrabarti, S. K., et al., 2009c, GCN Circ., 10010, 1
- [8] Connaughton, V, 2009, GCN Circ., 9829, 1
- [9] Debnath, D., et al., 2011, Exp. Astron., 29, 1
- [10] Golenetskii, S., et al., 2009a, GCN Circ., 9553, 1
- [11] Golenetskii, S., et al., 2009b, GCN Circ., 9959, 1
- [12] Golenetskii, S., et al., 2009c, GCN Circ., 9968, 1
- [13] Izzo, L. et al, 2012, A&A, 543A, 10
- [14] Kocevski, D., & Liang, E. 2003, ApJ, 594, 385
- [15] Kono, K., et al. 2009, GCN Circ., 9568, 1
- [16] Kotoch, T. B., et al., 2011, Exp. Astron., 29, 27
- [17] Longo, F., et al. 2009, GCN Circ., 9524, 1
- [18] McBreen, S., et al. 2009, GCN Circ., 9535, 1
- [19] Nandi, A., et al., 2009, ICST Conf. Proc. (arXiv:astro-ph/0912.4126)
- [20] Nandi, A., et al., 2011, Exp. Astron., 29, 55
- [21] Rao, A. R., et al. 2010, ApJ, 714, 1142
- [22] Rao, A. R., et al. 2011a, ApJ, 728, 42
- [23] Rao, A. R., et al. 2011b, SoSyR, 45, 123
- [24] Rao, A. R., et al. 2009, GCN Circ., 9665, 1
- [25] Rau, A., 2009, GCN Circ., 9962, 1
- [26] Rujopakarn, W., et al. 2009, GCN Circ., 9515, 1
- [27] Sarkar, R., et al., 2011, Exp. Astron., 29, 85
- [28] Schady, P., et al. 2009, GCN Circ., 9512, 1
- [29] Sreekumar, S., et al., 2011, Exp. Astron., 29, 109