Jingfang Fan
State Key Laboratory of Theoretical Physics, Institute of Theoretical Physics, Chinese Academy of Sciences, P.O. Box 2735, Beijing 100190, China
Xiaosong Chen
chenxs@itp.ac.cn
State Key Laboratory of Theoretical Physics, Institute of Theoretical Physics, Chinese Academy of Sciences, P.O. Box 2735, Beijing 100190, China
([)
Abstract
We introduce a general clique community, which consists of adjacent -cliques sharing at least vertices with .
The emergence of a giant clique community indicates a clique percolation, which is studied by the largest size gap
of the largest clique community during network evolution and the corresponding evolution step . For a clique percolation, the averages
of and and the root-mean-squares of their fluctuations have power law finite-size effects whose exponents are related to the
critical exponents. The fluctuation distribution functions of and follow a finite-size scaling form. In the evolution of
the Erdős-Rényi network, there are a series of clique percolation with , and so on.
The critical exponents of clique percolation depend on , but are independent of . The universality class of a clique percolation
is characterized alone by .
pacs:
02.10.Ox, 89.75.Hc, 05.70.Fh, 64.60.-i
Community structure is of great interest in the studies of networks gn-pnas ; fortunato2010community . The term network community is defined as a group
of vertices that are more densely connected each other than other vertices in a network. The clique bollobas-book and core Dorogovtsev1
are the two examples of network community. To analyze the overlapping community structure of networks, Palla et al.Pallasubm proposed the
clique percolation method (CMP) to build up the communities from -cliques, which is a fully connected subset of vertices. Two -cliques are
considered to be adjacent if they share vertices. A clique community is defined as the maximal union of -cliques that can be reached from each
through a series of adjacent -cliques.
When the size of a clique community is comparable to network size , a giant clique community emerges and there is a clique percolation.
Derényi et al.Derenyi studied the clique percolation of the Erdős-Rényi (ER)
modele-r . The -cliques percolation takes place when the probability of connecting two vertices in the network reaches the
threshold Derenyi . The normal percolation transition of ER model corresponds to the clique percolation.
In this Letter, we introduce a general clique community, where any two adjacent -cliques share at least vertices with .
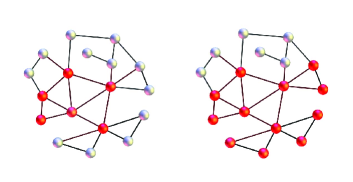
For the same network, the clique communities of different are different. As an illustration, and clique
communities in a network are shown in Fig.1 and they are different. A clique percolation appears with the emergence of a giant clique community. The previous clique percolation discussed in Ref.Derenyi corresponds to the special case of general clique percolation. The normal percolation transition corresponds to a clique percolation. Here we study the general clique percolation of the ER model by analyzing the finite-size effects of network evolution. From the power law exponents of finite-size effects, we can obtain the critical exponents of clique percolation.
At first, we calculate the threshold of the clique percolation using the approach developed by Newman, Watts, and Strogatznewman-arbitPk .
From the probability distribution of vertex degrees, we define the generating functions and
, where is the excess degree distribution of network newman2010networks .
Figure 1: (color online)
Sketches of different clique communities in a network. The vertices belonging to a clique community are marked with red color.
The largest clique community is shown on the left and the largest clique community on the right.
The generating function of the probability distribution for the sizes of the components reached from a randomly chosen edge satisfies
a self-consistent equation
(1)
When its first derivative becomes infinite, a giant component appears and there is a percolation. This corresponds to .
After taking -clique as the new unit and considering two cliques to be adjacent if they share at least vertices, the average degree
of a -cliques is
(2)
where is the probability to connect two vertices with an edge. Correspondingly, the average excess degree of the -cliques is
(3)
The threshold of clique percolation can be determined from the equation
(4)
which gives
(5)
(6)
For , the correction term in Eq.5 vanishes and , which is in agreement with the result of Derényi
et al Derenyi ; palla2007critica . For , the correction term exists. For general , only is obtained by Bollobás and Riordanbollobas .
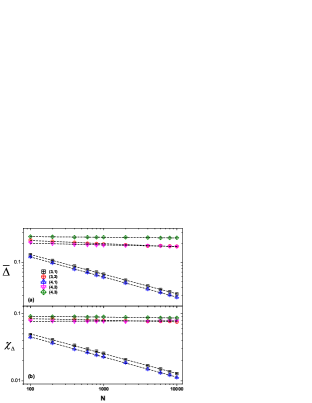
Figure 2: (color online) Log-log plot of the average size gap and the root-mean-square of its fluctuation
versus for different clique percolation. Power law behaviors of and are confirmed by
simulation data. From the slopes of fitting lines, and can be obtained and are summarized in Table I.
In the following, we study clique percolation of ER model with Monte Carlo simulation and finite-size effects of network
evolution fanjingfang . During an evolution process, the largest clique community has a size gap
at an evolution step . The largest reduced size gap during the whole evolution process is
(7)
which could be related to a percolation transition at the corresponding evolution step . From the results of and in many Monte Carlo simulations, we can calculate the average size gap and the average transition point . Since and therefore , it is convenient to introduce a reduced evolution step and the reduced transition point . We anticipate that and have the power law finite-size effects as
The character of clique percolation is determined by the exponent . The clique percolation is continuous when and discontinuous when Nagler .
The fluctuations and are investigated also. Their root-mean-squares are defined as
(11)
(12)
which decay algebraically as
(13)
(14)
We anticipate a finite-size scaling form of fluctuation distribution functions as
(15)
(16)
The universality class of continuous clique percolation is characterized by the critical exponents , , and .
Different clique percolation with the same critical exponents belong to the same universality class.
In Fig.2(a), the average is plotted with respect to network size for , and .
The log-log plot of versus show that . From the slope of fitting line, we can get the exponent
. It has been obtained that for , for , for , and for . Within error bars, for and different are equal. At , we get for and for . The exponents of are different from that of . At , for and is different from that of and . So the universality class of clique percolation is characterized by .
In Fig.2(b), the log-log plot of versus is shown for different . The slope of curve gives the exponent .
It is found that is equal to the corresponding within error bars.
The finite-size effects of are shown in Fig. 3(a) for and Fig. 3(b) for .
From the Monte Carlo data, the values of and are determined simultaneously. For , we get for
and for . For , we obtain for , for , and for . The of clique percolation shows deviation from a simple power law of . This deviation could be resulted by additional finite-size terms. of different and the same are equal within error bars. We summarize and of different clique percolation in Table I.
The root-mean-square of is shown in Fig.4. Our results of simulations confirm the power-law behavior of . For ,
we get for and for . At , we obtain for , for ,
and for . Other results of are given in Table I. of different and the same
are equal within error bars. This confirms further that the universality of clique percolation is characterized alone by . The exponent agrees with at , but differs from at .
Figure 3: (color online) Log-log plot of versus . The results of is shown in (a) and in (b). The slopes of fitting lines give , which is defined in Eq. 9 and summarized in Table I.
Figure 4: (color online) Log-log plot of versus . The slopes of fitting lines give , which is defined in Eq. 12 and summarized in Table I.
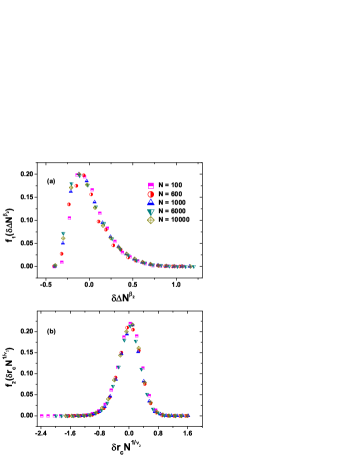
For a network with size , we simulate its evolution for many times. At each simulation, we can get the largest reduced size gap
and the corresponding transition point . From the results of many simulations, the fluctuation distribution functions
and can be obtained. Five different network sizes are chosen.
Each fluctuation distribution function has five different curves. Using the finite-size scaling forms of Eq. 15 and 16, five curves of
each distribution function collapse into one curve of finite-size scaling function. The scaling variables are defined with the exponents and
obtained from and . In Fig. 5, the finite-size scaling functions
and are shown for clique percolation. and of other clique percolation have similar behavior.
Figure 5: (color online) Finite-size scaling functions of fluctuation distribution functions (a) and (b) for clique percolation.
In the evolution process of the ER model beginning from isolated nodes to being fully connected with vertices, there are a series of clique percolation. The transition point of a clique percolation is , which is of the same order of for different clique percolation with equal . The sequence of clique percolation in the ER model is as following:
a) clique percolation at , b) clique percolation at , c) clique percolation
at , d) clique percolation at ,
e) clique percolation at , f) clique percolation
at , g) clique percolation at , and so on.
Table 1: Summary of reduced transition points and critical exponents of clique percolation.
is obtained from Eq. 9 and the analytic result is given in Eq. 10. The results of clique percolation
are taken fromfanjingfang .
(k,l)
(2,1)
0.5006(7)
0.331(5)
0.334(2)
0.331(7)
0.334(3)
(3,1)
0.50(1)
0.32(2)
0.36(4)
0.37(2)
0.33(5)
(3,2)
0.34(2)
0.05(2)
0.03(2)
0.46(2)
0.50(2)
(4,1)
0.56(1)
0.33(1)
0.35(2)
0.38(2)
0.35(3)
(4,2)
0.40(1)
0.04(2)
0.03(2)
0.67(20)
0.52(4)
(4,3)
0.34(2)
0.01(1)
0.01(1)
0.49(4)
0.60(3)
(5,1)
0.60(1)
0.33(3)
0.38(4)
0.30(5)
0.37(6)
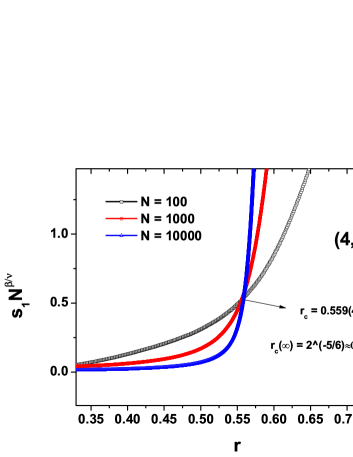
For comparison with the investigations above, we investigate directly the size of the largest clique community in a network to study general clique percolation. For a network with vertices and edges, the reduced size of the largest clique community is denoted as . Near the transition point of a clique percolation, we anticipate a finite-size scaling form
(17)
where and is the critical exponent of correlation length. In the limit , at
and at . Our previous investigations fan2012 ; liu2012 has confirmed the finite-size scaling form Eq. 17 for clique percolation.
At the transition point , and is independent of network size .
Using this property, we can determine the transition point of clique percolation from the fixed point of .
In Fig. 6, we plot of clique community as a function of for different . has been taken. We find a fixed point at , which agrees with obtained from network evolution. We expect that is equal to fanjingfang .
Figure 6: (color online) Scaling size of the largest clique community versus the reduced edge
number . We take . There is a fixed point at .
In summary, we introduce a clique community consisting of adjacent -cliques sharing at least vertices with . There is a clique percolation with the emergence of a giant clique community. We study the clique percolation by investigating the
largest reduced size gap of the largest clique community during network evolution and the corresponding evolution step .
If the average size gap , there is a continuous clique percolation for and a discontinuous clique percolation when . The reduced transition point obtained from has the finite-size effect . The values of obtained from Monte Carlo data agree with the analytic result of Eq. 5, which is derived using generating function method. The sequence of clique percolation in the ER model is as following: , and so on. The root-mean-squares of fluctuations and are found to decay algebraically as and . The fluctuation distribution functions follow the finite-size scaling forms and , respectively.
The universality of clique percolation is characterized by the critical exponents , , and .
It has been found that the critical exponents of clique percolation are independent of , but dependent on .
The universality class of clique percolation is characterized alone by .
Acknowledgements.
This work is supported by the National Natural Science Foundation
of China under grant 11121403.
References
(1)
M. Girvan and M. E. J. Newman,
Proc. Natl. Acad. Sci. USA 99, 7821 (2002).
(2)
S. Fortunato, Phys. Rep. 486, 75 (2010).
(3)
B. Bollobás,
Random graphs, 2nd ed.
(Cambridge University Press, Cambridge, 2001).
(4)
S. N. Dorogovtsev, A. V. Goltsev, and J. F. F. Mendes ,
Phys. Rev. Lett. 96, 040601 (2006).
(5)
G. Palla, I. Derényi, I. Farkas, and T. Vicsek,
Nature (London) 435, 814 (2005).
(6)
I. Derényi, G. Palla, and T. Vicsek,
Phys. Rev. Lett. 94, 160202 (2005).
(7)
P. Erdős and A. Rényi,
Publ. Math. Inst. Hung. Acad. Sci. 5, 17 (1960).
(8)
B. Bollobás and O. Riordan,
Random Structures & Algorithms. 35, 3 (2009)
(9)
M. E. J. Newman, S. H. Strogatz, and D. J. Watts,
Phys. Rev. E 64, 026118 (2001).
(10)
M. E. J. Newman,
Networks: an introduction,
(Oxford University Press, 2010), p. 445.
(11)
G, Palla, I. Derényi, and T. Vicsek,
J. Stat. Phys, 128, 1 (2007).
(12)
J.F. Fan, M.X. Liu, L.S. Li, and X.S. Chen, Phys. Rev. E 85, 061110 (2012).
(13)
M.X. Liu, J.F. Fan, L.S. Li, and X.S. Chen, Eur. Phys. J. B 85, 132 (2012).
(14)
Jingfang Fan, Maoxin Liu, Yong Zhu, and Xiaosong Chen,
Finite-size Scaling in Phase Transition of Network Evolution, to be submitted.
(15)
J. Nagler, A. Levina, and M. Timme, Nature Phys. 7, 265 (2011).