Revisiting Putative Cool Accretion Disks in Ultraluminous X-ray Sources
Abstract
Soft, potentially thermal spectral components observed in some ULXs can be fit with models for emission from cool, optically-thick accretion disks. If that description is correct, the low temperatures that are observed imply accretion onto “intermediate-mass” black holes. Subsequent work has found that these components may follow an inverse relationship between luminosity and temperature, implying a non–blackbody origin for this emission. We have re-analyzed numerous XMM-Newton spectra of extreme ULXs. Crucially, observations wherein the source fell on a chip gap were excluded owing to their uncertain flux calibration, and the neutral column density along the line of sight to a given source was jointly determined by multiple spectra. The luminosity of the soft component is found to be positively correlated with temperature, and to be broadly consistent with in the measured band pass, as per blackbody emission from a standard thin disk. These results are nominally consistent with accretion onto black holes with masses above the range currently known in Galactic X-ray binaries, though there are important caveats. Emission from inhomogeneous or super-Eddington disks may also be consistent with the data.
Subject headings:
accretion disks, black hole physics1. Introduction
Ultra-luminous X-ray sources (ULXs) are variable, off-nuclear X-ray sources in nearby galaxies, with luminosities in excess of (the Eddington luminosity of an black hole). Though they are luminous, most ULXs are likely familiar objects. The well-known source GRS 1915105, for instance, can by modestly super-Eddington for its mass, depending on the model and energy band considered. The vast majority of ULXs only exceed by a small margin (Swartz et al. 2011; for a recent review, see Feng & Soria 2011).
The small subset of ULXs with luminosities of and above are potentially more interesting, as they might be powered by accretion onto so-called “intermediate-mass” black holes (IMBHs), or an accretion flow that has genuinely defeated the isotropic Eddington limit. Of course, this small sub-class could be a combination of these two phenomena. An alternative possibility is that the emission from such sources is actually anisotropic, perhaps owing to a “funnel” in the inner accretion disk (King et al. 2001).
XMM-Newton has revolutionized studies of ULXs, making it possible to obtain spectra that require multiple components. Early efforts to decompose the best ULX spectra found evidence of separate soft and hard components. The soft components could be fit with disk models, and low temperatures obtained – generally 0.2–0.3 keV – provided some evidence of accretion onto IMBHs since and keV is typical for accretion onto stellar-mass black holes close to the Eddington limit (e.g. Miller et al. 2003; Miller, Fabian, & Miller 2004). This spectral decomposition is based on a close analogy with better-known X-ray binaries and may not be unique nor appropriate for ULXs. However, subsequent studies of soft component variability found that these would-be disks may not be blackbody-like (Kajava & Poutanen 2009; Feng & Kaaret 2007, 2009; also see Soria 2007). Other recent work has discovered a spectral roll-over above the Fe K band (Gladstone, Roberts, & Done 2009). This can be interpreted as evidence of super-Eddington accretion, though the spectra still require independent soft components with low characteristic temperatures. In this work, we examine the nature of the best ULX spectra from nearby sources with , factoring in recent studies that impact the possibility of winds and variable absorption.
2. Sample and Data Reduction
We considered the sample of nearby erg/s sources observed with XMM-Newton and reported in Miller, Fabian, & Miller (2004), Gladstone, Roberts, & Done (2009), and Kajava & Poutanen (2009). ULXs at distances greater than 5 Mpc were not considered owing to their reduced photon flux. Of the remaining sources, NGC 1313 X-2 was not considered as any evidence that it exceeds erg/s appears weak and highly model–dependent, and evidence for a cool disk component is only marginal (e.g. Miller et al. 2003). IC 342 X-1 – which is near to erg/s – was excluded owing to the modest significance of a putative cool component. In exploratory fits, the column density along the line of sight to IC 342 X-1 fell in the range, greatly complicating the detection of keV emission. With these constraints, our sample includes Holmberg IX X-1, NGC 1313 X-1, Ho II X-1, NGC 5408 X-1, and NGC 5204 X-1. All archival XMM-Newton observations of these sources were downloaded and reduced using SAS version 12.0.1.
The EPIC-pn camera has the highest collecting area across the full 0.3–10.0 keV band, and is best calibrated for spectral fitting. For simplicity and self-consistency, our analysis was restricted to spectra obtained using the EPIC-pn camera. Unlike Chandra, XMM-Newton does not dither, and when a source lands within the gap between chips in EPIC cameras, its effective exposure and encircled energy fraction can be affected, ultimately compromising flux estimates. Observations wherein the source image fell within chip gaps were therefore rejected, in order to ensure robust flux determinations.
Background regions were extracted on the same CCD as the source, and generally using an extraction region of the same size. The background regions were analyzed to identify periods of background flaring, and to create a GTI file to exclude these intervals when extracting events for spectral analysis. Spectra, backgrounds, and responses were then calculated using the appropriate tools. All spectra were grouped to require at least 25 counts per bin using the FTOOL “grppha”, in order to ensure the validity of statistical tests.
3. Analysis and Results
All spectra were fit using XSPEC version 12.2 (Arnaud et al. 1996). Neutral interstellar absorption was fit using the “tbabs” model. As required by “tbabs”, the “vern” atomic cross-sections and “wilm” elemental abundances were used. The Milky Way’s contributions to the total neutral column density along these lines of sight are small, and we therefore used a single “tbabs” component to account for both Galactic absorption and the column within each ULX host galaxy. Solar abundances were assumed in all fits (but see the Discussion).
The spectral resolution afforded by dispersive spectrometers has recently been leveraged to address the extent to which absorption may drive spectral evolution in accreting systems (Miller, Cackett, & Reis 2009). The depth of individual photoelectric absorption edges remains remarkably constant across a broad range in luminosity in low-mass X-ray binaries, in binaries with potential “intermediate-mass” stars such as Cygnus X-2, and even in Cygnus X-1 (which accretes from an O 9.7 Iab supergiant). This argues that the line of sight column density should be held constant in spectral fits. Current limits on Fe K emission and absorption lines in ULXs are commensurate with detections in Galactic X-ray binaries, and far below expections if line strengths scale with the mass accretion rate (Walton et al. 2012, 2013). We therefore fit all EPIC-pn spectra of a given ULX jointly, such that the interstellar column density was jointly determined and had a common value for every spectrum.
For simplicity, we chose to fit the soft, potentially thermal components with the well-known “diskbb” model (Mitsuda et al. 1984). To characterize the hard flux in each ULX spectrum, we used the “compTT” model (Titarchuk 1994). The use of “compTT” is important for characterizing the turn–over seen in the 6–10 keV band in many sensitive spectra of ULXs with erg/s (e.g. Gladstone et al. 2009; Walton et al. 2013). It produced statistically superior fits to simple power-law models for the hard flux. The temperature of the low-energy thermal distribution was linked to that of the disk component. The other crucial parameters within “compTT”, the electron temperature and the optical depth were allowed to vary. However, few spectra are able to constrain both parameters, and in those cases a value of keV was adopted. This value is broadly consistent with the spectra where constraints were possible, and also broadly consistent with the values reported in fits with “compTT” reported by Gladstone et al. (2009) and Feng & Kaaret (2009).
An additional diffuse emission component is present in the spectra of NGC 5408 X-1, likely due to local warm gas and star formation. Emission localized around 1 keV can be modeled with a “mekal” plasma with keV and a normalization of . These values were determined through joint fits. This correctly accounts for diffuse emission with a constant flux.
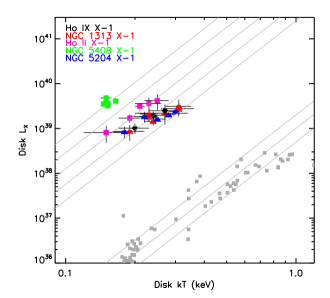
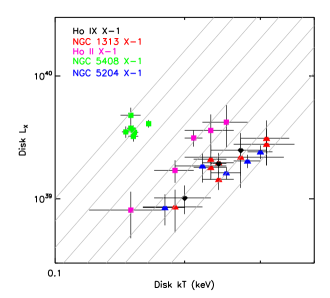
The results of our spectral fits are given in Table 1. The procedure of jointly determining the column density is clearly one that allows for excellent fits. In all cases, the joint fit returns a reduced statistic that is close to unity. The use of the “compTT” component with a turn-over above the Fe K band also contributed to the excellent fits. Figure 1 plots the X-ray luminosity measured in the putative disk components, versus their color temperature values. Both in Table 1 and Figure 1, the luminosity is restricted to the band in which the flux was actually observed (0.3–10.0 keV).
Figure 1 also plots the relationship expected for simple blackbody emission, with a number of different normalizations. It is immediately apparent that the ULX putative disk components show a clear, positive relationship between luminosity and temperature that is qualitatively consistent with . (Note that band pass effects can be important in effective luminosity versus temperature relationships; it is possible that may be anticipated for very cool disks measured in the 0.3–10.0 keV band.) The lone exception is NGC 5408 X-1; the points from that source are tightly clustered.
In order to quantify the apparent relationships, we ran statistical correlation tests on the data from each individual source, and also made simple least-squares fits to determine the slope of the data. The results of these tests and fits are listed in Table 2. Errors on both luminosity and temperature were considered in fitting the data and estimating errors on the slope. Strong positive correlations are confirmed in each source, apart from NGC 5408 X-1. The data from Ho IX X-1 and Ho II X-1 are formally consistent with , and the slope of NGC 1313 X-1 is consistent within 1.5. The slope of NGC 5204 X-1 is somewhat flatter. The best traces of versus in stellar-mass black hole disks – made using Swift, spanning three orders of magnitude in , and also obtained using “diskbb” and “compTT” continuum components – find more shallow slopes, e.g. (Rykoff et al. 2007, also see Reynolds & Miller 2013, Salvesen et al. 2013).
The errors on the slopes listed in Table 2 are large owing to the small number of points available. Similarly, the strongest correlations are only significant at the 99% level of confidence. However, taken literally, the data would suggest that the putative cool thermal disk components in this small subset of extreme ULXs may indeed represent disk emission. Since disk tempertures this low are only seen in stellar-mass black holes at or below , the results would nominally indicate accretion onto more massive black holes, since for black hole accretion.
4. Discussion and Conclusions
We have examined the relationship between the color temperature of putative cool, thermal components versus their luminosity, in the 0.3–10.0 keV spectra of ULXs with erg/s. We find evidence of positive correlations between the luminosity of these putative disk components, and their color temperature. In the observed band, some temperature and luminosity trends are formally consistent with the relationship expected for simple blackbody emission from a standard thin accretion disk. In all but one source, the data are consistent with a slightly flatter relationship that is observed in stellar-mass black holes in the same band (e.g. , Rykoff et al. 2007; also see Reynolds & Miller 2013, Salvesen et al. 2013). The lone exception is NGC 5408 X-1, for which the data span a very small range in luminosity and temperature, and thus no trend can be discerned. Taken literally, these results may support an interpretation of these components as emission from cool accretion disks around intermediate-mass black holes. We therefore proceed to make a critical examination of our methods and assumptions in this section.
As noted previously, some recent work has found putative disk luminosity and temperature to be anti–correlated when fitting ULX spectra with disk components at low energy (e.g. Feng & Kaaret 2007, 2009; Kajava & Poutanen 2009). Our analysis employed a more restrictive selection criterion, in that observations wherein the source image landed on a chip gap were excluded. Observations with spurious or uncertain flux measurements are therefore omitted. Moreover, the correlation we have found is specific: the disk luminosity and the disk temperature are positively correlated. We do not find strong correlations between total luminosity and disk temperature. Though coronae and disks must be linked, the need for magnetic processes (see, e.g., Merloni & Fabian 2002) means that the luminosity of these components can be decoupled at times.
Our analysis also differs from prior efforts in that the column density along the line of sight to a given source was jointly determined by the numerous spectra, and not allowed to vary between them. It is possible that this method is faulty, especially if ULXs are fueled by massive stars with variable, clumpy winds. However, existing data appear to justify our assumptions and fitting methods:
First, grating spectra of even Cygnus X-1 find a consistent column across the binary phase, except perhaps when the O star is closest to our line of sight (Miller, Cackett, & Reis 2009). Second, existing spectra of NGC 1313 X-1 and Holberg IX X-1 now place extremely restrictive limits on emission and absorption features in these sources (Walton et al. 2013). Any emission lines must have lower equivalent widths than the lines seen in Galactic X-ray binaries with massive companions. This indicates that companion winds are largely absent or very highly ionized. Either way, companion winds are unlikely to contribute to an evolving neutral column density. Limits on absorption lines are also below those detected from disk winds in stellar-mass black holes and many AGN, again limiting the scope for variable absorption (Walton et al. 2012, 2013; Pasham & Strohmayer 2013). Last, where dips are detected in ULXs (e.g. NGC 5408 X-1, Grise et al. 2013), they are apparently quasi–periodic (Pasham & Strohmayer 2013), and thus inconsistent with clumps in a companion wind. Dips in Cygnus X-1 are clustered at and , with those at likely due to the accretion stream impacting the outer disk; dips owing to clumps in the companion wind appear to be spread randomly in phase (Balucinksa-Church et al. 2000). And, as noted previously, even in Cygnus X-1, the optical depth in various edges is remarkably constant (e.g. Miller, Cackett, & Reis 2009).
In our treatment of the neutral column, we also assumed solar abundances for all elements. Some studies of the dwarfs in this sample (in particular) have reported sub–solar metallicity values in the ISM of those galaxies (e.g. Guseva et al. 2011, Egorov, Lozinskaya, & Moiseev 2013), and caution is warranted. Fits to the best X-ray spectra, however – including gratings spectra obtained with the RGS – find abundances consistent with solar (Winter, Mushotzky, & Reynolds 2007; Pintore & Zampieri 2012). The same effect is found in our data: if the absorption model for Ho II X-1 in Table 1 is altered so that the metal abundances are only 10% of solar, a significantly worse fit is achieved (). The same effect holds for the large spiral NGC 1313 (). Such results are not driven by contributions from the Galactic column; in all cases, the Galactic column (as estimated by Dickey & Lockman 1990) is only a fraction of that measured. Moreover, it is important to remember a basic facet of the observed absorption edge features: one can trade intrinsic column density and abundance, but their product has to match the observed edge depth. Shifting abundance values will affect all spectra from a given source in the same manner.
The spectral model we employed also has difficulties. The “comptt” model includes thermal emission, and it therefore competes with the external “diskbb” component for the soft X-ray flux. In this sense, it is not perfectly self-consistent. However, “comptt” is required to describe the roll-over in the 5–10 keV band (e.g. Gladstone, Roberts, & Done 2009), and this is now a standard model. Alternative Comptonization treatments, such as “simpl”, only produce a power-law and thus miss the observed roll-over. For the fits presented in Table 1, the additional soft component is required by the data at extremely high statistical significance.
There are important caveats, but our results nominally support the possibility that soft components in ULX spectra represent emission from standard accretion disks extending to the ISCO. It is possible to derive some simple mass estimates by scaling from stellar-mass black holes: , where is the disk temperature typical for stellar-mass black holes in X-ray binaries close to the Eddington limit (or, in a state analogous to that in which ULXs accrete). If we take keV, , keV, then a mass of is implied. However, not all transients that cycle through each of the canonical spectral states are observed to have maximum temperatures of keV. XTE J1650500, for instance, had a maximum temperature of keV (e.g. Reis et al. 2013). For keV, , and keV, a more modest mass of is implied. Clearly, the mass estimate is strongly dependent upon the “typical” temperature of a standard X-ray binary disk at Eddington.
These mass estimates are simplified. There is no certainty that ULXs radiate at Eddington. Moreover, the data allow for flatter relationships between luminosity and temperature, potentially suggestive of a changing disk radius. In this circumstance, and in situations where the coronal energy drains the disk, mass estimates are more complex, and generally imply lower masses (, Soria 2007). The putative cool disk components in our models only emit a fraction of their luminosity in the observed (0.3–10.0 keV) band. However, these disks would dominate the source luminosity in the 0.01–10.0 keV band, and would then be more analogous with the disk–dominated “high/soft”states seen in stellar-mass black holes. Depending on numerous details, the slopes measured when considering bolometric disk luminosity versus temperature may be 0.5–1.0 flatter than the values reported in Table 2. This effect is within the error ranges quoted in the existing fits, and assumes that the spectral model can safely be extrapolated to lower energy values.
It is possible that the observed temperatures and flux trends could represent emission from a locally–inhomogeneous disk, although the observed temperature contrast is slightly greater than that envisioned in current treatments (e.g. Dexter & Quataert 2012). It is also possible that the putative cool disk components we have studied do not originate close to the black hole, but rather outside of some transition radius, with an hot, inner, super-Eddington disk represented by the Comptonized component. In this scenario, however, considerable fine–tuning would likely be required for the different sources and transition radii to create the observed temperatures and trends. Future monitoring campaigns aimed at improved traces of soft component variability, and very deep observations that search for the outflows expected in super-Eddington regimes, may help to better understand this subset of ULXs.
References
- (1)
- (2) Balucinska-Church, M., Church, M. J., Charles, P. A., Nagase, F., LaSala, J., Barnard, R., 2000, MNRAS, 311, 861
- (3)
- (4) Cseh, D., Corbel, S., Kaaret, P., Lang, C., Grise, F., Paragi, Z., Tzioumis, T., Tudose, V., Feng, H., 2012, ApJ, 749, 17
- (5)
- (6) Dexter, J., & Quataert, E., 2012, MNRAS, 426, L17
- (7)
- (8) Dickey, J. M., & Lockman, F. J., 1990, ARA&A, 28, 215
- (9)
- (10) Egorov, O. V., Lozinskaya, T. A., Moiseev, A. V., 2013, MNRAS, 429, 1450
- (11)
- (12) Feng, H., & Kaaret, P., 2007, ApJ, 660, L113
- (13)
- (14) Feng, H., & Kaaret, P., 2009, ApJ, 696, 1712
- (15)
- (16) Feng, H., & Soria, R., 2011, NewAR, 55, 166
- (17)
- (18) Frail, D., Kulkarni, S. R., Berger, E., Wierina, M. H., 2003, AJ, 125, 2299
- (19)
- (20) Gladstone, J. C., Roberts, T. P., & Done, C., 2009, MNRAS, 387, 1836
- (21)
- (22) Grise, F., Kaaret, P., Corbel, S., Cseh, D., & Feng, H., 2013, MNRAS, in press
- (23)
- (24) Guseva, N. G., Izotov, Y, I., Stasinska, G., Fricke, K. J., Henkel, C., Papaderos, P., 2011, A&A, 529, 149
- (25)
- (26) Hannikainen, D., Campbell-Wilson, D., Hunstead, R., McIntyre, V., Lovell, J., Reynolds, J., Tzioumis, T., Wu, K., 2001, ApSSS, 276, 45
- (27)
- (28) Kaaret, P., & Corbel, S., 2009, ApJ, 697, 950
- (29)
- (30) Kajava, J. J. E., & Poutanen, J., 2009, MNRAS, 398, 1450
- (31)
- (32) Karachentsev, I. D., et al., 2002, A&A, 385, 21
- (33)
- (34) King, A. R., Davies, M. B., Ward, M. J., Fabbiano, G., & Elvis, M., 2001, ApJ, 552, L109
- (35)
- (36) Mapelli, M., Ripamonti, E., Zampieri, L., Colpi, M., & Bressan, A., 2010, MNRAS, 408, 234
- (37)
- (38) Merloni, A., & Fabian, A. C., 2001, MNRAS, 321, 549
- (39)
- (40) Middleton, M. J., Roberts, T. P., Done, C., & Jackson, F. E., 2011, MNRAS, 411, 644
- (41)
- (42) Miller, J. M., Fabbiano, G., Miller, M. C., Fabian, A. C., 2003, ApJ, 585, L37
- (43)
- (44) Miller, J. M., Fabian, A. C., & Miller, M. C., 2004, ApJ, 614, L117
- (45)
- (46) Miller, J. M., Cackett, E. M., & Reis, R. C., 2009, ApJ, 707, L77
- (47)
- (48) Pakull, M. W., & Mirioni, L., 2002, arxiv:astro-ph/0202488
- (49)
- (50) Pasham, D. R., & Strohmayer, T. E., 2013, ApJ, 764, 93
- (51)
- (52) Paturel, G., Theureau, G., Fouque, P., Terry, J. N., Musella, I., Ekholm, T., 2002, A&A, 383, 398
- (53)
- (54) Pintore, F., & Zampieri, L., 2012, MNRAS, 420, 1107
- (55)
- (56) Reis, R. C., Miller, J. M., Reynolds, M. T., Gultekin, K., Maitra, D., King, A. L., & Strohmayer, T. E., 2012, Science, 337, 949
- (57)
- (58) Reis, R. C., Miller J. M., Reynolds, M. T., Fabian, A. C., Walton, D. J., Cackett, E., Steiner, J. F., 2013, ApJ, 736, 48
- (59)
- (60) Reynolds, M. T., & Miller, J. M., 2013, ApJ, 769, 16
- (61)
- (62) Rykoff, E. S., Miller, J. M., Steeghs, D., & Torres, M. A. P., 2007, ApJ, 666, 1129
- (63)
- (64) Salvesen, G., Miller, J. M., Reis, R. C., Begelman, M. C., 2013, MNRAS, in press
- (65)
- (66) Soria, R., 2007, Ap&SS, 311, 213
- (67)
- (68) Strohmayer, T. E., & Mushotzky, R. F., 2003, ApJ, 586, L61
- (69)
- (70) Strohmayer, T. E., & Mushotzky, R. F., 2009, ApJ, 703, 1386
- (71)
- (72) Swartz, D. A., Soria, R., Tennant, A. F., & Yukita, M., 2011, ApJ, 741, 49
- (73)
- (74) Titarchuk, L., 1994, ApJ, 434, 570
- (75)
- (76) Tully, R. B., 1998, Neary Galaxies Catalog, Cambridge University Press, Cambridge
- (77)
- (78) Webb, N., et al., 2012, Science, 337, 554
- (79)
- (80) Walton, D. J., Miller, J. M., Reis, R. C., Fabian, A. C., 2012, MNRAS, 426, 473
- (81)
- (82) Walton, D. J., Miller, J. M., Harrison, F. A., Fabian, A. C., Roberts, T. P., Middleton, M. J., Reis, R. C., 2013, ApJ, 773, L9
- (83)
- (84) Winter, L. M., Mushotzky, R. F., & Reynolds, C. S., 2007, ApJ, 655, 163
- (85)
| Source | ObsID | Norm. | Norm | |||||||
| () | (keV) | (keV) | () | () | () | |||||
| Ho IX X-1 | 0112521001 | 0.157(7) | 0.27(4) | 20(7) | 2.8(5) | 7.2(9) | 7.6(9) | 1.3(5) | 2.5(9) | 2139.9/2140 |
| 0112521101 | 0.20(3) | 28(6) | 5.7(2) | 4.4(2) | 6.1(4) | 1.4(4) | 1.0(3) | |||
| 0200980101 | 0.24(1) | 26(2) | 2.45(8) | 8.9(3) | 7.2(2) | 1.1(1) | 1.9(2) | |||
| NGC 1313 X-1 | 0106860101 | 0.272(8) | 0.24(2) | 28(5) | 2.3(3) | 8.5(7) | 4.2(3) | 0.6(1) | 2.0(4) | 2513.8/ 2398 |
| 0150280201 | 0.24(2) | 19(3) | 2.0 | 10(3) | 6(3) | 0.5(1) | 1.4(3) | |||
| 0150280601 | 0.31(4) | 16(6) | 2.0 | 7.5(5) | 7(1) | 0.9(3) | 3(1) | |||
| 0150281101 | 0.27(7) | 17(6) | 2.0 | 6.6(3) | 10(4) | 0.9(3) | 2(1) | |||
| 0205230201 | 0.31(5) | 14(4) | 2.0 | 9(1) | 4(1) | 0.7(2) | 2.8(9) | |||
| 0205230401 | 0.19(3) | 32(9) | 2.0 | 4.2(2) | 10(3) | 0.5(1) | 0.8(3) | |||
| 0205230601 | 0.23(3) | 32(9) | 2.0 | 8.7(4) | 5.4(5) | 0.7(2) | 2.1(5) | |||
| 0405090101 | 0.23(2) | 27(5) | 2.2(2) | 8.5(5) | 4.3(1) | 0.6(1) | 1.8(3) | |||
| Ho II X-1 | 0112520601 | 0.080(3) | 0.25(3) | 70(25) | 2.0 | 5.9(3) | 12(3) | 1.1(4) | 4(2) | 2033.6/1990 |
| 0112520701 | 0.23(3) | 60(20) | 2.0 | 6.6(3) | 11(3) | 1.0(4) | 4(1) | |||
| 0112520901 | 0.15(3) | 140(50) | 2.0 | 4.8(3) | 6(3) | 0.3(1) | 0.8(3) | |||
| 0200470101 | 0.21(1) | 85(12) | 2.7 | 4.6(6) | 13(1) | 1.2(2) | 3.1(5) | |||
| 0561580401 | 0.19(2) | 84(15) | 2.0 | 5.6(3) | 6.4(6) | 0.46(9) | 1.7(4) | |||
| NGC 5408 X-1 | 0112290501 | 0.105(3)3 | 0.150(8) | 350(50) | 2.0 | 5.0(3) | 6(1) | 1.0(2) | 4.8(7) | 3686.4/3551 |
| 0302900101 | 0.165(3) | 177(12) | 2.0 | 5.1(2) | 4.1(3) | 0.72(7) | 4.1(3) | |||
| 0500750101 | 0.152(4) | 220(20) | 2.0 | 5.57(9) | 4.9(3) | 0.67(7) | 3.2(3) | |||
| 0653380201 | 0.150(3) | 280(20) | 2.0 | 5.5(1) | 6.5(3) | 0.83(7) | 3.8(3) | |||
| 0653380301 | 0.146(3) | 290(30) | 2.0 | 5.30(5) | 6.9(4) | 0.8(1) | 3.5(4) | |||
| 0653380401 | 0.152(3) | 242(22) | 2.0 | 5.42(6) | 5.7(3) | 0.78(8) | 3.6(4) | |||
| 0653380501 | 0.153(3) | 220(20) | 2.0 | 5.58(6) | 5.5(2) | 0.75(7) | 3.5(3) | |||
| NGC 5204 X-1 | 0142770101 | 0.049(4) | 0.18(2) | 27(7) | 2.0 | 7.6(3) | 3.2(5) | 0.4(1) | 0.9(2) | 1634.4/1601 |
| 0142770301 | 0.28(2) | 9.0(9) | 2.0 | 8.1(8) | 2.3(4) | 0.5(1) | 2.0(3) | |||
| 0405690101 | 0.21(3) | 27(6) | 2.0 | 5.8(3) | 6(1) | 0.7(2) | 1.8(5) | |||
| 0405690201 | 0.30(2) | 9(1) | 2.0 | 6.8(3) | 2.8(4) | 0.6(1) | 2.4(3) | |||
| 0405690501 | 0.25(2) | 12(1) | 2.0 | 7.7(3) | 2.7(3) | 0.47(7) | 1.6(2) |
| Source | index | ||||
|---|---|---|---|---|---|
| Ho IX X-1 | 1.0 | 0.0 | 1.0 | 0.117 | |
| Ho II X-1 | 1.0 | 0.0 | 1.0 | 0.014 | |
| NGC 1313 X-1 | 0.84 | 0.0096 | 0.718 | 0.0129 | |
| NGC 5408 X-1 | -0.09 | 0.846 | -0.05 | 0.8745 | |
| NGC 5204 X-1 | 0.9 | 0.037 | 0.8 | 0.05 |