Pitch angle variations in spiral galaxies
Abstract
We present a detailed photometric study and measurements of spiral arm pitch angles for a sample of 50 non-barred or weakly barred grand-design spiral galaxies selected from Sloan Digital Sky Survey. In order to find pitch angles, we used a new method based on the window Fourier analysis of their images. This method allows us not only to infer the average pitch angle, but to obtain its value as a function of galactocentric radius as well. Our main results are as follows:
(1) Spiral arms of most galaxies cannot be described by a single value of the pitch angle. About 2/3 of galaxies demonstrate pitch angle variations exceeding 20%. In most galaxies in the sample their pitch angle decreases by increasing the distance from the centre.
(2) Pitch angle variations correlate with the properties of galaxies – with the shape of the surface brightness distribution (envelope-type or truncated disc), and with the sign of stellar disc colour gradient.
(3) More luminous and bright bulges produce more tightly wound spiral arms, that is in agreement with current models for spiral arms formation.
keywords:
methods: data analysis – galaxies: photometry – galaxies: structure.1 Introduction
Spiral patterns are the most prominent features of disc galaxies. Spiral arm shape (among other parameters of galaxies) changes along the Hubble sequence. Disc galaxies of early Hubble types have tightly wounded spiral arms, while ones of later types have more wide open spiral structure.
The degree of tightness of the spiral structure is described by the pitch angle. The pitch angle is the angle between the tangent to spiral arm and the perpendicular to the radius-vector drawn from the centre of the galaxy (e.g., Binney & Tremaine 1987).
Usually, for obtaining the pitch angle value, spiral arm is described by some model (for example, logarithmic, archimedean or hyperbolic spiral). This model makes limitations on how the value of the pitch angle can vary with the distance from the galaxy centre. For example, in the case of logarithmic spiral (which is the most commonly used for representation of spiral structure) the pitch angle does not change with distance at all. Other models, however, can show different behaviour of the pitch angle. Thus, the value of the pitch angle of archimedean spiral decreases with the distance, whereas for hyperbolic spiral it increases.
Real galaxies, however, can show more various behaviour of the pitch angle than the models listed above (see discussion in Ringermacher & Mead 2009). It explains uncertainty in selection of the model for spiral pattern approximation: while most authors choose logarithmic spirals (e.g., Ma 2001, Seigar et al. 2008), some use archimedean (Karachentsev & Karachentseva 1967) and hyperbolic (Kennicutt 1981) spirals, or even more complicated models (Ringermacher & Mead 2009).
It is possible to obtain the pitch angle value as a function of a distance from the galactic centre by fitting different parts of the spiral structure separately (e.g., Russell & Roberts 1992, Russell & Roberts 1993) or by using two-dimensional Fourier analysis of a spiral pattern (Savchenko 2012). In this case the shape of the spiral structure is represented by a set of angles of tangents rather than by a formula with fixed parameters, and the pitch angle value does not obey the specific model.
The correlation between the galactic central mass concentration and the pitch angle is predicted by current models for spiral arms formation (see detailed discussion in Grand et al. 2013, Berrier et al. 2013). Recent observations suggest that there is a link between the tightness of spiral structure and the shear rate of differentially rotating discs of spiral galaxies (Seigar et al. 2005, Seigar et al. 2006). Since the shear rate is determined by the mass distribution, this correlation probably reflects a correlation between the mass of central region and spiral arm pitch angle.
Shear rate is an indirect measurement of the central mass concentration. It is important to check pieces of independent evidence – for instance, does the pitch angle correlates with the total bulge mass (or luminosity) or with other parameters of the galaxies?
In this work, we present measurements of the pitch angle values and their radial variations in a sample of grand-design galaxies selected from Sloan Digital Sky Survey (SDSS). Special attention was paid to the comparison of the spiral pattern characteristics with general photometric parameters of galaxies (their bulges and discs) in order to check possible mutual correlations.
The structure of the paper is as follows: in Section 2, we outline our sample; in Section, 3 we describe our methods; results are presented in Section 4, and Section 5 contains our main findings.
2 The sample
The study of the pitch angle variations requires a sample of galaxies with a prominent, well shaped spiral structure, which can be traced for considerable distance from the centre of the galaxy.
The selection of objects for our sample was mainly based on the EFIGI (Extraction de Formes Idealisées de Galaxies en Imagerie, de Lapparent, Baillard & Bertin 2011) catalogue, which contains morphological parameters of 4458 galaxies. This allows us to create a primary sample by constraining some of these parameters.
An automatic estimate of properties of the spiral structure requires galaxies with high contrast and regular spiral pattern without significant contamination by foreground objects. Thus, we have constrained arm strength, perturbation, flocculence values to get better looking galaxies. The gravitational interaction between galaxies leads to distortion of spiral pattern, so the multiplicity parameter has to be equal to zero.
Another one constraining criteria for our sample is the inclination angle. We were interested in galaxies with intermediate values of inclination angle (about –) only. More inclined galaxies have too big distortions due to the projection effects, whereas ones with less inclination cannot be processed by Poltorak–Freedman Monotony of Spiral Arms (MSA) algorithm (see below).
EFIGI parameters are rough, so the final selection was made by eye. At this stage, we have also rejected galaxies with more than two spiral arms.
Our final sample consists of 50 galaxies with two large-scale spiral arms. The galaxies of our sample are mostly without or with insignificant bars, although some galaxies have prominent bars (e.g. PGC 23028 and PGC 22596). Table 1 summarizes the main characteristics of the galaxies. The columns of the table are:
-
(1)
PGC – number according to the Principal General Catalogue;
-
(2)
Type – morphological type according to HyperLeda111http://leda.univ-lyon1.fr (Paturel et al. 2003);
-
(3)
– absolute luminosity in the filter (based on apparent magnitude from SDSS and luminosity distance and galactic absorption from NED222http://ned.ipac.caltech.edu);
-
(4)
– inclination in degrees ( for face-on galaxy), see Section 2.2;
-
(5)
– maximum rotational velocity (from HyperLeda vmaxg parameter), corrected for our inclination ;
-
(6)
– bulge central surface brightness in g band (this one and the next five parameters see in Section 2.3);
-
(7)
– effective radius of a bulge in g band;
-
(8)
– Sérsic index of a bulge in g band;
-
(9)
– central surface brightness of an inner disc in g band;
-
(10)
– exponential scale of an inner disc in g band;
-
(11)
– central surface brightness of an outer disc in g band;
-
(12)
– exponential scale of an outer disc in g band;
-
(13)
– bulge-to-total luminosity ratio in g band;
-
(14)
– mean pitch angle in degrees in g band. Footnotes show values of the pitch angle measured by other authors. Although our sample has very little intersection with samples of other authors, some galaxies have one or more published estimates of the pitch angle;
-
(15)
– amplitude of pitch angle variation to mean pitch angle ratio in g band (see Sect. 3).
| PGC | Type | |||||||||||||
| m | ′′ | ′′ | ′′ | |||||||||||
| 1909 | SBbc | -19.37 | 63 | 150 | — | — | — | 19.42 | 7.8 | 20.14 | 10.2 | 0.00 | 17.3 | 0.69 |
| 2182 | Sbc | -20.76 | 42 | 208 | 17.38 | 2.4 | 1.62 | 21.61 | 21.6 | 19.99 | 10.2 | 0.08 | 11.9 | 0.73 |
| 10559 | SABa | -21.26 | 55 | 203 | 19.29 | 1.8 | 0.39 | 19.32 | 7.2 | 21.21 | 15.0 | 0.05 | 10.1 | 0.15 |
| 13535 | SABc | -20.29 | 57 | 137 | 19.36 | 9.0 | 1.55 | 22.42 | 37.8 | 21.20 | 17.4 | 0.15 | 12.6 | 0.40 |
| 21475 | Sc | -19.47 | 60 | 144 | 21.05 | 1.8 | 0.6 | 20.79 | 13.2 | 18.73 | 8.4 | 0.00 | 14.1 | 0.30 |
| 22596 | SBb | -20.68 | 59 | 175 | 18.12 | 1.8 | 0.59 | 20.21 | 13.2 | 19.11 | 9.6 | 0.06 | 19.4 | 0.36 |
| 23028 | Sb | -19.60 | 54 | 168 | 16.82 | 8.4 | 2.39 | — | — | 19.35 | 13.2 | 0.11 | 0.32 | |
| 23337 | SABa | -20.71 | 44 | 265 | 13.9 | 4.2 | 3.05 | 22.41 | 71.4 | 21.20 | 16.2 | 0.31 | 10.6 | 0.17 |
| 24423 | SBb | -19.52 | 45 | — | 20.4 | 5.4 | 1.38 | 22.20 | 35.4 | 21.32 | 10.8 | 0.09 | 20.5 | 0.25 |
| 26528 | Sb | -20.53 | 69 | 243 | 20.96 | 1.8 | 0.26 | 20.67 | 10.2 | 18.51 | 5.4 | 0.01 | 19.2 | 0.37 |
| 27121 | Sbc | -20.94 | 47 | 235 | 18.57 | 4.2 | 1.38 | 20.69 | 8.4 | 22.27 | 16.8 | 0.25 | 10.4 | 0.11 |
| 30694 | Sbc | -20.43 | 50 | 193 | 19.73 | 3.0 | 1.38 | 21.20 | 12.0 | 18.61 | 6.0 | 0.02 | 17.1 | 0.13 |
| 31883 | Sc | -18.99 | 59 | 182 | 15.81 | 23.4 | 3.4 | 21.36 | 80.4 | 21.02 | 47.4 | 0.12 | 0.07 | |
| 31917 | SABb | -21.85 | 58 | 358 | 20.77 | 3.0 | 0.45 | 20.95 | 15.0 | 19.79 | 7.8 | 0.05 | 11.7 | 0.44 |
| 32831 | Sb | -20.46 | 54 | — | 19.26 | 2.4 | 0.84 | 20.60 | 6.6 | 21.74 | 12.0 | 0.15 | 10.7 | 0.30 |
| 33040 | Sab | -20.95 | 34 | 227 | 12.8 | 1.8 | 3.58 | 20.41 | 7.2 | 21.22 | 11.4 | 0.13 | 8.9 | 0.44 |
| 33719 | SABb | -21.07 | 54 | — | 18.62 | 3.0 | 0.95 | 21.30 | 12.6 | 20.19 | 8.4 | 0.16 | 10.3 | 0.53 |
| 34599 | SBb | -21.46 | 49 | 295 | 21.27 | 1.8 | 0.56 | 20.73 | 10.2 | 16.89 | 3.6 | 0.00 | 17.3 | 0.22 |
| 35952 | SABb | -19.47 | 54 | 145 | 13.57 | 1.2 | 2.91 | 21.29 | 18.6 | 19.82 | 9.0 | 0.05 | 17.3 | 0.06 |
| 38024 | Sbc | -21.13 | 46 | 198 | 20.07 | 3.0 | 0.55 | 21.12 | 15.0 | 22.01 | 22.8 | 0.07 | 0.17 | |
| 38885 | SABa | -18.47 | 54 | 138 | 20.05 | 4.2 | 0.88 | 21.95 | 61.2 | 20.34 | 10.8 | 0.07 | 14.8 | 0.12 |
| 38916 | Sbc | -19.41 | 56 | 135 | 21.15 | 3.0 | 0.37 | 21.39 | 26.8 | — | — | 0.01 | 14.2 | 0.09 |
| 39038 | Sab | -21.45 | 56 | 222 | — | — | — | 20.96 | 6.9 | — | — | 0.00 | 18.1 | 0.04 |
| 39479 | Sc | -20.39 | 54 | 200 | 20.46 | 4.2 | 1.03 | 21.50 | 49.2 | 20.94 | 21.0 | 0.02 | 14.3 | 0.13 |
| 39775 | Sbc | -19.80 | 60 | 186 | 20.33 | 2.4 | 0.51 | 20.55 | 13.2 | 21.74 | 21.6 | 0.03 | 15.9 | 0.32 |
| 39793 | SBc | -21.42 | 48 | 229 | 21.53 | 1.8 | 0.43 | 20.89 | 7.8 | 19.09 | 4.2 | 0.01 | 17.5 | 0.38 |
| 40030 | Sa | -19.36 | 61 | — | 18.94 | 3.6 | 0.8 | 20.98 | 26.4 | 20.68 | 19.2 | 0.08 | 10.9 | 0.09 |
| 41244 | S0-a | -20.02 | 63 | 200 | 19.75 | 3.6 | 0.71 | 21.37 | 9.0 | 22.43 | 16.8 | 0.20 | 11.8 | 0.47 |
| 42847 | SABc | -19.67 | 45 | 133 | 20.19 | 4.2 | 0.91 | 21.18 | 26.4 | 22.20 | 38.4 | 0.03 | 13.5 | 0.07 |
| 45833 | Sb | -21.16 | 60 | — | 18.83 | 2.4 | 0.8 | 22.06 | 23.4 | 18.35 | 5.4 | 0.07 | 11.5 | 0.31 |
| 47011 | SBbc | -21.07 | 65 | 230 | 17.48 | 6.0 | 1.83 | 21.06 | 28.8 | 19.66 | 12.6 | 0.13 | 18.9 | 0.21 |
| 47855 | SABc | -21.26 | 54 | 207 | 21.31 | 1.2 | 0.17 | 20.71 | 17.4 | 18.54 | 8.4 | 0.00 | 18.0 | 0.21 |
| 48392 | Sc | -18.77 | 55 | 123 | 21.09 | 5.4 | 0.86 | 21.54 | 26.4 | 19.65 | 15.0 | 0.01 | 21.9 | 0.54 |
| 49540 | Sa | -21.19 | 53 | 266 | 18.38 | 3.0 | 0.85 | 20.86 | 12.0 | 22.09 | 22.2 | 0.21 | 14.0 | 0.20 |
| 49555 | Sbc | -18.97 | 46 | 173 | 19.72 | 9.0 | 0.94 | 21.36 | 66.6 | 20.56 | 49.8 | 0.03 | 0.23 | |
| 50610 | SBb | -20.12 | 47 | — | 21.06 | 1.8 | 0.3 | 20.60 | 7.8 | 22.20 | 12.6 | 0.05 | 16.1 | 0.32 |
| 50897 | Sa | -20.48 | 60 | 188 | 20.21 | 2.4 | 0.39 | 19.93 | 8.4 | 21.26 | 15.0 | 0.04 | 21.4 | 0.20 |
| 51541 | Sb | -19.75 | 59 | 175 | 19.84 | 4.8 | 1.38 | 20.70 | 15.0 | 19.52 | 10.2 | 0.03 | 17.6 | 0.57 |
| 51733 | Sbc | -19.26 | 51 | 121 | 20.89 | 4.8 | 0.6 | 21.98 | 25.2 | 20.78 | 9.6 | 0.11 | 16.4 | 0.26 |
| 54018 | SABc | -19.97 | 55 | 170 | 19.74 | 4.8 | 1.29 | 21.86 | 73.2 | 19.79 | 15.6 | 0.02 | 0.27 | |
| 54200 | SBbc | -21.33 | 51 | — | 21.88 | 1.8 | 0.29 | 21.35 | 18.6 | 20.59 | 7.8 | 0.01 | 24.5 | 0.30 |
| 54232 | SABb | -20.93 | 67 | 654: | 20.83 | 3.6 | 0.47 | 21.73 | 43.8 | 19.84 | 9.6 | 0.04 | 11.0 | 0.10 |
| 55213 | SBbc | -21.19 | 43 | 245 | 18.29 | 3.0 | 1.37 | 21.89 | 13.8 | 19.56 | 6.0 | 0.12 | 17.4 | 0.14 |
| 55792 | SABb | -21.55 | 36 | 355 | 20.21 | 3.0 | 0.64 | 22.58 | 42.6 | 20.74 | 8.4 | 0.09 | 10.6 | 0.15 |
| 55601 | SABb | -20.81 | 50 | 175 | 18.88 | 3.0 | 0.92 | 20.87 | 12.6 | 21.73 | 17.4 | 0.15 | 12.3 | 0.55 |
| 57800 | SABb | -21.11 | 55 | — | 21.09 | 2.4 | 0.1 | 20.78 | 10.2 | 20.33 | 8.4 | 0.03 | 13.8 | 0.12 |
| 58596 | Sb | -21.57 | 58 | 295 | 17.9 | 4.8 | 1.49 | 22.30 | 114.6 | 20.62 | 12.6 | 0.21 | 14.6 | 0.15 |
| 59222 | Sb | -21.06 | 45 | 213 | 19.83 | 2.4 | 0.95 | 22.49 | 16.2 | 21.13 | 7.2 | 0.13 | 14.4 | 0.13 |
| 65310 | SABb | -20.75 | 51 | — | 19.03 | 3.6 | 1.86 | 21.45 | 16.2 | 18.72 | 7.2 | 0.01 | 17.9 | 0.42 |
| 1346399 | S? | -20.71 | 53 | 193 | 21.13 | 3.0 | 0.56 | 21.09 | 5.4 | 23.28 | 14.4 | 0.14 | 21.5 | 0.91 |
| a – Kennicutt (1981): , Ma (2001): ; | ||||||||||||||
| b – Kennicutt (1981): , Seigar et al. (2006): , Ma et al. (1998): ; | ||||||||||||||
| c – Ma (2001): , Ma et al. (1998): ; | ||||||||||||||
| d – Kennicutt (1981): , Ma et al. (1998): ; | ||||||||||||||
| e – Ma (2001): . | ||||||||||||||
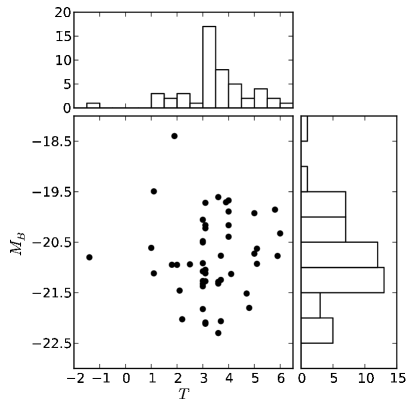
Fig. 1 represents the distribution of our sample galaxies by luminosities and morphological types (according to HyperLeda). As one can see, spiral galaxies of all morphological types are presented in the sample, with some excess of Sb–Sbc types.
g- and r-band images for all galaxies in our sample were obtained from SDSS DR9333http://www.sdss3.org/dr9/ data base. We have used the SWARP program (Bertin et al. 2002) to concatenate images of galaxies, splitted on two or more nearby fields.
3 Methods
Analysis of a galaxy image consists of three main steps. The first step consists of the determination a galaxy orientation parameters and correction of the image for projection effects. The second one consists of the decomposition of a galaxy on to bulge and disc subcomponents and their subtraction from the original image. The final step is the pitch angle measurement itself. In this section we describe these steps one by one.
3.1 Inclination
The projection of a galaxy on the celestial sphere distorts its visible shape and the degree of this distortion depends on value of an inclination of the galaxy. A study of a galaxy spiral structure, therefore, requires measurements of its orientation which can be described by two parameters: an inclination angle of a galaxy plane to the line of sight and a position angle of galaxy major axis.
In this work we have used the MSA method (Poltorak & Fridman 2007, Fridman & Poltorak 2010). This method allows us to obtain values of both inclination and position angle.
It is possible to represent a spiral arm of a galaxy as a function (in polar coordinate system). The main idea of the MSA method is based on the assumption that (i.e. the spiral arm is a monotony function).
This assumption however may be violated due to projection effect. Indeed, the projection on the celestial sphere decreases the visible size of the galaxy in one direction (along minor axis) and does not change it in perpendicular one (major axis). Thereby some parts of the spiral arm can show non-monotony behaviour.
One can deproject the image of the galaxy for all possible values of inclination and position angle (formally , ) and find those which give monotony spiral structure.
Accuracy of this method depends on a true value of inclination: for a less inclined galaxies it gives a bigger uncertainty. The lower limit of the method is about 30 – 40.
This method works well for galaxies with extended and prominent spiral arms, such as in our sample. Widely used method based on measurements of apparent ellipticity of outer isophotes can introduce significant errors due to distortion of isophotes shape by bright spiral arms, projected stars etc. In our previous work (Savchenko & Reshetnikov 2011) we have compared the MSA and isophotes methods and have found good mutual agreement. However, for several galaxies, the apparent isophote flattening method gives, obviously, incorrect values due to various kinds of peculiarities in the shapes of faint outer isophotes.
We have applied the MSA algorithm to all galaxies in our sample; the obtained values are listed in Table 1. The maximum rotational velocities in Table 1 () were obtained from the HyperLeda values corrected for our inclination estimates.
3.2 Bulge–disc decomposition
The pitch angle of spiral arms changes systematically along the Hubble sequence as well as many other morphological parameters (bulge-to-total ratio, Sérsic index of a bulge, etc.). One may expect the existence of correlations between the pitch angle value and various parameters of galaxies. For searching such correlations, we have made the decomposition of galaxies surface brightness distributions on to bulge and disc components.
We have used azimuthal averaging to get one-dimensional photometric profile of a galaxy . The averaging was made along ellipsis which ellipticity and position angle are correspond to the inclination and the position angle of the galaxy. To minimize the influence of background objects, we applied the iterative rejection procedure before averaging.
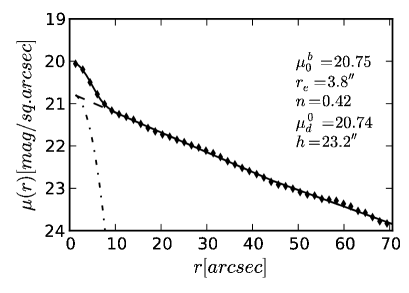
Bulges of galaxies are usually described by Sérsic profiles, whereas discs can be well represented by a simple exponential law with one or two (if disc has a break) exponential scales. Thus, the model of the brightness profile depends on eight parameters (since and of the galaxy are fixed): central surface brightness of a bulge , its Sérsic index , and effective radius , central surface brightnesses of inner and outer discs , , their exponential scales and and the location of the break :
| (3) |
where , , and are surface brightness of a galaxy in intensities, and central intensities of a bulge, inner and outer discs (); is a constant depends on . Despite the fact that the formula (3) is written in terms of intensities, the fitting process is much simpler in terms of surface brightnesses , , and , where the exponential profiles are just straight lines and the range of values is relatively small. If the disc does not have a break, then and .
The number of free parameters can be reduced to seven: central surface brightness of the outer disc can be expressed by the rest three parameters of the discs in assumption that the brightness does not have discontinuities at the break point: .
The fitting of the brightness profile by the function (3) was made via PYTHON’s wrapper of ODRPACK (orthogonal distance regression) FORTRAN library444http://www.scipy.org/doc/api_docs/SciPy.odr.odrpack.html.
The results of the decomposition of two galaxies without and with a break are shown in Fig. 2.
This decomposition allows us to obtain all eight parameters, described above, and parameters that depend on them – total bulge and disc luminosities, bulge-to-disc ratio etc. At this stage we also measured the colour of disc.
One of the main benefits from a galaxy image decomposition is in obtaining a high contrast image of spiral structure. The model (3) does not account for the spiral pattern, but only for large-scale components, so, after subtraction of this model from the image of the galaxy, the bulge and the disc will fade away and spiral arms will be visible on almost clear background.
3.3 Pitch angles
The Fourier transform of a galaxy image is a widely used technique to obtain pitch angles of spiral arms (for example, Considere & Athanassoula 1982, Davis et al. 2012). It allows us to make decompositions of a spiral pattern on to set of logarithmic spirals with different pitch angles (just like the regular Fourier-decomposition of a time series on to sum of different sinusoidal harmonics).
Common representation of this technique is as follows. Let be the value of intensity in the point with log-polar coordinates and (the origin of the coordinate system is in the centre of a galaxy), then
| (4) |
where is a value of the contribution of the -armed logarithmic spiral with the pitch angle in the whole spiral pattern. – is a normalization factor:
The resulting value of the pitch angle is the pitch angle of the spiral with larger contribution in Fourier-decomposition:
| (5) |
This method allows us to compute only the average value of the pitch angle over the whole spiral structure even if different regions of the spiral pattern have different pitch angle values.
To recover the information about spatial variations of the pitch angle value, one can apply this method to different regions of the spiral structure. This can be done by introducing a spatial filter which can “cut” a limited ring-like area of galaxy, thus one can compute the Fourier transform (4) only for this limited area. Changing the position of spatial filter gives the pitch angle value for different areas.
It is convenient to use simple rectangular window as such spatial filter:
| (6) |
where is width of the window and its position.
The regions for the pitch angle measurements were specified for each galaxy by hand on the basis of its spiral structure visibility: we have manually selected two radii and between which the spiral structure is clearly visible.
Finally we have
| (7) |
gives a contribution of -armed logarithmic spiral with the pitch angle at the distance from the centre of a galaxy. Similar to one-dimensional case, the pitch angle value at any particular distance can be found as a value of the pitch angle of spiral arm, which gives largest contribution in the decomposition at this distance (equation 5).
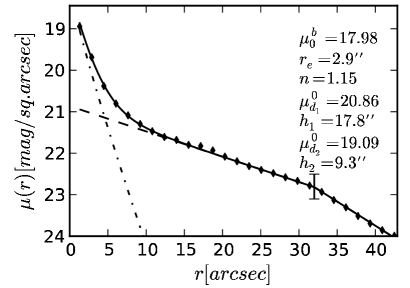
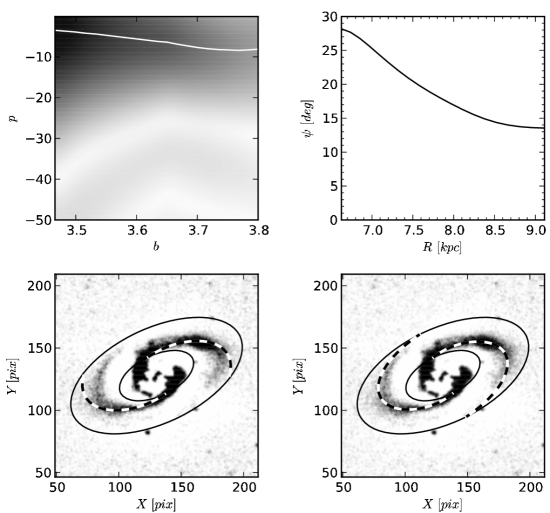
Fig. 3 presents an example of this method application for galaxy PGC 22596. The figure consists of four subimages. First subimage shows two-dimensional map of the windowed Fourier analysis (equation 7), where is a logarithm of distance from the centre of the galaxy and . Darker colour indicates higher values of and white line indicates the maximum position as a function of the distance in the figure. The second subimage shows the pitch angle value as a function of distance from the centre of the galaxy. On the third subimage two logarithmic spiral arms with average pitch angle are drawn above the residual (after bulge and disc models subtraction) image of the galaxy. For the comparison, on the fourth image two spirals with variable pitch angle are shown. These spiral arms with variable pitch angle can be computed by this recurrent formula:
It is easy to see that spiral arms with variable pitch angle fit spiral pattern of the galaxy better than ordinary logarithmic spirals with constant pitch angle.
4 Results
4.1 Decomposition results
To check the reliability of our model to describe the global photometric structure of the studied galaxies (Sect. 3.2), we have calculated their total luminosities using the decomposition parameters from Table 1. The luminosities of bulges and discs were computed from their decomposition parameters:
where is the gamma function and is the central intensity .
We have found that the mean difference of the SDSS deVMag magnitudes and our model magnitudes in the filter is . In the rest of our discussion we will use our model magnitudes.
Only two galaxies from our sample (PGC 38916 and PGC 39038) have single-disc surface brightness profiles. 15 galaxies (30%) have upbending profiles and 33 galaxies (64%) demonstrate downbending profiles. This statistics is in agreement with Pohlen & Trujillo (2006) results.
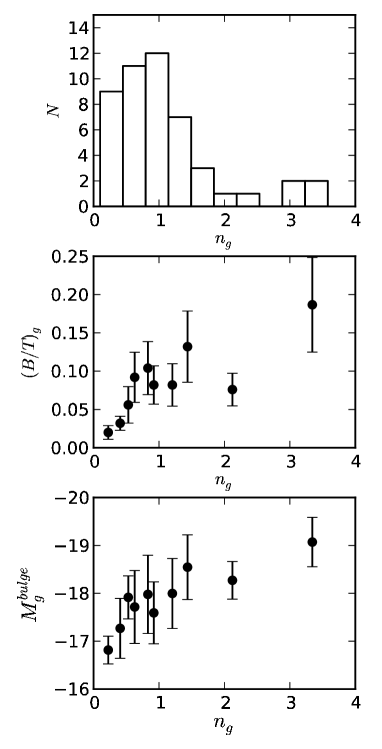
Fig. 4 summarizes several known correlations concerning decomposition parameters. The top panel shows the distribution of the galaxies by the Sérsic index of their bulges. Most of our galaxies are of late-types (Fig. 1), so values of their Sérsic index concentrate around 1 (pseudo-bulges), although several classic bulges (small peak at ) present too.
The middle panel of Fig. 4 shows correlation Sérsic index – bulge-to-total ratio. It is clear that galaxies with larger bulge-to-total ratio have larger values of the Sérsic index. The bottom panel shows the Sérsic index – absolute magnitude of the bulge correlation. One can see that bulges with larger Sérsic index are brighter.
The correlations shown in Fig. 4 have a significant scatter, so the points on the panels show average of five galaxies each. Error bars illustrate the scatter (rms) of real values in the corresponding bin. In the rest of the paper we will use the same averaging in the figures.
The correlations on Fig. 4 are typical for spiral galaxies (e.g. Mosenkov et al. 2010 and references therein), thus one can conclude that we have the sample of ordinary spiral galaxies.
4.2 Pitch angles and their variations
According to our measurements, the region of the spiral structure visibility (that is, where the spiral arms can be clearly detected) spans, on average, from to of inner discs exponential scales ().
For 4 of 5 galaxies with published estimates of their pitch angles we have obtained very similar values: the mean difference between our estimates and the data of other authors is (see Table 1). The only galaxy with significant difference between our measurements and other estimates is PGC 23028. Kennicutt (1981) and Ma (2001) give for this galaxy the angles of 13 and 12.2 respectively, while our value is 16.7. We argue that this difference may be due to radial variations of the pitch angle: in the inner regions of this galaxy the value of the pitch angle is about 21–22 while in outer is only 13–14, which is close to values obtained by Ma and Kennicutt.
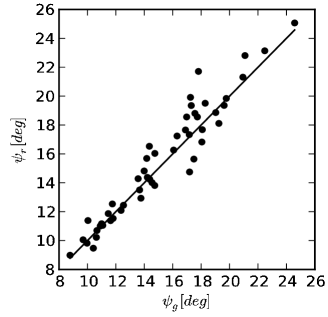
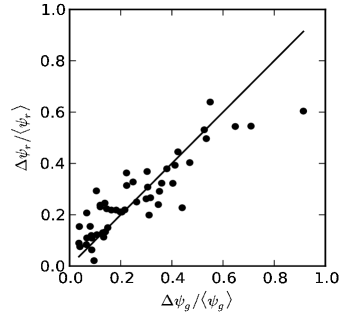
Fig. 5 shows relations between pitch angles (top panel) and amplitudes of their variations (bottom panel) measured in different passbands. The amplitude of the pitch angle variation is defined as maximum deviation from the average value divided by the average value. The mean difference between pitch angles measured in different passbands is and the mean difference between relative pitch angle variations in different passbands is .
In most galaxies, the pitch angle decreases with increasing distance from the centre (32 of 50 galaxies or 64% 11%), in the rest of galaxies the angle increases up to maximum distance to which spiral arms are still visible.
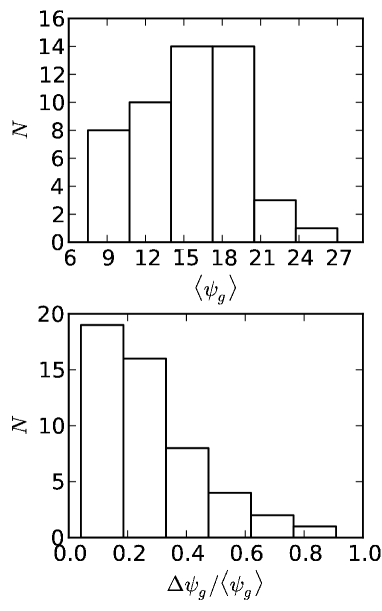
Fig. 6 presents the histogram illustrating the distribution of the average values of pitch angle (top) and the distribution of the sample galaxies by the value of their pitch angle variation (bottom). As one can see, the maximum is around zero and monotone decrease towards higher values of . About 2/3 of galaxies have the variations of the pitch angle greater than . Only 1/10 of the sample galaxies shows almost constant pitch angles with variations .
4.3 Pitch angles and general parameters of galaxies
Fig. 7 shows several known observational trends of the average pitch angles with general parameters of galaxies. As one can see in this figure, early-type, red and massive (with large values of ) galaxies, on average, demonstrate tighter spiral arms in comparison with late-type, blue and less massive (see also Kennicutt 1981, Ma 2002, Savchenko & Reshetnikov 2011).
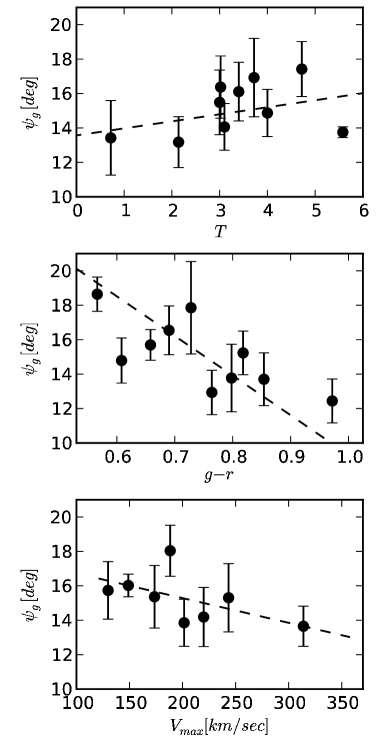
We found no statistically significant correlation between the pitch angles and the total luminosity of galaxies. We also tested the possible dependence of the pitch angle values on the ratio of the dynamical mass to the stellar mass within four scalelengths (e.g. Zasov et al. 2002, Kregel 2005). This correlation is insignificant also, although the size of our sample is not enough large for definitive judgement.
4.4 Pitch angles and galactic bulges and discs
Here we summarize some relations between the average pitch angles and parameters of galactic bulges and discs. There are seven parameters in the photometric model and some of them show a notable correlation with the pitch angles.
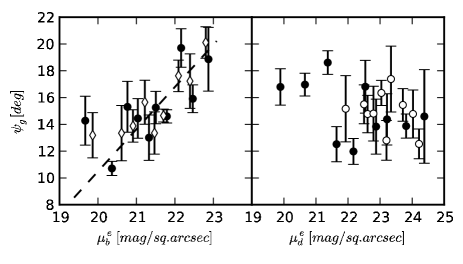
Fig. 8 shows the correlation of the pitch angle with effective surface brightnesses both of the bulge and the disc. Although during the decomposition process we have measured the central surface brightnesses, for this figure we have recomputed them to effective surface brightnesses because for bulges with the extrapolation of the model light curve to the centre of the galaxy gives too high values of the central surface brightness, whereas effective surface brightness takes more moderate values. The effective surface brightness for given central surface brightness and the Sérsic index can be found as .
Fig. 8 demonstrates that there is a statistically significant correlation between the effective brightness of the bulge and the pitch angle of spiral arms: galaxies with brighter bulge have smaller pitch angles. The correlation looks somewhat better for pseudo-bulges with (open rhombs in the figure). However there is no statistical significance for relation for discs (right-hand panel of Fig. 8).
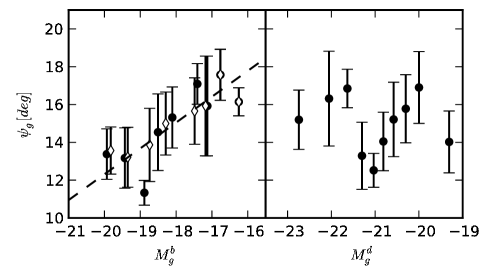
The pitch angle–absolute magnitude relation (Fig. 9) shows the same behaviour. There is a significant correlation between the pitch angle and the absolute magnitude of bulge, whereas for galactic discs the correlation is absent. (Conversion from apparent magnitude to absolute one was made using luminosity distance and absorption in the Galaxy according to the NED database.) On the other hand, the correlation between average value and effective radius of bulge is weak or absent.
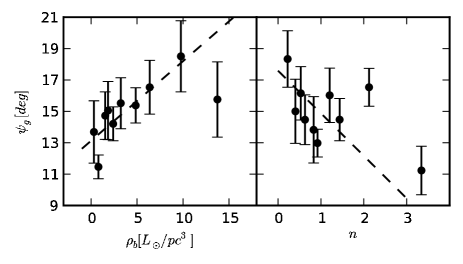
On the left-hand side of Fig. 10 a correlation of the pitch angle and the luminosity density of the bulge is shown. The luminosity density of the bulge is defined as luminosity of the bulge (in solar units) per cubic parsec: , where is luminosity of the bulge inside its effective radius and it is equal to a half of its total luminosity . Right-hand side of Fig. 10 presents – Sérsic index of the bulge relation. As one can see, there is clear observational trend of the pitch angle with the bulge characteristics.
4.5 Pitch angle variations and disc parameters

Fig. 11 displays dependence of pitch angle variation on parameters of disc. The left-hand panel of Fig. 11 shows how the relative variation of the pitch angle depends on the value of the break in galaxy disc. Values on the -axis is a decimal logarithm of ratio of the inner exponential scale to the outer one, so, if , galaxy has upbending brightness profile, means downbending or truncated profile.
The right-hand panel of Fig. 11 shows the pitch angle variation versus colour gradient. We obtain the colour gradient as the difference of disc colour at the beginning and at the end of the spiral structure (which was found during the decomposition stage) divided by the distance between them.
Both panels demonstrate notable observational trends. The first one is that stronger pitch angle variations associated with envelope-type surface brightness distributions (), while galaxies with almost constant pitch angles are more frequent among truncated discs (). Also, galaxies with positive colour gradient (red in the centre, blue in the periphery) show relatively small variations, while flat or negative gradients are associated with large variations of pitch angles.
4.6 Pitch angle variations and the galaxy environment
Although we have selected non-interacting galaxies only (by setting the multiplicity parameter in the EFIGI to be equal zero), it does not mean that galaxies of our sample does not have any satellites at all.
Nearby companions can distort or even induce (e.g. Dobbs et al. 2010) spiral structure. To check if variations of the pitch angle of our sample galaxies can be related with their environment, we have compared the mean number of satellites for 10 galaxies with minimal pitch angle variations and for 10 more with maximal variations.
The searching for satellites was made by examining the area around the galaxy inside some fixed radius and in depth by some fixed magnitude. We have made the search with two different sets of parameters: the first is , and the second one , , where is the Petrosian radius of the galaxy according to SDSS, and is the difference between apparent magnitudes of the galaxy and its companion. In the second case many background galaxies fall in the searching area, but the true satellites were separated from them by the redshift value.
The results of the companions searching are shown in the Table 2.
| Subsample | |||
|---|---|---|---|
| (1) | (2) | (3) | (4) |
The columns of this table are: (1) a subsample (10 galaxies with smallest or 10 galaxies with largest pitch angle variations); (2) the average pitch angle variation for this subsample; (3) the mean number of satellites for the first set of searching criteria ( and ) and (4) the mean number of satellites for the second set of searching criteria ( and ).
It is clear, that the pitch angle variation does not depend on the number of satellites at least for our sample of non-interacting galaxies. We argue that it means that the pitch angle variations of these galaxies are generated by their intrinsic properties but not by tidal perturbations with nearby galaxies.
5 Conclusions
We have presented a detailed photometric study and pitch angle measurements for a sample of 50 non-barred or weakly barred Sa–Sc galaxies with two large-scale spiral arms. The main results of this work are as follows.
-
1.
We have developed and described a new method for measuring the pitch angle () of the spiral arms of galaxies based on the window Fourier analysis. This method allows not only to infer the average pitch angle, but also to obtain its value as a function of galactocentric radius.
-
2.
Application of this technique for a sample of 50 galaxies showed that, in general, spiral arms of most galaxies in the sample cannot be described by a single value of the pitch angle. About 2/3 of galaxies demonstrate pitch angle variations exceeding 20%.
-
3.
We have found that pitch angle variations does not depend on the presence of close companions – galaxies with large and small pitch angle variations are in approximately the same local spatial environment. From the other side, variations of correlate with the properties of galaxies themselves – with the shape of the surface brightness distribution, and with the sign of stellar disc colour gradient (Fig. 11).
-
4.
Average pitch angle demonstrates known dependencies on general characteristics of galaxies – early-type, red and massive galaxies tend to have tighter spiral arms in comparison with late-type, blue and less massive (Fig. 7).
-
5.
Average pitch angle shows clear observational trend with general properties of galactic bulges – faint bulges tend to have opened spiral arms, while bright (with high surface brightness) and luminous (with large total luminosity and large Sérsic indices) bulges demonstrate tight spiral arms (Figs. 8–10). On the other hand, correlation of with disc parameters (Figs. 8 and 9) is much weaker. Therefore, classic correlation between the pitch angle of a galaxy and its morphological type can be explained by changes in the properties of bulges along the Hubble sequence.
Our main conclusion – dependence of the spiral structure on the properties of bulges (or central mass concentrations) – is in according with expectations of two presently most pursued models for the formation of spiral structures (density waves and manifold) (see discussion in Berrier et al. 2013). The mass of the bulge of the galaxy correlates with the mass of the central black hole (e.g., Magorrian et al. 1998), and, therefore, there is a relationship between the pitch angle and the mass of the black hole (Seigar et al. 2008, Berrier et al. 2013). As we know, neither theory gives clear predictions on the radial pitch angle variations. Therefore, any model that intends to explain the formation and evolution of the spiral pattern in disc galaxies has to reproduce our empirical findings as well.
Acknowledgements
We acknowledges partial financial support from the RFBR grant 11-02-00471a.
Funding for SDSS-III has been provided by the Alfred P. Sloan Foundation, the Participating Institutions, the National Science Foundation, and the U.S. Department of Energy Office of Science. The SDSS-III web site is http://www.sdss3.org/.
SDSS-III is managed by the Astrophysical Research Consortium for the Participating Institutions of the SDSS-III Collaboration including the University of Arizona, the Brazilian Participation Group, Brookhaven National Laboratory, Carnegie Mellon University, University of Florida, the French Participation Group, the German Participation Group, Harvard University, the Instituto de Astrofisica de Canarias, the Michigan State/Notre Dame/JINA Participation Group, Johns Hopkins University, Lawrence Berkeley National Laboratory, Max Planck Institute for Astrophysics, Max Planck Institute for Extraterrestrial Physics, New Mexico State University, New York University, Ohio State University, Pennsylvania State University, University of Portsmouth, Princeton University, the Spanish Participation Group, University of Tokyo, University of Utah, Vanderbilt University, University of Virginia, University of Washington, and Yale University.
This research has made use of the NASA/IPAC Extragalactic Database (NED) which is operated by the Jet Propulsion Laboratory, California Institute of Technology, under contract with the National Aeronautics and Space Administration. We acknowledge the usage of the HyperLeda data base (http://leda.univ-lyon1.fr)
The authors thank an anonymous referee for constructive comments and suggestions.
References
- Berrier et al. (2013) Berrier, J. C., Davis, B. L., Kennefick, D., et al. 2013, ApJ, 769, 132
- Bertin et al. (2002) Bertin, E., Mellier, Y., Radovich, M., et al. 2002, Astronomical Data Analysis Software and Systems XI, 281, 228
- Binney & Tremaine (1987) Binney, J., & Tremaine, S. 1987, Princeton, NJ, Princeton University Press, 1987, 747 p.,
- Considere & Athanassoula (1982) Considere, S., & Athanassoula, E. 1982, A&A, 111, 28
- Davis et al. (2012) Davis, B. L., Berrier, J. C., Shields, D. W., et al. 2012, ApJS, 199, 33
- Dobbs et al. (2010) Dobbs, C. L., Theis, C., Pringle, J. E., & Bate, M. R. 2010, MNRAS, 403, 625
- Fridman & Poltorak (2010) Fridman, A.M., & Poltorak, S.G. 2010, MNRAS, 403, 1625
- Grand et al. (2013) Grand, R. J. J., Kawata, D., & Cropper, M. 2013, A&A, 553, A77
- Karachentsev & Karachentseva (1967) Karachentsev, I.D., Karachentseva, V.E., Communications of the Byurakan Observatory,38, 47 (1967).
- Kennicutt (1981) Kennicutt, R. C., Jr. 1981, AJ, 86, 1847
- Kregel (2005) Kregel, M., van der Kruit P.C., & Freeman, K.C. 2005, MNRAS, 358, 503
- de Lapparent, Baillard & Bertin (2011) de Lapparent V., Baillard A., Bertin E., 2011, A&A, 532, A75
- Ma, J. and Peng, Q.-H. & Gu, Q.-S. (1998) Ma, J., Peng, Q.-H., Gu, Q.-S., 1998, A&AS, 130, 449
- Ma (2001) Ma, J. 2001, CHJAA, 1, 395
- Ma (2002) Ma, J. 2002, A&A, 388, 389
- Magorrian et al. (1998) Magorrian, J., Tremaine, S., Richstone, D., et al. 1998, AJ, 115, 2285
- Mosenkov et al. (2010) Mosenkov A.V., Sotnikova N.Ya., & Reshetnikov V.P. 2010, MNRAS, 401, 559
- Paturel et al. (2003) Paturel G., Petit C., Prugniel P., Theureau G., Rousseau J., Brouty M., Dubois P., Cambrésy L., 2003, A&A, 412, 45
- Pohlen & Trujillo (2006) Pohlen, M., & Trujillo, I. 2006, A&A, 454, 759
- Poltorak & Fridman (2007) Poltorak, S. G., & Fridman, A. M. 2007, Astronomy Reports, 51, 460
- Ringermacher & Mead (2009) Ringermacher, H. I., & Mead, L. R. 2009, MNRAS, 397, 164
- Russell & Roberts (1992) Russell, W. S., & Roberts, W. W., Jr. 1992, ApJ, 398, 94
- Russell & Roberts (1993) Russell, W. S., & Roberts, W. W., Jr. 1993, ApJ, 414, 86
- Savchenko (2012) Savchenko S.S., 2012, Bull. Spec. Astrophys. Obs., 67, 310
- Savchenko & Reshetnikov (2011) Savchenko S.S., Reshetnikov V.P., 2011, Astr. Lett., 37, 817
- Seigar et al. (2005) Seigar, M. S., Block, D. L., Puerari, I., Chorney, N. E., & James, P. A. 2005, MNRAS, 359, 1065
- Seigar et al. (2006) Seigar, M. S., Bullock, J. S., Barth, A. J., & Ho, L. C. 2006, ApJ, 645, 1012
- Seigar et al. (2008) Seigar, M. S., Kennefick, D., Kennefick, J., & Lacy, C. H. S. 2008, ApJ, 678, L93
- Zasov et al. (2002) Zasov, A.V., Bizyaev, D.V., Makarov, D.I., & Tyurina N.V. 2002, Astron. Lett., 28, 527