Preliminary Analysis of ULPC Light Curves Using Fourier Decomposition Technique
Abstract
Recent work on Ultra Long Period Cepheids (ULPCs) has suggested their usefulness as a distance indicator, but has not commented on their relationship as compared with other types of variable stars. In this work, we use Fourier analysis to quantify the structure of ULPC light curves and compare them to Classical Cepheids and Mira variables. Our preliminary results suggest that the low order Fourier parameters ( and ) of ULPCs show a continuous trend defined by Classical Cepheids after the resonance around 10 days. However their Fourier parameters also overlapped with those from Miras, which make the classification of long period variable stars difficult based on the light curves information alone.
Keywords — Cepheids; late-type stars; distance scale
I Introduction
Cepheid variables are key component in astrophysical research, as they are an indispensable link in the extragalactic distance ladder. However, for the most part, current research focuses on Classical Cepheids with periods less than 60 days. There are good reasons for this: in terms of sufficient phase coverage, they take less time to observe, and they have a well defined period-luminosity (PL) relation. Also, Cepheids with periods greater than 100 days obey a different relation ([1]), which has not been nearly as well documented. In this work, we follow the same conventions as [1], defining these “Ultra Long Period Cepheids” (ULPCs) to be any fundamental mode Cepheids with a pulsation period greater than 80 days.
Even though ULPCs have generally not been studied as intensely as shorter period Cepheids, there are many advantages to acquiring data on these ULPCs. As the PL relation indicates, the longer the period of a star, the brighter it is. This means that these variables can be observed at much greater distances than are currently possible. This added brightness would allow us to use Cepheids to measure distances out to 100 Mpc and beyond [1]. In this work, our goal is to study the structural properties of ULPC light curves. We are interested in comparing the light curves of ULPCs to shorter period Classical Cepheids as well as to longer period Mira-like variables (Miras).

II Data
II-A ULPCs
There is very limited data for ULPCs available right now, but we were able to compile data for 17 ULPCs in 6 different galaxies, including the Large and Small Magellanic Clouds (LMC/SMC), NGC 6822, NGC 55, NGC 300, and I Zw 18.
For the six stars in the LMC and the SMC, we obtained the V-band data from [1] and the I-band data from [2]. We also acquired additional V- and I-band data through the McMaster Cepheid Photometry Archive111http://crocus.physics.mcmaster.ca/Cepheid/ for four ULPCs in the LMC. [3] had some additional data points for HV 883 and HV 2447. Also, for HV 2883 and HV 5497, we acquired data from [4], again through the McMaster Archive. [1] also had V- and I-band data for the five stars in NGC 55, the three stars in NGC 300, and the one star in NGC 6822. Again, using the McMaster Archive, additional photometry was acquired for NGC 300-1 (as named by [1]) from [3]. The photometric V- and I-band data for the two stars in I Zw 18 were obtained from [5].
The periods for these stars were also compiled in [1]. In Table LABEL:tab:ulpcs we have listed all the ULPCs in our data set together with their periods and host galaxies. In this Table, the names of the stars (Column 1) are consistent with those used by [1]. Column 3 contains the distance modulus (DM) values for the stars’ host galaxies listed in Column 2. The magnitudes (Column 5) are the absolute, reddening corrected, mean V-band magnitudes as calculated by our Fourier analysis with orders as shown in Column 6. All the data for these stars was obtained from [1] and references therein, however for the stars where more data was compiled, footnotes have been added. Figure 1 presents the ULPC light curves used in this work.
| Name | Galaxy | DM | Period [days] | N | |
|---|---|---|---|---|---|
| HV 883000Additional data from [3]. | LMC | 18.50 | 133.6 | -6.30 | 4 |
| HV 2447\footreffn:f | LMC | 118.7 | -6.47 | 4 | |
| HV 2883000Additional data from [4]. | LMC | 109.2 | -5.98 | 3 | |
| HV 5497\footreffn:m | LMC | 98.6 | -6.62 | 4 | |
| HV 821 | SMC | 18.93 | 127.5 | -6.99 | 4 |
| HV 829 | SMC | 84.4 | -7.00 | 4 | |
| NGC 6822 - 1 | NGC 6822 | 23.31 | 123.9 | -5.41 | 3 |
| NGC 55 - 1 | NGC 55 | 26.43 | 175.9 | -7.17 | 4 |
| NGC 55 - 2 | NGC 55 | 152.1 | -6.87 | 3 | |
| NGC 55 - 3 | NGC 55 | 112.7 | -6.21 | 3 | |
| NGC 55 - 4 | NGC 55 | 97.7 | -5.89 | 4 | |
| NGC 55 - 5 | NGC 55 | 85.1 | -5.58 | 3 | |
| NGC 300 - 1\footreffn:f | NGC 300 | 26.37 | 115.8 | -6.15 | 3 |
| NGC 300 - 2 | NGC 300 | 89.1 | -6.66 | 3 | |
| NGC 300 - 3 | NGC 300 | 83.0 | -7.11 | 2 | |
| V1 | I Zw 18 | 31.30 | 129.8 | -7.30 | 2 |
| V15 | I Zw 18 | 125.0 | -7.62 | 2 |
Note: DM is the distance modulus of the host galaxy, is the absolute -band averaged magnitude after reddening correction, and is the order of Fourier fit.
II-B OGLE-III Catalog
The third installment of the Optical Gravitational Lensing Experiment (OGLE-III) contains photometric data for many variable stars in the Large and Small Magellanic Clouds. We were interested in the V- and I-band photometric light curves data for fundamental mode Cepheids and longer period Mira-like variables. We also obtained the periods for all the stars we used from the catalog. From OGLE-III LMC Cepheid catalog ([6]), we chose 1,804 (out of 1,849) Cepheids based on what data was available for these stars. We then obtained the V- and I-band photometric light curve data for these Cepheids. Similarly, of the 2,626 available fundamental mode Cepheids in the SMC ([7]), we selected 2,596. The OGLE-III catalog also contains photometric and period data for ”long period variables” (LPVs). These LPVs are classified into three different types: Miras, OSARGs, and SRVs ([8]). We chose 1,407 of the listed 1,663 Mira variables and again used both their V- and I-band photometric data.
II-C NGC 300 Cepheid Data
[9] acquired V- and I-band photometric data for 64 Cepheids from NGC 300 with periods ranging from 11 to 115 days. However, three of the Cepheids have periods greater than 80 days, so they are included as ULPCs, not as regular Cepheids of NGC 300. The remaining 61 stars and their light curve data were added to our Classical Cepheid data set.
III Fourier Analysis
We characterized the structure of all the observed light curves in our data set using the technique of Fourier decomposition. That is, the following function was fit to the observed data for a given star:
| (1) |
Here , where is the period in days, and represent the amplitude and phase-shift for -order respectively, and is the order of the fit. To determine the order, we used several different techniques. For the ULPCs, we looked at the Fourier fits of each star individually and visually determined which order gave the best representation. The resulting orders are presented in last Column of Table LABEL:tab:ulpcs. To determine the optimum orders for the Classical Cepheids and the Miras, we ran the Fourier analysis with several different orders and after inspecting some of the fits, concluded that the orders listed in Column 5 of Table LABEL:tab:ccmiradata gave the best representations of our data. This was a universal value that we used for all the stars of the given type in the given galaxy. In order to quantify the structure of the light curve, we used the Fourier parameters and defined as follow ([11]):
| (2) |
where is set to be and .
| Galaxy | Star Type | Stars | Band | Order |
|---|---|---|---|---|
| LMC | Cepheids | 1,804 | V | 5 |
| I | 8 | |||
| Miras | 1,407 | V | 3 | |
| I | 3 | |||
| SMC | Cepheids | 2,598 | V | 4 |
| I | 8 | |||
| NGC 300 | Cepheids | 61 | V | 3 |
| I | 3 |
III-A Error on Fourier Parameters
In order to determine the accuracy of our results, we used techniques developed by [10] to calculate the errors on and parameters as follows:
| (3) |
| (4) |
where is the coefficient of the Fourier decomposition as shown in Equation (1) and is related to the sum of the squared residuals, :
| (5) |
In the above equation, is the number of data points, and is the residual. Even though these are the approximations that [10] derived, he states that they still provide valuable information on the accuracy of the Fourier parameters.
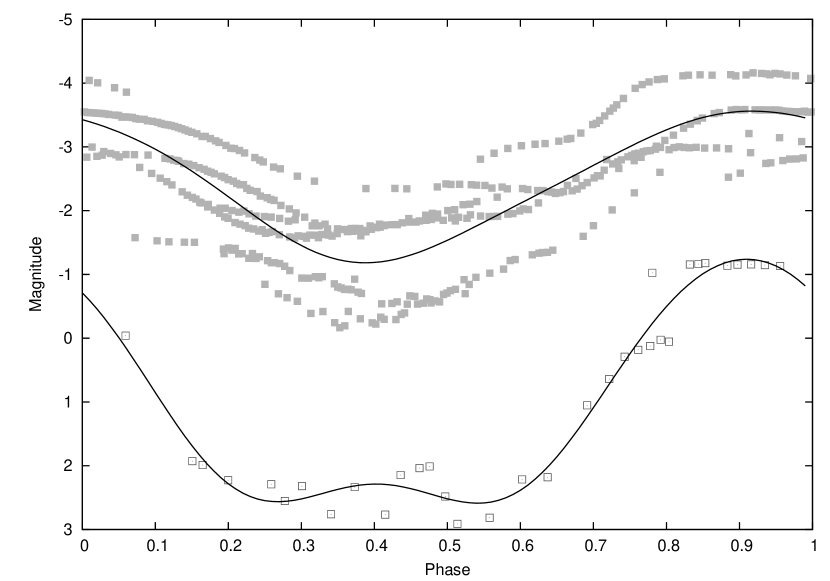
III-B Fourier Fit to the Miras Data
Miras are known to have periods and amplitudes that are not constant like the Classical Cepheids. This made compiling the light curves slightly more difficult, because the data points did not always form a single, well-defined curve when the measurement times were converted to phases of one period. The I-band data was especially problematic. We dealt with this by using a low enough order of the Fourier fit (as given in Table LABEL:tab:ccmiradata) so as to essentially take an average of the light curve. This is demonstrated in Figure 2, where the solid squares are the I-band measurements. The solid black lines are calculated the Fourier fits: the I-band fit is approximately an average of the spread of data points. In order to calculate the Fourier parameters stated above, we needed at least third order terms (as for some of the Miras, a higher order fit produced some artifacts in fitted light curves). Therefore, when we calculated the Fourier parameters and plotted the fitted light curves, we restricted to a third order fit.
| Name | |||||
|---|---|---|---|---|---|
| V-band Results | |||||
| HV 883 | 2.126 | ||||
| HV 2447 | 2.074 | ||||
| HV 2883 | 2.038 | ||||
| HV 5497 | 1.994 | ||||
| HV 821 | 2.106 | ||||
| HV 829 | 1.926 | ||||
| NGC6822-1 | 2.093 | ||||
| NGC55-1 | 2.245 | ||||
| NGC55-2 | 2.182 | ||||
| NGC55-3 | 2.052 | ||||
| NGC55-4 | 1.990 | ||||
| NGC55-5 | 1.930 | ||||
| NGC300-1 | 2.064 | ||||
| NGC300-2 | 1.950 | ||||
| NGC300-3 | 1.919 | ||||
| V1 | 2.113 | ||||
| V15 | 2.097 | ||||
| I-band Results | |||||
| HV 883 | 2.126 | ||||
| HV 2447 | 2.074 | ||||
| HV 2883 | 2.038 | ||||
| HV 5497 | 1.994 | ||||
| HV 821 | 2.106 | ||||
| HV 829 | 1.926 | ||||
| NGC6822-1 | 2.093 | ||||
| NGC55-1 | 2.245 | ||||
| NGC55-2 | 2.182 | ||||
| NGC55-3 | 2.052 | ||||
| NGC55-4 | 1.990 | ||||
| NGC55-5 | 1.930 | ||||
| NGC300-1 | 2.064 | ||||
| NGC300-2 | 1.950 | ||||
| NGC300-3 | 1.919 | ||||
| V1 | 2.113 | ||||
| V15 | 2.097 | ||||
Note: in column 2 represents the period. Entries with are not included in Figure 3.
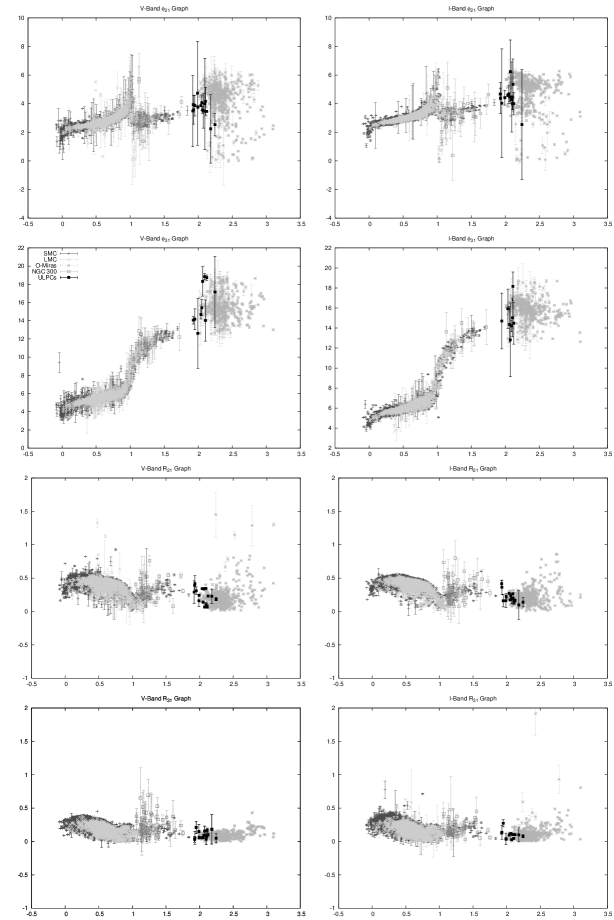
III-C Fourier Parameters
Our main goal was to compare the Classical Cepheids, ULPCs and Miras through their light curves structure, by using Fourier analysis technique (see, for example, [11]). Figure 3 shows plots of the , , , and Fourier parameters in both the V- and I-bands, where the values for ULPCs are given in Table LABEL:tab:param. In this Figure, the solid black squares are the ULPCs, and the various shades of gray are the Classical Cepheids and the Miras from their respective galaxies. Although the error bars are large, and there are many outliers in the Mira data, there does seem to be a trend in the LMC and SMC Classical Cepheids that leads to the ULPCs and beyond to the Miras fairly continuously.
We were able to reconstruct well known features of these Fourier parameter plots ([11]). In both the V- and I-band graphs of , the resonance at a value of , or at period of days, is clearly visible. After this dramatic drop in the values of , the Classical Cepheids seem to lie along a fairly flat relation, and although we don’t have much data between , the ULPCs seem to follow a similar trend. We see similar results for the other Fourier parameter graphs. For example, in the graphs we again see a resonance at , then a flattening of the relation (though in this case, the ULPCs do not quite line up as well). Even though there is not much data for stars between , and the error bars on most of the data are quite large, Fourier parameters (, , & ) for ULPCs seem to be extending from the trends defined by Classical Cepheids, and overlapped with the parameters space occupied by Miras.
IV Discussion & Conclusion
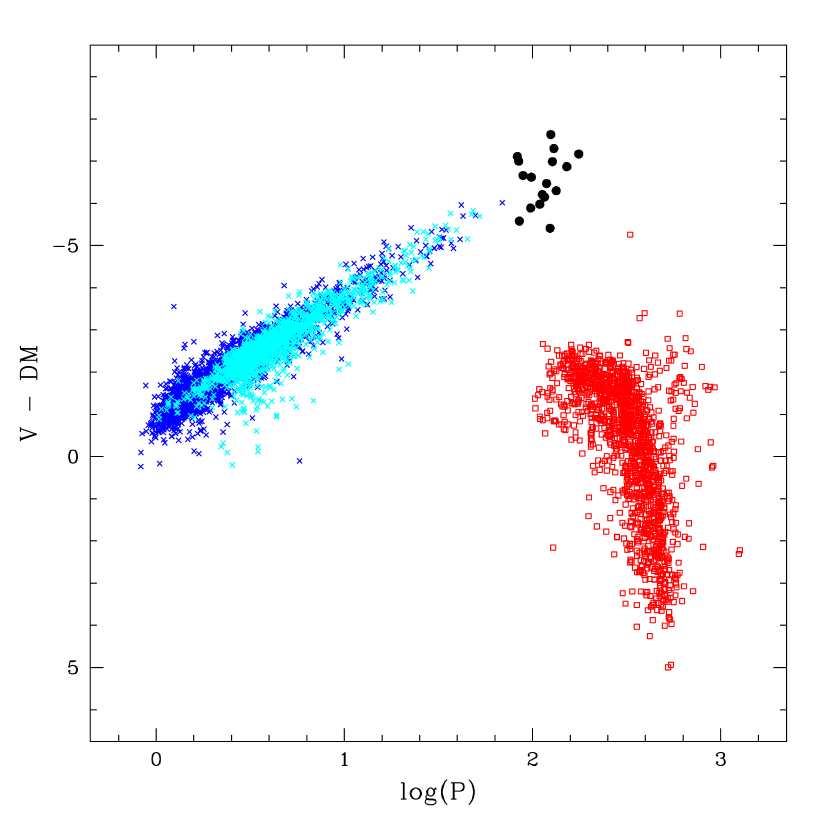
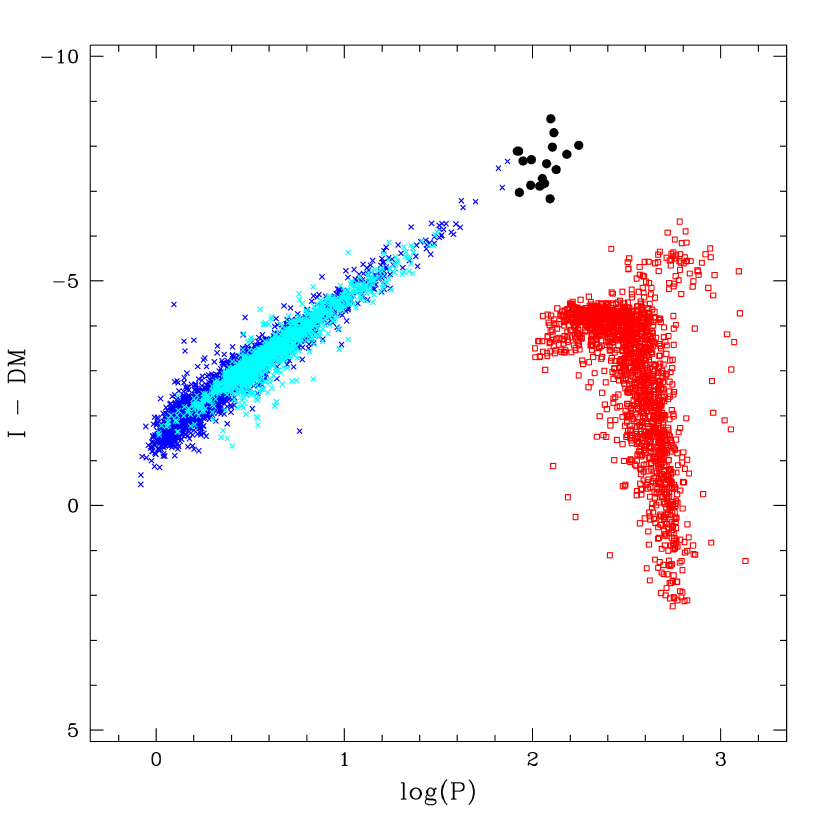
By analyzing the light curves of Ultra Long Period Cepheid variable stars, we looked for a relation between shorter period variables (Classical Cepheids) and longer period variables (Miras). We used Fourier analysis to quantitatively measure the structural properties of the ULPCs’ light curves and compare them to the light curves of Classical Cepheids as well as to long period Mira variables in the LMC. It is interesting to take note of the locations of the ULPCs more specifically, with respect to the trends produced by the Miras and the Classical Cepheids. In the graphs of the Fourier parameters (Figure 3), the ULPCs seem to be more consistent with the Miras. They lie more with the longer period variables than along the relations created by the Classical Cepheids. This suggests that when using light curves information to classify variable stars with period longer than 80 days, it is possible that some ULPCs might mis-classified as Miras (and vice versa) due to their overlapped Fourier parameters. In contrast, the plots of period and luminosity can be used to distinguish Classical Cepheids and ULPCs from Miras, as they are well separated in the PL relation (see Figure 4). Unfortunately, the error bars on Figure 3 are quite large, and we have a very small sample of ULPCs. However, once we obtain more data points both for the light curves of known ULPCs and for many more as of yet undiscovered ULPCs, we will be able to learn much more about how it relates to currently known types such as Classical Cepheids and Mira variables.
Acknowledgment
The authors thank SUNY Oswego, National Central University (NCU) and the Graduate Institute for Astronomy at NCU, and the National Science Foundation’s Office of International Science & Engineering’s award 1065093. CCN thanks the funding from National Science Council of Taiwan under the contract NSC101-2112-M-008-017-MY3. We would also like to thank G. Fiorentino for her helpful comments when drafting this paper. Finally, this project wouldn’t have been possible without the ULPC data compiled by J. Bird and G. Fiorentino.
References
- [1] Bird, J. C., Stanek, K. Z., & Prieto, J. L. 2009, The Astrophysical Journal, 695, 874
- [2] Moffett T., Gieren W. P., Barnes T. G. III & Gomez M., 1998, The Astrophysical Journal, 117, 135
- [3] Freedman W. L., Grieve G. R. & Madore B. F., 1985, The Astrophysical Journal, 59, 311
- [4] Martin W. L. & Warren P. R., 1979, South African Astronomical Observatory Circulars, 4, 98
- [5] Fiorentino G. et al., 2010, The Astrophysical Journal, 711, 808
- [6] Soszyński I. et al., 2008, Acta Astronomica, 58, 163
- [7] Soszyński I. et al., 2010, Acta Astronomica, 60, 17
- [8] Soszyński I. et al., 2009, Acta Astronomica, 59, 239
- [9] Gieren W. et al., 2004, The Astrophysical Journal, 128, 1167
- [10] Petersen J. O., 1986, Astronomy and Astrophysics, 170, 59
- [11] Simon N. R. & Lee A. S., 1981, The Astrophysical Journal, 248, 291