Energy spectra of KASCADE-Grande based on shower size measurements and different hadronic interaction models
Abstract
KASCADE-Grande is dedicated for investigations of cosmic-ray air showers in the primary energy range from 10 PeV to 1 EeV. The multi-detector system allows us to reconstruct charged particles, electron and muon numbers for individual air showers with high accuracies. Based on the shower size () spectra of the charged particle component, the all-particle energy spectrum of cosmic rays is reconstructed, where attenuation effects in the atmosphere are corrected by applying the constant intensity cut method. The energy calibration is performed by using CORSIKA simulations with high-energy interaction models QGSJET-II-2, QGSJET-II-4, EPOS 1.99 and SIBYLL 2.1, where FLUKA has been used as low-energy interaction model for all cases. In the different hadronic models, different abundances for shower particles are predicted. Such model differences in the observables will be compared and discussed in this contribution. Furthermore, by using data with increasing statistics, the updated energy spectra by means of different interaction models will be presented.
1 Introduction
Investigations of the energy spectra of elemental groups and mass composition of primary cosmic rays in the knee region around 1017 eV give an important clue to examine theoretical models of the cosmic ray origin, acceleration and propagation. The multi-detector array of KASCADE-Grande is designed for observations of cosmic ray air showers, in particular, in the energy range of the transition region. Recent results of the KASCADE-Grande measurements have shown two spectral features in the all-particle energy spectrum [1]: a knee-like structure at 90 PeV [2] and a hardening of the spectrum [3] around 20 PeV. In general, interpretations of the measurements are related to numerical simulations of extensive air showers to obtain shower properties including the nature of the primary particles. The relation between the observables and the primary energy depends on the hadronic interaction models, so that, on energy estimations, a large uncertainty in these simulations comes from the models which describe the hadronic interactions. In this contribution, results from different hadronic interaction models are therefore discussed how their features affect the energy assignment, based on the measurements of shower size (), i.e. the total number of charged particles.
The KASCADE-Grande experiment covering an area of about 0.5 km2 is optimized to measure extensive air showers up to primary energies of 1 EeV [4]. It consists of 37 scintillation detector stations located on a hexagonal grid with an average spacing of 137 m for the measurements of electromagnetic and muonic shower components. Each of the detector stations is equipped with plastic scintillator sheets covering a total area of 10 m2. Full efficiency for the total number of charged particles is reached at around 106, which corresponds to a primary energy of about1016 eV. The limit at high energy is due to the restricted area of the Grande array.
2 Hadronic interaction models
The CORSIKA [5] program has been used for the air shower simulations, applying different hadronic interaction models. High-energy interactions were used with different models of QGSJET-II-2 [6], EPOS 1.99 [7], SIBYLL 2.1 [8]. and QGSJET-II-4[9]. For hadronic interactions at low energies, the FLUKA [10] (E 200 GeV) model has been used. The response of all detector components is taken into account by using the GEANT package. The predicted observables at ground level, such as e.g. the number of electrons, muons and hadrons are then compared to the measurements.
Showers induced by five different primaries (p, He, O, Si, and Fe) have been simulated. The simulations covered the energy range of 1014 to 31018 eV with zenith angles in the interval 0∘ - 42∘. The spectral index in the simulations was -2 and for the analysis it is weighted to a slope of -3. The simulated events are analyzed by the same method as the experimental data, in order to avoid biases by pattern recognition and reconstruction algorithms. The systematic uncertainty of the total number of charged particles is smaller than 5% and its statistical accuracy is better than 15%.
3 All-particle energy spectra
The analysis presented here is based on the data of 1753 days with increasing statistics, where all detector components were operating without failures in data acquisitions. The quality cuts on the fiducial area and zenith angles smaller than 40∘ result in approximately 2107 events for the further analysis.
The studies of QGSJET-II-2, EPOS 1.99 and SIBYLL 2.1 models with KASCADE-Grande data can be found in Ref. [11]. Therefore, predictions of the most recent version of QGSJET-II-4 model will be mainly investigated in this paper.
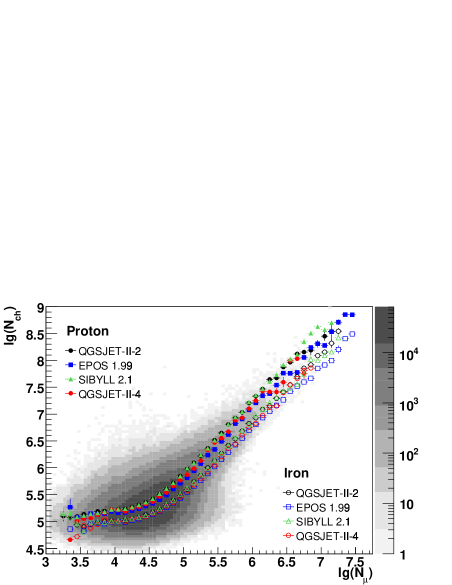
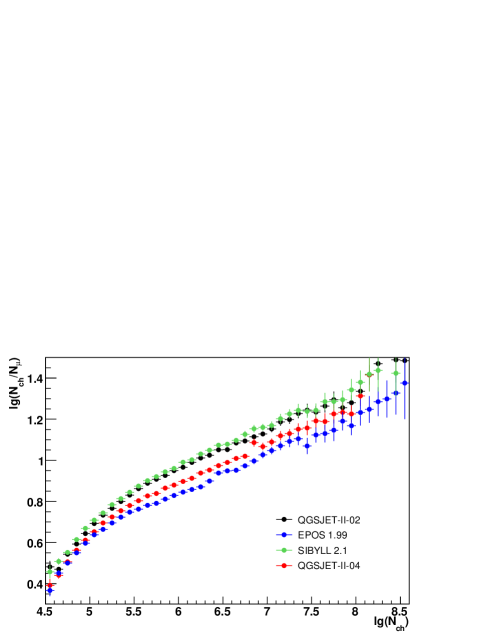
Figure 1 represents the measured 2-dimensional shower size spectrum, including the full detector response by simulations. The symbols correspond to the primary protons and iron nuclei, as predicted by the different interaction models. In the QGSJET-II-4 model, one obtained about 20% enhancement for the shower muon content of extensive air showers, due to the effects of the modified treatment of charge exchange processes in pion collisions. Therefore, the most probable values for QGSJET-II-4 in Fig. 1 show a similar tendency to the EPOS 1.99 model, which has also about 15% more muons than QGSJET-II-2 at KASCADE-Grande energies. This implies that a dominant light mass composition is predicted if the QGSJET-II-4 model is used to reconstruct the mass of primary particles from the measured data. Figure 2 shows the ratio of the number of charged particles () to the muon number () as a function of . Both QGSJET-II-2 and SIBYLL 2.1 models have a similar abundance ratio of to , while the QGSJET-II-4 and EPOS 1.99 have approximately 10% and 20% more muons, respectively, comparing to QGSJET-II-2.
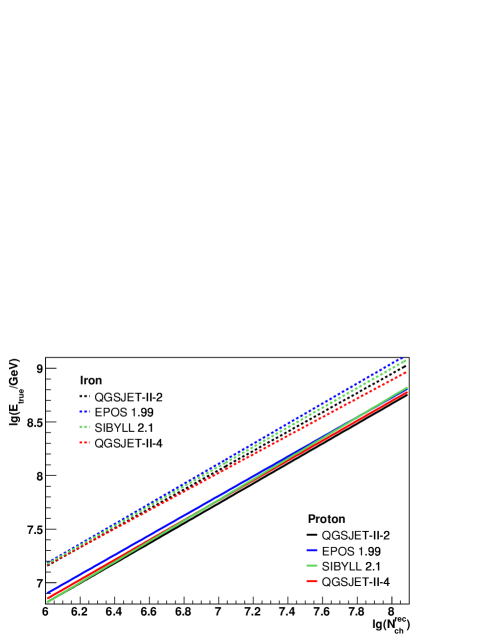
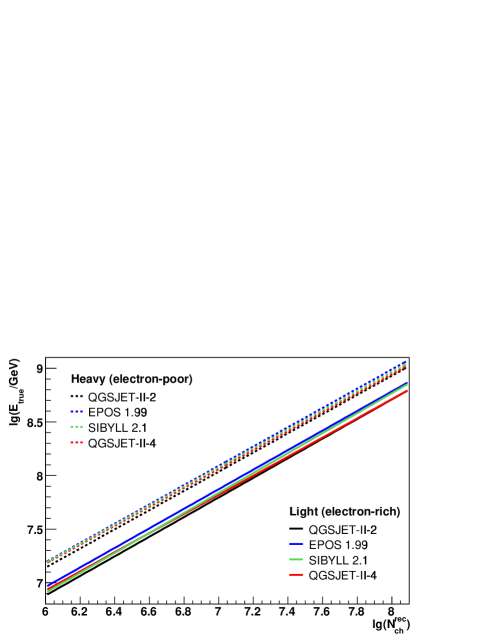
For the estimation of the primary energy, the first step is that the shower size per individual event is corrected for attenuations in the atmosphere by the Constant Intensity Cut (CIC) method. To determine the correlation between the number of charged particles and the primary energy, Monte-Carlo simulations were used then, based on different hadronic interaction models. The correlation of the primary energy as a function of the number of charged particles is plotted in Fig. 3 for the assumption of primary protons and iron nuclei, respectively, as well as for the different interaction models. Assuming a linear dependence in logarithmic scale: lg = lg() and a primary composition, the linear fit is applied in the range of full efficiencies. The energy calibration depends on the hadronic interaction models, so that the fittings are performed individually and the resulting coefficients of the energy calibration for QGSJET-II-4 are and , and and with a reduced of 1.27 for proton and 0.88 for iron, respectively. The fit results of QGSJET-II-2, EPOS 1.99 and SIBYLL 2.1 models are summarized in Ref. [11].
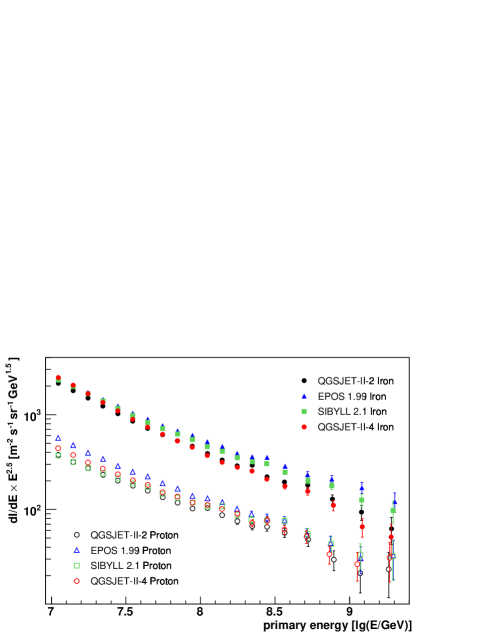
Figure 4 presents the resulting all-particle energy spectra obtained after applying the energy reconstruction functions, based on the assumption of iron and proton for QGSJET-II-4, together with the results for QGSJET-II-2, EPOS 1.99 and SIBYLL 2.1 models, where the shower to shower fluctuations were not properly taken into account yet.
Assuming the iron showers, the spectrum of the QGSJET-II-4 model tends to be close to the one of QGSJET-II-2. The spectral slopes of all four models show a slight discrepancy over the whole energy range. It is because of the different ratio of of the different hadronic interaction models, so that the total fluxes are shifted. However, all the spectra show a similar feature, as well as a similar tendency concerning the assumption of primary masses. In addition, the resulting all-particle energy spectra of four different interaction models show that they cannot be described by a single power law. Such thing could imply possibly different elemental composition in the transition region from galactic to extragalactic origin of cosmic rays.
The total systematic uncertainty of QGSJET-II-2 for proton and iron is 21% and 10%, respectively, at the primary energy of 1017 eV. The estimations of systematic uncertainties for QGSJET-II-4, are currently being performed. It is, however, expected to be about the same order of other models.
| /GeV) | /ndf | ||||
|---|---|---|---|---|---|
| QGSJET-II-2 | 7.76 0.06 | 2.92 0.01 | 3.11 0.03 | 0.19 | 0.69 |
| SIBYLL 2.1 | 7.75 0.09 | 2.87 0.03 | 3.15 0.05 | 0.28 | 1.28 |
| EPOS 1.99 | 7.71 0.06 | 2.76 0.03 | 3.18 0.06 | 0.42 | 0.98 |
| QGSJET-II-4 | 7.73 0.14 | 2.88 0.03 | 3.18 0.04 | 0.30 | 0.96 |
4 Spectra of individual mass groups
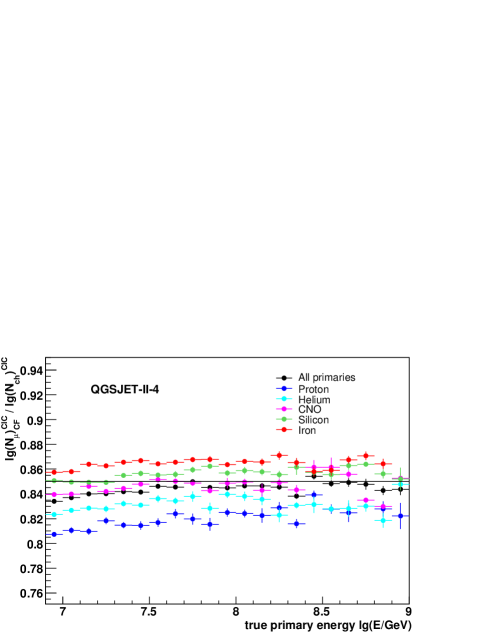
Air showers induced by heavier primary particles develop earlier in the atmosphere due to their larger cross section for interacting with air nuclei, and produce relatively larger muon numbers at ground level. Therefore, the fraction of muons to the all charged particles at observation level characterize the mass of the primary particles, i.e. electron-rich showers are generated by light primary nuclei and electron-poor showers by heavy nuclei, respectively. Since KASCADE-Grande measures the particle numbers well after the shower maximum, the measured showers were separated into electron-poor and electron-rich events representing heavy and light mass groups. For this method, the shower size ratio of is used to separate the events, where and are the muon and the charged particle numbers corrected for attenuation effects in the atmosphere by the CIC method.
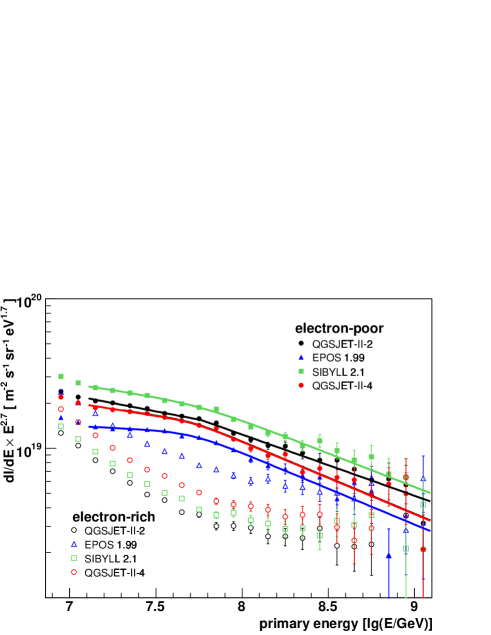
In Fig. 5, the ratio of the shower size as a function of the true primary energy for five different primaries is plotted. For the QGSJET-II-4 model, the optimal separation value in between electron-rich and electron-poor mass groups is = 0.85, while it is 0.84 for QGSJET-II-2 and SIBYLL 2.1, and 0.86 for EPOS 1.99. I.e. the events larger than the value of 0.85 are taken as heavy mass group into account, whereas events smaller than 0.85 as light mass group. After applying the selection, the energy spectra of electron-rich and electron-poor are reconstructed only by using the shower size, where the energy is calibrated by simulations based on the four different hadronic models, shown in Fig. 6. Figure 7 shows the the reconstructed energy spectra of heavy and light mass groups. Performing the fit of a broken power law, the breaking positions and the spectral slopes are summarized in Table 1. In the spectra of the heavy primaries, i.e. electron-poor events, a clear knee-like feature can be seen at just below 1017 eV for all four different models. A remarkable hardening feature above 1017 eV in the spectrum of the light primaries is observed as well in all hadronic interaction models.
5 Conclusions
Based on simulations with the different hadronic interaction models of QGSJET-II-2, EPOS 1.99, SIBYLL 2.1 and QGSJET-II-4, their influences on the reconstructed all-particle energy spectrum are investigated by means of the shower size measurements of the charged particle component measured by KASCADE-Grande. For the all-particle energy spectrum, the spectral shapes and structures are in reasonable agreement among four interaction models. Even if the different hadronic models would give some different values of , the spectral shapes of the resulting energy spectra of these mass components present a similar tendency for four different interaction models. Moreover, this result is consistent with another KASCADE-Grande analysis based on different observables. In the KASCADE-Grande measurements, we observed similar structures of the all-particle energy spectrum, as well as the spectra of the heavy and light mass components, for different hadronic interaction models.
Acknowledgment: The authors would like to thank the members of the engineering and technical staff of the KASCADE-Grande collaboration, who contributes to the success of the experiment. The KASCADE-Grande experiment was supported in Germany by the BMBF and by the Helmholtz Alliance for Astroparticle Physics - HAP funded by the Initiative and Networking Fund of the Helmholtz Association, by the MIUR and INAF of Italy, the Polish Ministry of Science and Higher Education, and the Romanian Authority for Scientific Research UEFISCDI (PNII-IDEI grants 271/2011 and 17/2011).
References
- [1] W.D. Apel et al., KASCADE-Grande Coll., Astroparticle Physics 36 (2012) 183-194.
- [2] W.D. Apel et al., KASCADE-Grande Coll., Phys. Rev. Lett. 107 (2011) 171104.
- [3] W.D. Apel et al., KASCADE-Grande Coll., Phys. Rev. D 85 (2012) 071101.
- [4] W.D. Apel et al., KASCADE-Grande Coll., Nucl. Instr. Meth. A 620 (2010) 202-215.
- [5] D. Heck et al., Rep. FZKA 6019, Forschungszentrum Karlsruhe (1998).
- [6] S.S. Ostapchenko, Phys. Rev. D 74 (2006) 014026.
- [7] T. Pierog et al., Proc. 31st Int. Cosmic Ray Conf., Lodz, Report FZKA 7516, Forschungszentrum Karlsruhe (2009) 133.
- [8] E.J. Ahn et al., Phys. Rev. D 80 (2009) 094003.
- [9] S.S. Ostapchenko, Phys. Rev. D 83 (2011) 014018.
- [10] A. Fassò et al., CERN-2005-10, INFN/TC-05/11, SLAC-R-773 (2005).
- [11] D. Kang et al., KASCADE-Grande Coll., J. Phys.: Conf. Ser. 409 (2013) 012101