Clonal selection and therapy resistance in acute leukemias: Mathematical modelling explains different proliferation patterns at diagnosis and relapse
ABSTRACT
Recent experimental evidence suggests that acute myeloid leukemias may originate from multiple clones of malignant cells. Nevertheless it is not known how the observed clones may differ with respect to cell properties such as proliferation and self-renewal. There are scarcely any data on how these cell properties change due to chemotherapy and relapse. We propose a new mathematical model to investigate the impact of cell properties on multi-clonal composition of leukemias. Model results imply that enhanced self-renewal may be a key mechanism in the clonal selection process. Simulations suggest that fast proliferating and highly self-renewing cells dominate at primary diagnosis while relapse following therapy-induced remission is triggered mostly by highly self-renewing but slowly proliferating cells. Comparison of simulation results to patient data demonstrates that the proposed model is consistent with clinically observed dynamics based on a clonal selection process.
Keywords: clonal evolution, leukemia, cancer stem cells, mathematical models, selection process
1 Introduction
Leukemia is a clonal disease of the hematopoietic system leading to extensive expansion of malignant cells that are non functional and cause impairment of blood cell formation. Recent experimental evidence indicates that the malignant cell population might be composed of multiple clones [1], maintained by cells with stem-like properties [2, 3]. A clone consists of genetically identical stem and non-stem cells. Relapse of the disease after therapy is a common problem of leukemias [1].
To understand better origins of acute leukemia relapses, a genetic interdependence between clones at diagnosis and relapse has been investigated using gene sequencing and other techniques. In most cases of acute lymphoblastic leukemia (ALL) the clones dominating relapse have already been present at diagnosis but undetectable by routine methods [4, 5, 6]. Due to quiescence, very slow cycling or other intrinsic mechanisms, [6, 5] these clones survive chemotherapy and eventually expand [6, 5]. This implies that the main mechanism of relapse in ALL is based on a selection of existing clones and not an acquisition of therapy-specific mutations [5]. Similar mechanisms have been described for acute myeloid leukemia (AML), where clones at relapse are genetically closely related to clones at primary diagnosis [1, 7] and did not have to acquire additional mutations during the course of disease [8, 9].
Based on these findings the evolution of malignant neoplasms can be interpreted as a selection process [10, 11, 12] of cells with properties that enable them to survive treatment and to expand efficiently. Cells with different mutations may have different growth properties [1]. Chemotherapy significantly alters growth conditions of cells and therefore, it may have a strong impact on the selection process. If cells dominating at diagnosis are sensitive to therapy, minor clones with intrinsic resistance [6, 5, 13] may expand more efficiently once the competing clones are eliminated by the treatment. The latter could explain manifestation of different cell clones at diagnosis and at relapse without a need for additional mutations in between.
The mechanism of the underlying selection process and its impacts on the disease dynamics and on the response of cancer cells to chemotherapy are not understood. Gene sequencing studies allow to decipher the genetic relation between different clones, nevertheless the impact of many detected mutations on cell behaviour remains unclear [1] and often passenger mutations cannot be distinguished from relevant genetic changes [4]. Many authors, e.g. [14, 15], have provided evidence for the heterogeneity of LSCs attempting to identify the LSC characteristics, for review see [16]. This heterogeneity is further supported by the results of gene sequencing studies [1, 17, 18]. The multifactorial nature of the underlying processes severely limits the intuitive interpretation of experimental data. Mathematical modelling is a powerful technique to close this gap and to provide quantitative insights into cell kinetics, fate determination and development of cell populations. It allows a systematic study of processes not yet accessible by experimental procedures. Mathematical models have been widely applied to analyze the regulatory mechanisms controlling the hematopoietic system and its diseases: for review see [19, 20, 21, 22] and references therein.
The aim of this work is to investigate the impact of cell growth properties on the clonal selection process in acute leukemias before and after treatment. We introduce mathematical models of dynamics of leukemia, which are extended versions of the models proposed earlier by our group [23, 24, 25]. The novel ingredients of the models in this work are: (i) heterogeneity and multiclonal structure of LSCs, (ii) different plausible feedback mechanisms, and (iii) effects of chemotherapy.
Since the mechanism of interaction between healthy and leukemic cell lines is not well identified, we propose two models (see Fig.1). In the first one, we assume that leukemic cells depend on hematopoietic growth factors and interact with hematopoietic cells via competition for these factors. The second model is based on the assumption that autonomous leukemic clones compete with hematopoietic cells for niches in bone marrow, which leads to an increased cell death due to over-crowding. The latter is supported by experimental findings showing signal-independent activation of important cell functions [26, 27, 28] and by an increased cell degradation observed in leukemic patients [29, 30, 31]. Such interactions have not been considered in previous models.
The models proposed in this paper do not account for new mutations. Motivated by the experimental findings described above [6, 5, 8, 9], we rather aim to understand which aspects of the dynamics of leukemias can be explained by a selection process alone. It is interesting, since expansion of a clone at relapse that could not be detected at diagnosis due to limited sensitivity of methods can be misinterpreted as occurrence of mutations [5]. This scenario seems to be relevant in case of acute leukemias with a short duration treatment administration. Many acute leukemias are genetically relatively stable in comparison to other cancers [32, 33]. For this reason on average many replications are necessary to acquire a new mutation. Consequently, it is less probable that cells acquire mutations during short treatment and, therefore, intrinsic resistance to therapy may be important, as suggested by available evidence [5]. The latter does not hold true for long-term drug administration, such as imatinib treatment in case of chronic leukemias. For this reason, our work focuses on the acute leukemias. For completeness of this work and to check how mutations might influence the model dynamics as it concerns results presented in this paper, we have developed a version of the model with mutations. The simulations of the model confirm our conclusions for the model with mutations. The model and simulations are presented in Appendix.
Using mathematical models, we aim to identify which cell properties are compatible with intrinsic resistance to therapy and efficient expansion after treatment, and to compare them with the cell properties selected for before treatment. We perform computer simulations describing evolution of multi-clonal population of leukemic cells during the disease development and the contribution of different clones to the entire cancer cell population at different time points. The heterogeneity of the system is given by a certain number of leukemic clones already present at the beginning of our observation. The models provide information on the influence of cell properties on the growth dynamics of the different clones in presence or in absence of chemotherapy. This allows to understand how the cell properties selected for before treatment differ from those selected for during and after treatment and how treatment could be optimised to reduce relapses. Finally, we compare qualitatively model simulations to patients’ data from clinical routine to show that the proposed models are consistent with clinical observations concerning the response to therapy and the time intervals between relapses of the disease. Details of mathematical formulation and parametrisation of the proposed models are presented in Appendix.
2 Methods
2.1 Mathematical Models
2.1.1 Model assumptions
The models used in this study are based on the models of healthy hematopoiesis proposed and analysed in [23, 34, 35, 36] and extended to account for evolution of a single leukemic clone in [25].
Based on the classical understanding of hematopoiesis [37], we assume that the system consists of an ordered sequence of different maturation states, so called compartments. To describe time evolution of cell populations, we apply ordinary differential equations. The enormous amount of cells forming the hematopoietic system justifies this approach [37, 38]. Evolution of small cell population in the post-therapy period is modeled by cutting off the initial data which are below a minimal threshold, as it was, for example, proposed in [39].
We model time dynamics of one healthy cell lineage and an arbitrary number of leukemic clones. In the description of cell differentiation within each cell line, we choose a two-compartment version of the multi-compartment system established in [23]. The model focuses on the maintenance of primitive cells and differentiation from undifferentiated, proliferating cells to differentiated, post-mitotic cells. In the case of healthy hematopoiesis, the proliferating cells are hematopoietic stem cells (HSC), hematopoietic progenitor cells (HPC) and precursor cells, the post-mitotic cells are mature cells, e.g., white cells. The two-compartment architecture is based on a simplified description of the multi-stages differentiation process. Nevertheless as shown in [24], [35], and [36] models consisting of two compartments capture the desired dynamics of the multi-compartmental cell population. This allows to reduce the complexity of the differentiation process to focus on mechanisms and effects of competition between different cell lines.
Each proliferating cell type is characterised by the following cell properties:
-
•
Proliferation rate, describing how often a cell divides per unit of time.
-
•
Fraction of self-renewal, describing the fraction of daughter cells returning to the compartment occupied by the mother cells that gave rise to them. Based on our earlier work and on compatibility with clinical data [23], we assume that the fraction of self-renewal of hematopoietic cells is regulated by feedback-signalling.
-
•
Death rate, describing what fraction of cells dies per unit of time. For simplicity, we assume that under healthy conditions proliferating cells do not die and post-mitotic mature blood cells die at a constant rate. We assume the same for leukemic cells in Model 1, while in Model 2 (see below), we consider, additionally, cell density- dependent death rates for all bone marrow cell types if the marrow space is overcrowded. The considered marrow cell types include immature hematopoietic cells and mitotic and post-mitotic leukemic cells. Overcrowding is defined when marrow cell counts exceed the steady state marrow cell count for 2 to 3 times. In this case the death rate of post-mitotic leukemic cells consists of their intrinsic death rate and the death triggered by spatial competition.
Production of healthy blood cells is regulated by a negative feedback [40, 41, 42], mediated by cytokines, such as G-CSF or EPO [42, 37, 43]. If there is a shortage of blood cells of a certain type, the concentration of signalling molecules increases and stimulates expansion of precursor cells. This effect is modeled using a negative feedback loop as proposed in [23]. Analysis and simulation of the model of healthy hematopoiesis, validated based on the clinical observations after stem cell transplantations [23, 44, 45], indicate that the regulation of the self-renewal is a more efficient mechanism than the regulation of the proliferation rates. Similar conclusions have been drawn using the models of multistage cell lineages applied to regeneration and maintenance of the mouse olfactory epithelium [46, 47]. Therefore, in the remainder of this paper we assume that the regulatory mechanism is based on the feedback inhibition of self-renewal depending on the level of mature cells.
2.1.2 Model of the healthy cell line
We denote by the proliferation rate of mitotic hematopoietic cells and by the corresponding fraction of self-renewal. The death rate of mature blood cells is denoted by . We denote the concentration of healthy cell types at time by , corresponding to mitotic and mature cells, respectively. The flux to mitosis at time equals . During mitosis, a mother cell is replaced by two daughter cells. The outflux from mitosis at time equals , of which the fraction stays in compartment (process referred to as self-renewal). The fraction moves to compartment (process referred to as differentiation).
We denote the value of the feedback signal at time by , which takes values between zero and one. Self-renewal of a certain cell type at time is assumed to be given as a maximal possible self-renewal of this cell type multiplied by . Following [25, 23], we chose , which can be derived from cytokine kinetics [23]. The constant depends on the rate of extra-hematopoietic cytokine degradation by liver or kidney and on the rate of cytokine degradation by hematopoietic cells. The latter depends on the densities of cytokine receptors on hematopoietic cells [45].
We obtain the following system of ordinary differential equations, where corresponds to the maximal possible self-renewal of hematopoietic stem cells.
| (1) | |||||
| (2) | |||||
| (3) |
The two different models proposed in this manuscript differ with respect to the interaction of leukemic and hematopoietic cells. We consider two cases. In Model 1 leukemic cells depend fully on hematopoietic cytokines whereas in Model 2 they are totally independent of environmental signalling. In this sense Model 1 and Model 2 can be understood as the two opposite extremes of a continuum. In reality both mechanisms, competition for environmental signals and direct inhibition or death of hematopoietic cells, may contribute to impaired hematopoietic function [48]. A schematic representation of the models is given in Fig 1.
2.1.3 Model 1
We assume that leukemic cells depend on the same feedback signal as their healthy counterparts and that the post-mitotic leukemic cells (blasts) decrease the supply of the factor. It describes a competition between healthy and leukemic cells for survival signals, which results in down-regulation of self-renewal. A schematic representation of the model is given in Fig 1.
To write the corresponding equations, we denote the number of leukemic clones by . As for the hematopoietic cells we consider mitotic and post-mitotic cell compartments for each leukemic clone. Let denote the proliferation rate of mitotic cells in leukemic clone and the corresponding maximal fraction of self-renewal. By we denote the clearance rate of post-mitotic cells of clone . Denote by the level of mitotic cells of clone and by the level of post-mitotic cells at time . These assumptions result in the following system of ordinary differential equations:
| (4) | |||||
| (5) | |||||
| (6) | |||||
| (7) | |||||
| (8) | |||||
| (9) | |||||
| (10) | |||||
| (11) |
The expression for is a special case of , where we assume that for all . This simplification corresponds to the observation that the density of cytokine receptors is similar on cells of all leukemic clones. For the major cytokine of the myeloid line, G-CSF [41], this is is true for many patients [49]. Since there is evidence that in some patients receptor densities may differ between different leukemic clones [49], we have repeated all simulations with a randomly chosen value for each clone, ranging from 30% of to 100% of . This heterogeneity had no significant impact on the model results. Since in many cases the receptor density on leukemic cells is of the same order of magnitude as that on hematopoietic cells [49, 50], we assume also for the simulation of patient examples.
2.1.4 Model 2
There is evidence that in some leukemias malignant cells show constitutive activation of certain signalling cascades and thus may become independent of external signals [26, 27, 28]. We consider this scenario in Model 2. In contrast to Model 1, we assume that leukemic cells are independent of hematopoietic cytokines, whereas the hematopoietic cell types depend on the nonlinear feedback described above. Interaction between the healthy and cancer cell lines is modeled through a competition for space resulting in an increased cellular degradation, for example due to overcrowded bone marrow space. This is consistent with the observation of an increase of markers for cell death such as LDH [29, 30, 31]. Several mechanisms underlying this spatial competition have been proposed: (i) physical stress due to overcrowding leads to extinction of cells (e.g., [51]; recently challenged by [52]), (ii) competition for a limited niche surface expressing certain receptors (contact molecules) necessary for survival of the cells [53, 54] and apoptosis if no contacts to these molecules can be established [55].
We model the space competition by introducing a death rate that increases with the number of cells in bone marrow and acts on all cell types residing in bone marrow, i.e., mitotic and post-mitotic leukemic cells as well as mitotic hematopoietic cells. For simplicity we assume in Model 2 that all leukemic cells stay in bone marrow, since the number of leukemic cells exiting bone marrow is highly variable among individuals and only partially dependent on the leukemia subtype [56, 57, 58] and since it is not well understood which mechanisms are responsible for marrow egress and high inter-individual variability. The presented results are robust with respect to this assumption: We repeated all simulations for the cases that 10%, 50% or 90% of the most mature leukemic blasts exit bone marrow. This has impact on the time dynamics of marrow blast count but does not influence the cell properties that are selected for.
Let be an increasing function with . This function describes the death rates of bone marrow cells in dependence of bone marrow cell counts . We assume that under healthy conditions there exists no cell death due to overcrowding. Enhanced cell death can be observed only if total bone marrow cellularity increases beyond the threshold level. This assumption is in line with bone marrow histology [59]. Therefore, we assume that for , where is the steady state count of mitotic healthy cells.
Assuming that the hematopoietic cell lineage is regulated as described above, we obtain the following system of differential equations:
| (12) | |||||
| (13) | |||||
| (14) | |||||
| (15) | |||||
| (16) | |||||
| (17) | |||||
| (18) | |||||
| (19) | |||||
| (20) |
Here denotes the mitotic cells of clone , their fraction of self-renewal and their proliferation rate. The level of post-mitotic cells of clone is denoted as . In absence of marrow overcrowding these cells die at rate .
2.1.5 Chemotherapy
We focus on classical cytotoxic therapy acting on fast dividing cells, which is introduced to the models by adding a death rate proportional to the proliferation rate. The assumption is motivated by the fact that many of the classical therapeutic agents used for treatment of leukemias act on cells in the phase of division or DNA replication, [60]. Therefore, the rate of induced cell death is proportional to the number of cycling cells. We assume that the linear factor, denoted by , is identical for all mitotic cells. Under chemotherapy, the equation for mitotic hematopoietic cells in Model 1 takes the form
| (21) |
Similarly, we obtain for mitotic cells of leukemic clone
| (22) |
Chemotherapy in Model 2 is introduced analogously.
2.2 Simulations
We perform numerical simulations of the models to investigate which leukemic cell properties lead to survival advantage during evolution of leukemogenesis and recurrence under chemotherapy. As explained before, the models do not account for additional mutations taking place during the therapy. Instead, we investigate evolution of a certain number of leukemic clones present at a starting time point. We assume that in healthy individuals the hematopoietic cells are in a dynamic equilibrium, i.e. production of each cell type equals its clearance. Initial conditions for the computer simulations are equilibrium cell counts in the hematopoietic cell lineage and a small cell number for different leukemic clones. We assume that the initial number of leukemic clones in each patient is 50. This number is arbitrarily chosen. All presented simulations were repeated for different numbers of leukemic clones (between 3 and 100), what led to comparable results (see Supplemental Figures 1 and 2). We assume that primary diagnosis and diagnosis of relapse occur, when healthy blood cell counts are decreased by 50% of their steady state value. We perform simulations for 50 patients, i.e. 50 different sets of initial data and model parameters, with 50 leukemic clones per patient. The growth properties of the leukemic clones are chosen randomly within certain ranges. The choice of model parameters is described in the Appendix. The simulations follow the following algorithm:
-
(i)
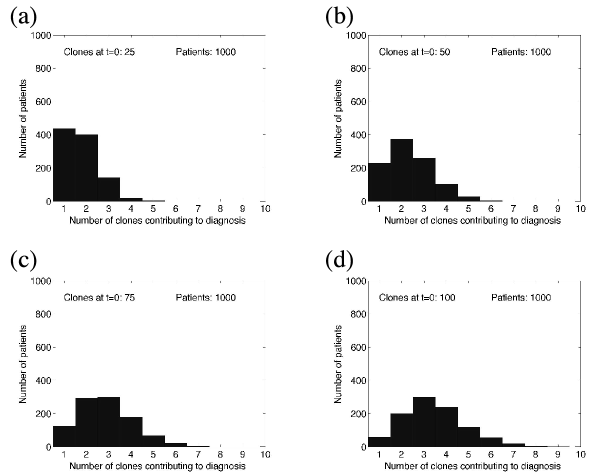
We start from healthy equilibrium in the hematopoietic lineage and one mitotic cell per kg of body weight for each leukemic clone and run simulations until the number of healthy mature blood cells decreases by 50%. We investigate properties of the clones with the highest contribution to the total leukemic cell mass. The clones under consideration are those which together constitute 80% of the total leukemic cell mass. In the following we denote these clones as ’significantly contributing clones’. This procedure is taken to reflect the sensitivity of the detection methods. In more than 90% of the patients 2 to 4 clones sum up to more than 95% of the total leukemic cell mass. Taking a threshold between 80% and 95% to define ’significantly contributing clones’ has little influence on the result. Furthermore, more than 97% of the clones that are considered as insignificant by this method consist of less than 1% of the leukemic cell mass. This number is in agreement with the detection efficiency reported in literature [61].
-
(ii)
Next, we simulate chemotherapy. For simplification, we consider seven applications of cytotoxic drugs (one per day during seven following days, corresponding to standard inductions). Simulations show that the number of drug applications has no influence on the presented qualitative results. As proposed in literature [39], we assume that a cell population has become extinct if it consists of less than one cell. Initial conditions for the post-therapy period are obtained from cell counts after therapy where counts of extinct populations are set to zero. We continue simulations until mature blood cell counts decrease by 50% and then assess the cell properties of the clones contributing to relapse.
Calibration of the hematopoietic part of the model to clinical data and parameters for simulation of two patient examples can be found in Appendix. Since in clinical routine only few key mutations are monitored, we choose patient examples with different key mutations detected at diagnosis and at relapses. Such data is relatively rare, therefore we focus on two patients. Simulations are performed using standard ODE-solvers from the Matlab-software package (Version 7.8, The MathWorks, Inc, Natic, MA) which are based on Runge-Kutta schemes.
3 Results
3.1 Clonality at diagnosis
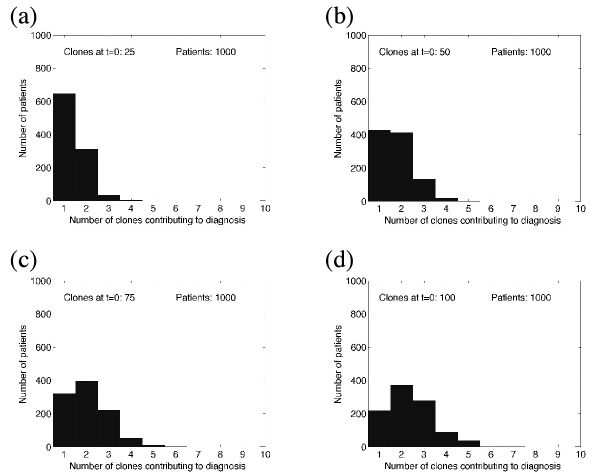
We solve the models numerically to obtain insight into the contribution of different leukemic clones to the total leukemic cell mass. Simulations indicate that at the diagnosis rarely more than 3-4 clones significantly contribute to the total leukemic cell mass. In most cases more than 40-50% of the total leukemic cell mass originates from a single leukemic clone. This finding is identical for both considered models.
3.2 Properties of clones at diagnosis
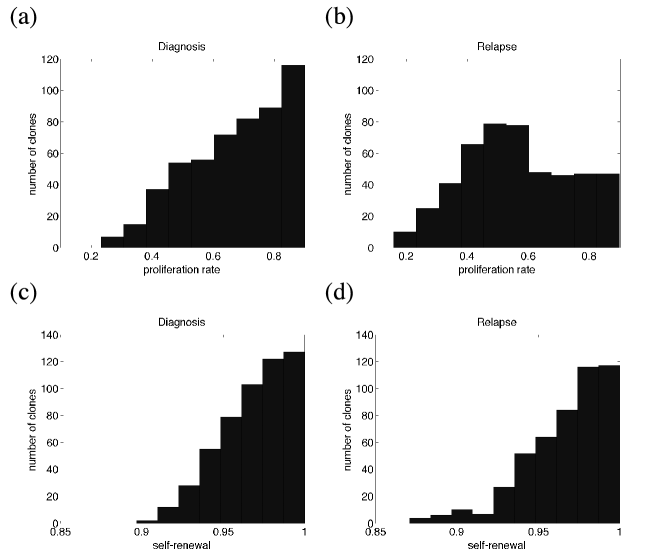
Simulations indicate that the clones significantly contributing to the leukemic cell mass have high proliferation rates and high self-renewal potential (high fraction of symmetric self-renewing divisions). Such configuration of parameters leads to an efficient cell expansion. The properties of clones contributing significantly to leukemic cell mass at diagnosis are depicted in Figure 2. This finding is identical for both considered models.
3.3 Clonality at relapse
The clonality at relapse is comparable to the clonality at diagnosis. Rarely more than three clones significantly contribute to the total leukemic cell mass. This finding is the same for both considered models.
3.4 Properties of clones at relapse
The properties of the leukemic clones responsible for relapse depend on the efficiency of chemotherapy. We run computer simulations for varied efficiency of chemotherapy, namely different death rates imposed on mitotic cell compartments. In the case of inefficient chemotherapy, i.e. killing rates of mitotic cells being relatively small, the clones present at diagnosis are also responsible for relapse. These clones have high proliferation rates and high self-renewal potential. In the case of more efficient chemotherapy, i.e. killing rates of mitotic cells being higher, the clones responsible for primary presentation differ from the clones responsible for relapse. Compared to the clones leading to primary presentation, the clones responsible for relapse have low proliferation rates but high self-renewal potential. The properties of clones contributing significantly to leukemic cell mass at diagnosis and at relapse are depicted in Figure 3. Both models lead to similar results.
The result that slow cycling is an important selective mechanism is compatible with the finding that cells in minimal residual disease samples are highly quiescent [6]. It is further supported by the fact that addition of anthracyclines, which act independent of cell cycle [62], leads to improved outcome of relapse therapies in ALL [63].
3.5 Treatment of relapse
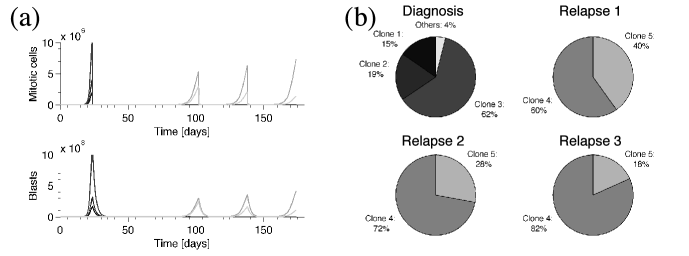
If the same treatment strategy as in case of primary treatment is applied to a relapsed patient, remission time is significantly shorter (Fig. 4). Second relapse is mostly triggered by the same clones as primary relapse. With repeated chemotherapy, clonal composition changes in favor of the clones with minimal proliferation (Clone 5 in Fig. 4). This finding is in agreement with data from clinical practice in ALL suggesting that the clones selected for at relapse possess inherently reduced sensitivity to treatment [5] and may be also responsible for second relapse [5]. The dynamics of leukemic cells in our model are in good agreement with data from clinical practice: Chemotherapy is able to reduce leukemic cell load after relapses [4], nevertheless this reduction does not lead to durable remission [63]. This reflects the worse prognosis of relapsed patients [13, 64, 63]. The increasing fraction of cells with reduced drug sensitivity predicted by the simulations explains the experimental finding that cells present at relapse are more resistant to chemotherapy than cells present at initial diagnosis [13, 64]. It also shows that repetition of the same induction therapy leads to worse results in relapse compared to primary manifestation [63]. The selection of slowly cycling cells predicted by our model seems to be an important mechanism in AML. It it was demonstrated that induction of cell cycling enhances chemo-sensitivity of leukemic cells [65] and improves patient outcome after therapy [66]. Our model suggests that repeated chemotherapy can lead to the selection of clones that are not competitive in natural environment, i.e. that can be outcompeted by clones sensitive to chemotherapy after cessation of the treatment.
3.6 Short term expansion efficiency does not correlate with long term self-maintenance
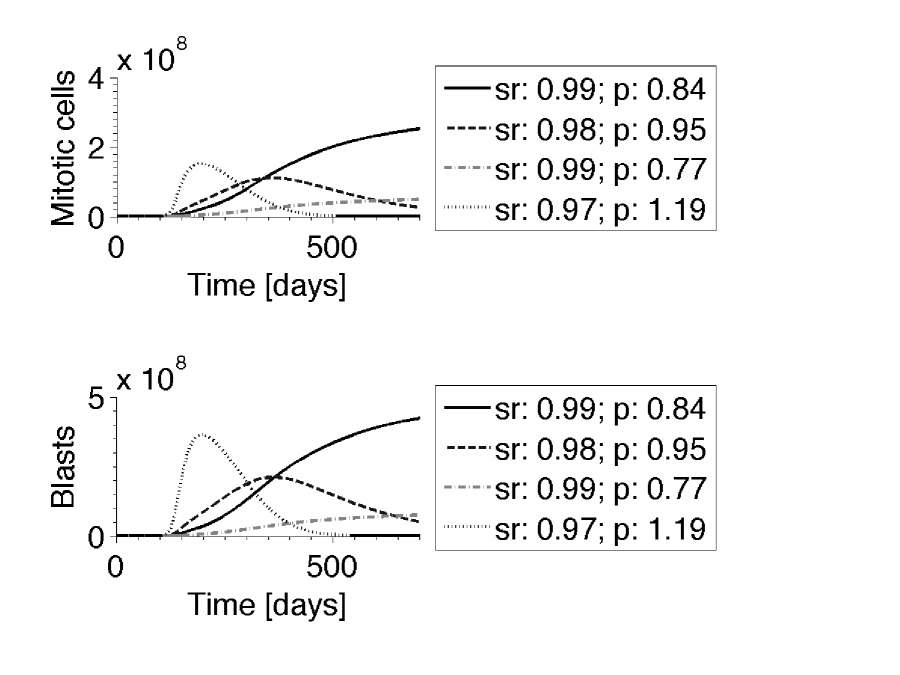
If leukemic cell behaviour depends on hematopoietic cytokines (Model 1), the current signalling environment influences expansion of leukemic clones. In this scenario it is possible that fast proliferating cells with low self-renewal potential dominate the leukemic cell mass during an initial phase. If, with increasing leukemic cell mass, self-renewal becomes down-regulated, e.g. due to occupation of bone marrow niche, eventually the cell clone with the highest affinity to self-renewal survives, although its proliferation might be slow. An example of time evolution during an early phase is depicted in Fig. 5.
3.7 Late relapses can originate from clones that were already present at diagnosis
Simulations of Model 1 indicate that late relapses, e.g., relapses after more that 3 years, can originate from clones that were already present at diagnosis but did not significantly contribute to the leukemic cell mass at that time. These relapses are triggered by very slow proliferating cells which survive chemotherapy and then slowly grow. At primary diagnosis fast proliferating clones dominate. The slowly proliferating clones are then selected by chemotherapy. This finding is able to explain relapses without additional mutations occurring after primary diagnosis. Thus, temporary risk factor exposure (e.g., chemicals or radiation) can be responsible also for very late relapses and presentations.
3.8 Comparison of simulations to patient data
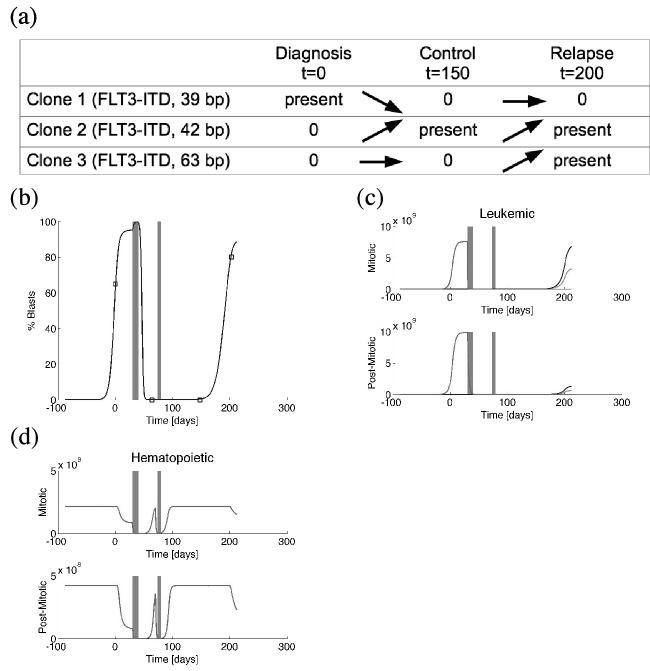
To check if the proposed modelling framework is consistent with the observed dynamics of leukemia, we calibrate the model to data of two patients with multiple relapses. The selected two patients showed different AML-typical mutations. Properties of leukemic cells and their impairment due to chemotherapy cannot be measured directly and the effects of specific mutations on cell dynamics are not well understood. The available data include time periods between induction/consolidation chemotherapy and relapse as well as the percentages of leukemic blasts in the bone marrow at diagnosis, follow-ups and relapse. In addition emergence and subsequent elimination of leukemia driving mutations (FLT3, MLL-PTD) in the bone marrow cells were precisely monitored using molecular biology methods [67, 68, 69]. We verify if, and under which assumptions concerning the cell behaviour, the proposed model is compatible with clinical observations. This can serve as a qualitative ’proof of principle’ and leads to hypotheses concerning changes in cell properties induced by the respective mutations. We assume that each mutation is associated with one leukemic cell clone. We interpret differences at diagnosis and at relapse as the result of a clonal selection process due to chemotherapy and cell properties. For this study we apply Model 2, since simulations over a large range of parameters showed that remissions shorter than 150 days are only compatible with Model 2.
Simulations of the evolution of leukemic clones in the two patients are depicted in Figures 6 and 7. The results show that bone marrow blast fraction can be well described by the model. In Patient 1 FLT3-ITD mutation of a length of 39 bp is detected at diagnosis. This mutation becomes extinct and the relapse is triggered by two different FLT3-ITD mutations (42 bp and 63 bp). This behaviour is reproduced in the model simulation. At diagnosis leukemic cell mass is mainly derived from one clone while at relapse two different clones contribute to leukemic cell mass.
In Patient 2 FLT3-ITD mutation and MLL-PTD-mutation were both detected at diagnosis. The MLL-PTD mutation practically did not contribute to relapse. The model reflects this scenario. At diagnosis two different clones contribute to leukemic cell mass, one of which becomes extinct and is not detected at the relapse. In this patient the clone responsible for relapse behaves similarly to the HSC lineage. Thus, classical cytotoxic treatment would not lead to its eradication. This is an indication for application of new anti-leukemic drugs, if feasible, or for bone marrow transplantation.
4 Discussion
We have examined the impact of cell properties on clonal evolution in acute leukemias during the course of disease. We have considered two different mathematical models, representing different modes of interactions between normal hematopoietic and leukemic cells. In Model 1 leukemic cells depend on hematopoietic cytokines, niches or other environmental factors. In Model 2 the leukemic cells are independent of these aforementioned determinants and the only interaction between benign and malignant cells is due to a competition for bone marrow space.
Model simulations suggest that clones with a high proliferation rate and a high self-renewal are favoured at primary diagnosis. The results indicate that the number of clones significantly contributing to the leukemic cell mass is relatively small, even if a large number of clones with different leukemia driving mutations might coexist in the bone marrow. For example, in our simulations it was reduced from 50 to 2-5. This result is in agreement with data from recent gene sequencing studies and allows to explain these data. In these studies [1, 15] at most 4 contributing clones were detected in case of AML and at most 10 in case of ALL. In many patients this number was even smaller. Our study implies that clonal selection due to different growth characteristics is an efficient mechanism to reduce the number of clones contributing to leukemic cell burden. Clones not contributing to primary disease manifestations might rest in a slowly proliferating or quiescent state and expand at relapse. Chemotherapy exerts a strong selective pressure on leukemic clones and thus has a considerable impact on the clonal composition during relapse.
In the case of insufficient chemotherapy, the relapse can be triggered by the same clones as the primary disease. In the case of more intensive therapy regimens, relapses are mostly triggered by different clones than primary disease. This has also been concluded from experimental studies [1]. Our models suggest that chemotherapy selects for slowly proliferating clones with high self-renewal property. Depending on efficiency of the therapy, it is also possible that clones with high proliferation and high self-renewal potential are responsible for relapse.
In the present study we have focused on classical cytotoxic chemotherapy, mostly acting on mitotic cells. This explains selection of slowly proliferating clones, among which those with high self-renewal potential have a competitive advantage, as shown in earlier studies [23, 24, 25]. High proliferation rates constitute a disadvantageous factor under cytotoxic treatment, since fast proliferating cells are responsive to even moderately intensive therapy regimens. Relapses due to such clones are only possible if LSCs at the same time have a high self-renewal potential, which is an advantageous factor for expansion and survival. Otherwise they would be out-competed by slowly proliferating cells with high self-renewal. Fast proliferating cells with low self-renewal have never been observed at relapse in our simulations. Their emergence at relapse could only be explained by additional mutations acquired after initial treatment. The selection of slowly proliferating cells may explain emergence of resistance in relapses. In such case, applying an identical therapeutic regimen to primary presentation and relapse has limited effects in the absence of new mutations.
The principle of clonal competition in leukemia evolution and the fact that resistant subclones might be responsible for relapse have been discussed for a long time [5]. Using mathematical modelling, we have provided for the first time evidence that self-renewal potential is a major force behind this mechanism and that cells responsible for a relapse show high self-renewal in nearly all cases. This finding is new and cannot be concluded from biological data so far.
In the Appendix we study a model that includes occurrence of new mutations in addition to the selection process. In this scenario the number of clones detectable at diagnosis and at relapse and their respective properties are practically identical to the scenario without mutations. This finding underlines that clonal selection has an important impact on the evolution of leukemic cell properties.
The exact nature of interaction between leukemic and hematopoietic cells is not well understood. Moreover, it is well known that leukemias show high inter-individual heterogeneity concerning symptoms and survival [70]. Therefore, it is possible that different mechanisms may be relevant in different cases. Simulation results suggest that the evolving cell properties are robust with respect to the assumptions on the exact mode of interaction between hematopoietic and leukemic cells and are similar in different scenarios and different patients. Common features of both models are: (i) Relapses can be explained by cells that were already present at diagnosis. (ii) Before therapy clonal evolution selects for cells with high proliferation rate and high self-renewal. (iii) Cytotoxic treatment selects for cells with slow proliferation and high self-renewal. Thus, it is possible to draw conclusions on leukemic cell properties, even if their interaction with the healthy hematopoiesis is not known in detail.
Nevertheless the two proposed models exhibit some different dynamical properties, namely: (i) Complete remissions lasting shorter than 150 days are only possible in Model 2. (ii) In Model 2 it is possible that leukemic and non-leukemic cells coexist at ratios compatible with sufficient hematopoiesis for long times. (iii) In Model 1 clones can temporarily expand and then be outcompeted. In Model 2 the clone with fastest expansion is dominant for all times until treatment. (iv) In Model 2 leukemic cell load can be reduced to a new steady state under chronic application of cytostatic drugs. In Model 1 expansion of leukemic cells can be reduced in speed but eventually healthy hematopoiesis will be outcompeted. This may have application in treatment of fast relapsing patients, since fast relapse can only be explained by Model 2.
Up to now it cannot be decided which model is more realistic. For each of the models there exist supportive findings. Model 1 is supported by observations on expression of growth factor receptors by leukemic cells similar to those by hematopoietic cells [49, 50], expansion of leukemic cells in presence of cytokines in some patients [71] and dependence of leukemic cell self-renewal and proliferation on chemokines needed for hematopoietic cell maintenance [72]. The facts supporting Model 2 are enhanced cell death in marrow samples [73] and increased markers for cell death/cell lysis in serum [29, 74], independence of leukemic cells from important environmental signalling cues in presence of some mutations [26] and necessity of physical contacts to marrow stromal cells needed for cell survival [53, 54, 55]).
Our models support the hypothesis that processes of clonal selection are important mechanisms of leukemia relapse, which can be responsible for expansion of different cell clones without a need for new mutations. A testable prediction of our models is that more sensitive methods should reveal larger numbers of different clones that exist but do not significantly contribute to the leukemic cell mass. Another prediction is that cells present at relapse show mutations responsible for high self-renewal.
Calibration of the models to patient data shows that the proposed framework is compatible with the observed clinical course in the considered two data sets. The predicted selection of slowly proliferating cells with high self-renewal ability is consistent with clinical observations. Our results may have relevance for personalised medicine. Deep sequencing techniques might provide information on the genetic interdependence of the clones present at diagnosis and relapse [1]. Our model suggests that insufficient therapy may lead to presence of the same clones at diagnosis and relapse. If the clones present at diagnosis and relapse are not identical but related, i.e., they share common somatic mutations [1], relapse may be due to a selection process. In this case it is probable that the clones present at relapse show a slow proliferation and a high self-renewal. One possible implication might be the application of cell-cycle independent drugs, such as those used in targeted therapies.
Acknowledgements
This work was supported by the Collaborative Research Center, SFB 873 ”Maintenance and Differentiation of Stem Cells in Development and Disease”. AM-C was supported by ERC Starting Grant ”Biostruct” and Emmy-Noether-Programme of German Research Council (DFG). The authors would like to thank Professor Marek Kimmel for many helpful advice during preparation of the manuscript.
References
- [1] Ding L, Ley TJ, Larson DE, Miller CA, Koboldt DC, Welch JS, Ritchey JK, Young MA, Lamprecht T, McLellan et al. 2012 Clonal evolution in relapsed acute myeloid leukaemia revealed by whole-genome sequencing. Nature 481: 506-10.
- [2] Bonnet D, Dick JE. 1997 Human acute myeloid leukemia is organised as a hierarchy that originates from a primitive hematopoietic cell.Nat Med 3: 730-7.
- [3] Hope KJ, Jin L, Dick JE. 2004 Acute Myeloid leukemia originates from a hierarchy of leukemic stem cell classes that differ in self-renewal capacity. Nat Immunology 5: 738-43.
- [4] Van Delft FW, Horsley S, Colman S, Anderson K, Bateman C, Kempski H, Zuna J, Eckert C, Saha V, Kearney L, et al. 2011 Clonal origins of relapse in ETV6-RUNX1 acute lymphoblastic leukemia. Blood 117: 6247-54.
- [5] Choi S, Henderson MJ, Kwan E, Beesley AH, Sutton R, Bahar AY, Giles J, Venn NC, Pozza LD, Baker DL, et al. 2007 Relapse in children with acute lymphoblastic leukemia involving selection of a preexisting drug-resistant subclone. Blood 110: 632-9.
- [6] Lutz C, Woll PS, Hall G, Castor A, Dreau H, Cazzaniga G, Zuna J, Jensen C, Clark SA, Biondi A,et al. 2013 Quiescent leukaemic cells account for minimal residual disease in childhood lymphoblastic leukaemia. Leukemia 27: 1204-7.
- [7] Jan M, Majeti R. 2013 Clonal evolution of acute leukemia genomes. Oncogene 32: 135-40.
- [8] Parkin B, Ouillette P, Li Y, Keller J, Lam C, Roulston D, Li C, Shedden K, Malek SN. 2013 Clonal evolution and devolution after chemotherapy in adult acute myelogenous leukemia. Blood 121: 369-77.
- [9] Bachas C, Schuurhuis GJ, Assaraf YG, Kwidama ZJ, Kelder A, Wouters F, Snel AN, Kaspers GJ, Cloos J. 2012 The role of minor subpopulations within the leukemic blast compartment of AML patients at initial diagnosis in the development of relapse. Leukemia 26: 1313-20.
- [10] Sprouffske K, Merlo LM, Gerrish PJ, Maley CC, Sniegowski PD. 2012 Cancer in light of experimental evolution. Curr Biol 22: R762-71.
- [11] Podlaha O, Riester M, De S, Michor F. 2012 Evolution of the cancer genome. Trends Genet 28: 155-63.
- [12] Greaves M, Maley CC. 2012 Clonal Evolution In Cancer. Nature 481: 306-13.
- [13] Klumper E, Pieters R, Veerman AJ, Huismans DR, Loonen AH, Hählen K, Kaspers GJ, van Wering ER, Hartmann R, Henze G 1995 In vitro cellular drug resistance in children with relapsed/refractory acute lymphoblastic leukemia. Blood 86: 3861-8.
- [14] Ran D, Schubert M, Taubert I, Eckstein V, Bellos F, Jauch A, Chen H, Bruckner T, Saffrich R, Wuchter P, et al. 2011 Heterogeneity of leukemia stem cell candidates at diagnosis of acute myeloid leukemia and their clinical significance. Exp Hematol 40: 155-65.
- [15] Anderson K, Lutz C, van Delft FW, Bateman CM, Guo Y, Colman SM, Kempski H, Moorman AV, Titley I, Swansbury J, et al. 2011 Genetic variegation of clonal architecture and propagating cells in leukaemia. Nature 469: 356-61.
- [16] Lutz C, Hoang VT, Buss E, Ho AD. 2012 Identifying leukemia stem cells - Is it feasible and does it matter? Cancer Lett 338: 10-14.
- [17] Mardis ER, Ding L, Dooling DJ, Larson DE, McLellan MD, Chen K, Koboldt DC, Fulton RS, Delehaunty KD, McGrath SD, et al. 2009 Recurring mutations found by sequencing an acute myeloid leukemia genome. N Engl J Med 361:1058-66.
- [18] Ley TJ, Mardis ER, Ding L, Fulton B, McLellan MD, Chen K, Dooling D, Dunford-Shore BH, McGrath S, Hickenbotham M, et al. 2008 DNA sequencing of a cytogenetically normal acute myeloid leukaemia genome. Nature 456: 66-72.
- [19] Roeder I. 2006 Quantitative stem-cell biology: computational studies in the Hematopoietic system. Curr Opinion Hematol 13: 222-8.
- [20] Foley C, Mackey MC. 2009 Dynamic hematological disease: a review. J Math Biol 58: 285-322.
- [21] Whichard ZL, Sarkar CA, Kimmel M, Corey SJ. 2010 Hematopoiesis and its disorders: a systems biology approach. Blood 115: 2339-47.
- [22] Manesso E, Teles J, Bryder D, Peterson C. 2013 Dynamical modelling of haematopoiesis: an integrated view over the system in homeostasis and under perturbation. J R Soc Interface 10: 20120817.
- [23] Marciniak-Czochra A, Stiehl T, Jäger W, Ho AD, Wagner W. 2009 Modeling of asymmetric cell division in hematopoietic stem cells – regulation of self-renewal is essential for efficient repopulation. Stem Cells Dev 18: 377-85.
- [24] Stiehl T, Marciniak-Czochra A. 2011 Characterization of stem cells using mathematical models of multistage cell lineages. Mathematical and Computer Modelling 53: 1505-17.
- [25] Stiehl T, Marciniak-Czochra A. 2012 Mathematical modelling of leukemogenesis and cancer stem cell dynamics. Math. Mod. Natural Phenomena 7: 166-202.
- [26] Hayakawa F, Towatari M, Kiyoi H, Tanimoto M, Kitamura T, Saito H, Naoe T. 2000 Tandem-duplicated Flt3 constitutively activates STAT5 and MAP kinase and introduces autonomous cell growth in IL-3-dependent cell lines. Oncogene 19: 624-31.
- [27] Reilly JT. 2003 FLT3 and its role in the pathogenesis of acute myeloid leukaemia. Leuk Lymphoma 44: 1-7.
- [28] Polak R, Buitenhuis M. 2012 The PI3K/PKB module as key regulator of hematopoiesis: implications for therapeutic strategies in leukemia. Blood 119: 911-23.
- [29] Fanin R, Zuffa E, Fasola G, Damiani D, Gallizia C, Michieli MG, Marcuzzi P, Russo D, Visani G, Resegotti L. 1989 Serum lactate dehydrogenase is an important risk determinant in acute lymphocytic leukemia. Haematologica 74: 161-65.
- [30] Buechner T, Heinecke A. 1996 The role of prognostic factors in acute myeloid leukemia. Leukemia 10 Suppl. 1: S28-29.
- [31] Kornberg A, Polliack A. 1980 Serum lactic dehydrogenase (LDH) levels in acute leukemia: marked elevations in lymphoblastic leukemia. Blood 56: 351-5.
- [32] Welch JS, Ley TJ, Link DC, Miller CA, Larson DE, Koboldt DC, Wartman LD, Lamprecht TL, Liu F, Xia J, et al. 2012 The origin and evolution of mutations in acute myeloid leukemia. Cell 150: 264-78.
- [33] Jan M, Snyder TM, Corces-Zimmerman MR, Vyas P, Weissman IL, Quake SR, Majeti R 2012 Clonal evolution of preleukemic hematopoietic stem cells precedes human acute myeloid leukemia. Sci Transl Med. 4: 149ra118.
- [34] Marciniak-Czochra A, Stiehl T, Wagner W. 2009 Modeling of Replicative Senescence in Hematopoietic Development. Aging (Albany NY) 1: 723-32.
- [35] Nakata Y, Getto P, Marciniak-Czochra A, Alarcon T. 2012 Stability analysis of multi-compartment models for cell production systems. J Biol Dyn 6 Suppl. 1: 2-18.
- [36] Getto P, Marciniak-Czochra A, Nakata Y, dM Vivanco M. Global dynamics of two-compartment models for cell production systems with regulatory mechanisms. Math Biosci. accepted.
- [37] Jandl JH. 1996 Blood cell formation. In: Jandl JH, editor. Textbook of Hematology. pp. 1-69. Boston, MA: Littel Brown and Company.
- [38] Lansdorp PM. 1998 Stem cell biology for the transfusionist. Vox Sang 74 Suppl. 2: 91-4.
- [39] Rodriguez-Brenes IA, Wodarz D, Komarova NL 2013 Stem cell control, oscillations, and tissue regeneration in spatial and non-spatial models. Front Oncol 3: 82.
- [40] Layton JE, Hockman H, Sheridan WP, Morstyn G. 1989 Evidence for a novel in vivo control mechanism of granulopoiesis: mature cell-related control of a regulatory growth factor. Blood 74: 1303-7.
- [41] Metcalf D. 2008 Hematopoietic cytokines. Blood 111: 485-91.
- [42] Fried W. 2009 Erythropoietin and erythropoiesis. Exp Hematol 37: 1007-15.
- [43] Aglietta M, Piacibello W, Sanavio F, Stacchini A, Apra F, Schena M, Mossetti C Carnino F, Caligaris-Cappio F, Gavosto F. 1989 Kinetics of human hemopoietic cells after in vivo administration of granulocyte-macrophage colony-stimulating factor. J Clin Invest 82: 551-7.
- [44] Marciniak-Czochra A, Stiehl T. 2011 Mathematical models of hematopoietic reconstitution after stem cell transplantation. In: Bock HG, Carraro T, Jaeger W, Koerkel S, Rannacher R, Schloeder JP, editors. Model Based Parameter Estimation: Theory and Applications. pp. 191-206. Heidelberg: Springer.
- [45] Stiehl T, Ho AD, Marciniak-Czochra A. 2013 The impact of CD34+ cell dose on engraftment after Stem Cell Transplantations: Personalised estimates based on mathematical modeling. Bone Marrow Transplant. doi: 10.1038/bmt.2013.138.
- [46] Lander A, Gokoffski K, Wan F, Nie Q, Calof A. 2009 Cell lineages and the logic of proliferative control. PLoS biology 7: 84-100.
- [47] Lo W, Chou C, Gokoffski K, Wan F, Lander A, Calof A, Nie Q. 2009 Feedback regulation in multistage cell lineages. Math Biosci Eng 6: 59-82.
- [48] Tsopra OA, Ziros PG, Lagadinou ED, Symeonidis A, Kouraklis-Symeonidis A, Thanopoulou E, Angelopoulou MK, Vassilakopoulos TP, Pangalis GA, Zoumbos NC. 2009 Disease-related anemia in chronic lymphocytic leukemia is not due to intrinsic defects of erythroid precursors: a possible pathogenetic role for necrosis factor-alpha. Acta Haematol 121: 187-95.
- [49] Shinjo K, Takeshita A, Ohnishi K, Ohno R 1997 Granulocyte colony-stimulating factor receptor at various differentiation stages of normal and leukemic hematopoietic cells. Leuk Lymphoma 25: 37-46.
- [50] Kondo S, Okamura S, Asano Y, Harada M, Niho Y. 1991 Human granulocyte colony-stimulating factor receptors in acute myelogenous leukemia.Eur. J. Haematol. 46: 223-20.
- [51] Griffin JD, Löwenberg B 1986 Clonogenic cells in acute myeloblastic leukemia. Blood 68: 1185-95.
- [52] Miraki-Moud F, Anjos-Afonso F, Hodby KA, Griessinger E, Rosignoli G, Lillington D, Jia L, Davies JK, Cavenagh J, Smith M, et al. 2013 Acute myeloid leukemia does not deplete normal hematopoietic stem cells but induces cytopenias by impeding their differentiation. PNAS 110: 13576-81.
- [53] Calvi LM, Adams GB, Weibrecht KW, Weber JM, Olson DP, Knight MC, Martin RP, Schipani E, Divieti P, Bringhurst FR, et al. 2003 Osteoblastic cells regulate the haematopoietic stem cell niche. Nature 425: 841-6.
- [54] Zhang J, Niu C, Ye L, Huang H, He X, Tong WG, Ross J, Haug J, Johnson T, Feng JQ, et al. 2003 Identification of the haematopoietic stem cell niche and control of the niche size. Nature 425: 836-41.
- [55] Garrido SM, Appelbaum FR, Willman CL, Banker DE 2001 Acute myeloid leukemia cells are protected from spontaneous and drug-induced apoptosis by direct contact with a human bone marrow stromal cell line (HS-5). Exp Hematol 29: 448-57.
- [56] Dommange F, Cartron G, Espanel C, Gallay N, Domenech J, Benboubker L, Ohresser M, Colombat P, Binet C, Watier H, et al. 2006 CXCL12 polymorphism and malignant cell dissemination/tissue infiltration in acute myeloid leukemia. FASEB J 20: 1913-5.
- [57] Berger M, Motta C, Boiret N, Aublet-Cuvelier B, Bonhomme J, Travade P. 1994 Membrane fluidity and adherence to extracellular matrix components are related to blast cell count in acute myeloid leukemia. Leuk Lymphoma 15: 297-302.
- [58] Tavor S, Petit I, Porozov S, Goichberg P, Avigdor A, Sagiv S, Nagler A, Naparstek E, Lapidot T. 2005 Motility, proliferation, and egress to the circulation of human AML cells are elastase dependent in NOD/SCID chimeric mice. Blood 106: 2120-7.
- [59] Loeffler H, Rastetter J, Haferlach T. 2000 Blood and Bone Marrow. In: Loeffler H, Rastetter J, Haferlach T, editors. Atlas of Clinical Hematology. pp. 27-291. Heidelberg: Springer.
- [60] Berger DP, Engelhardt R, Henss H. 2008 Basic Principles of Chemotherapy. In: Berger DP, Engelhardt R, Henss H, Mertelsmann R, editors. Concise Manual of Hematology and Oncology. pp. 65-8. New York: Springer.
- [61] Meyer JA, Wang J, Hogan LE, Yang JJ, Dandekar S, Patel JP, Tang Z, Zumbo P, Li S, Zavadil J, Levine RL, Cardozo T, Hunger SP, Raetz EA, Evans WE, Morrison DJ, Mason CE, Carroll WL. 2013 Relapse-specific mutations in NT5C2 in childhood acute lymphoblastic leukemia. Nat Genet 45: 290-4.
- [62] Dy GK, Adjei AA, 2006 Principles of Chemotherapy. In: Chang AE, Hayes DF, Pass HI, Stone RM, Ganz PA, Kinsella TJ, Schiller JH, Strecher VJ, editors Oncology- An Evidence-Based Approach. pp. 14-40. Heidelberg: Springer.
- [63] Chessells JM 1998 Relapsed lymphoblastic leukaemia in children: a continuing challenge. Br J Haematol 102: 423-28.
- [64] Bhatla T, Wang J, Morrison DJ, Raetz EA, Burke MJ, Brown P, Carroll WL. 2012 Epigenetic reprogramming reverses the relapse-specific gene expression signature and restores chemosensitivity in childhood B-lymphoblastic leukemia. Blood 119:5201-10.
- [65] Saito Y, Uchida N, Tanaka S, Suzuki N, Tomizawa-Murasawa M, Sone A, Najima Y, Takagi S, Aoki Y, Wake A, et al. 2010 Induction of cell cycle entry eliminates human leukemia stem cells in a mouse model of AML. Nat Biotechnol 28: 275-80.
- [66] Löwenberg B, van Putten W, Theobald M, Gmür J, Verdonck L, Sonneveld P, Fey M, Schouten H, de Greef G, Ferrant A, et al. 2003 Effect of priming with granulocyte colony-stimulating factor on the outcome of chemotherapy for acute myeloid leukemia. N Engl J Med 349: 743-52.
- [67] Schnittger S, Kern W, Tschulik C, Weiss T, Dicker F, Falini B, Haferlach C, Haferlach T. 2009 Minimal residual disease levels assessed by NPM1 mutation-specific RQ-PCR provide important prognostic information in AML.Blood 114: 2220-31.
- [68] Thiede C, Steudel C, Mohr B, Schaich M, Schaekel U, Platzbecker U, Wermke M, Bornhaeuser M, Ritter M, Neubauer A, et al. 2002 Analysis of FLT3-activating mutations in 979 patients with acute myelogenous leukemia: association with FAB subtypes and identification of subgroups with poor prognosis. Blood 99: 4326-35.
- [69] Weisser M, Kern W, Schoch C, Hiddemann W, Haferlach T, Schnittger S. 2005 Risk assessment by monitoring expression levels of partial tandem duplications in the MLL gene in acute myeloid leukemia during therapy. Haematologica 90: 881-9.
- [70] Liesveld JL, Lichtman MA. 2010 Acute Myelogenous Leukemia. In: Kaushansky K, Lichtman M, Beutler E, Kipps T, Prchal J, Seligsohn U, editors. Williams Hematology. pp. 1277-1330. New York: McGraw Hill.
- [71] Vellenga E, Young DC, Wagner K, Wiper D, Ostapovicz D, Griffin JD 1987 The effects of GM-CSF and G-CSF in promoting growth of clonogenic cells in acute myeloblastic leukemia. Blood 69: 1771-6.
- [72] Tavor S, Eisenbach M, Jacob-Hirsch J, Golan T, Petit I, Benzion K, Kay S, Baron S, Amariglio N, Deutsch V, et al. 2008 The CXCR4 antagonist AMD3100 impairs survival of human AML cells and induces their differentiation. Leukemia 22: 2151-8.
- [73] Irvine AE, Magill MK, Somerville LE, McMullin MF. 1998 Spontaneous intramedullary apoptosis is present in disorders other than myelodysplasia. Exp Hematol 26:435-9.
- [74] Yamauchi T, Negoro E, Lee S, Takai M, Matsuda Y, Takagi K, Kishi S, Tai K, Hosono N, Tasaki T, et al. 2013 A high serum uric acid level is associated with poor prognosis in patients with acute myeloid leukemia. Anticancer Res 33: 3947-51.
- [75] Crooks GM. 2010 Lymphopoiesis. In: Kaushansky K, Lichtman M, Beutler E, Kipps T, Prchal J, Seligsohn U, editors. Williams Hematology. pp. 1095-103. New York: McGraw Hill.
- [76] Neumeister B, Besenthal I, Boehm BO. 2009 Klinikleitfaden Labordiagnostik. Munich: Elsevier.
- [77] Harrison WJ. 1962 The total cellularity of the bone marrow in man. J Clin Pathol 15: 254-9.
- [78] Cartwright GE, Athens JW, Wintrobe MM. 1964 The kinetics of granulopoiesis in normal man. Blood 24: 780-803.
- [79] Klaus J, Herrmann D, Breitkreutz I, Hegenbart U, Mazitschek U, Egerer G, Cremer FW, Lowenthal RM, Huesing J, Fruehauf S et al. 2007 Effect of CD34 cell dose on hematopoietic reconstitution and outcome in 508 patients with multiple myeloma undergoing autologous peripheral blood stem cell transplantation. Eur J Haematol 78: 21-8.
- [80] Malinowska I, Stelmaszczyk-Emmel A, Wasik M, Rokicka-Milewska R. 2002 Apoptosis and pH of blasts in acute childhood leukemia. Med Sci Monit 8: CR441-7.
- [81] Savitskiy VP, Shman TV, Potapnev MP 2003 Comparative measurement of spontaneous apoptosis in pediatric acute leukemia by different techniques. Cytometry B Clin Cytom 56: 16-22.
- [82] Buxton ILO, Benet LZ. 2011 Pharmacokinetics: The Dynamics of Drug Absorption, Distribution, Metabolism and Elimination. In: Brunton LL, Chabner BA, Knollman BC, editors. Goodman and Gilman’s The Pharmacological Basis of Therapeutics. pp. 17-41. New York: McGraw Hill.
- [83] Werner B, Dingli D, Traulsen A. 2013 A deterministic model for the occurrence and dynamics of multiple mutations in hierarchically organised tissues. J. R. Soc. Interface 10: 20130349.
- [84] Ross SM. 1996 Stochastic Processes. New York: Wiley.
- [85] Ross SM. 2006 Simulation. London: Elsevier.
- [86] Klein RW, Roberts, SD. 1984 A time-varying Poisson arrival process generator Simulation 43: 193-195.
5 Appendix
5.1 Calibration of the hematopoietic cell lineage
In absence of leukemic clones, both considered models reduce to the same model of the hematopoietic system. In steady state this model has the following form
| (23) | |||||
| (24) | |||||
| (25) |
Assume we know and . It holds
| (26) | |||||
| (27) |
Knowing , we can calculate , such that the steady state population size is satisfied. We calibrate the model to the data on production of neutrophil granulocytes, which constitute the majority of mature white blood cells (). Lymphocytopoiesis is a complicated process involving lymphatic organs and not only the bone marrow [75]. Therefore, we restrict ourselves to the myeloid line. It holds for the steady state count of neutrophils [76], . We interpret as the total amount of mitotic neutrophil precursors in bone marrow. Based on the data from [59] we assume that about 20% of bone marrow cells are mitotic precursors of neutrophils (the interindividual variations are considerable). The total bone marrow cellularity is about cells per kg of body weight [77]. Therefore, we take
| (28) |
Assuming an average blood volume of 6 liters and an average body weight of 70 kg, we calculate a mature neutrophil count of
| (29) |
Neutrophils have half-life in blood stream, , of about 7 hours[78]. From this we calculate
| (30) |
We obtain
| (31) |
i.e., about once per 1.5 days. We know from bone marrow transplantation [79] that patients need about 15 days to reconstitute to neutrophils per liter of blood ( per kg ) after infusion of immature cells per kg of body weight. For
| (32) |
this constraint is met.
5.2 Model parameters
For the hematopoietic branch we chose parameters obtained from the calibration in the Section above. For simplicity we assume for the feedback mechanism in Model 1. We set the clearance rate of blasts (in absence of effects of overcrowding) to . This is based on the apoptotic indices (fraction of dying cells) reported in literature which are [80, 81]. Choosing blast clearance between and changes the speed of leukemic cell accumulation but, as revealed by additional simulations, not the cell properties that are selected.
We chose . In histological images of healthy adult bone marrow a large part of the bone marrow cavity consists of fat and connective tissue and is free of hematopoietic cells. To reflect this fact, we set , where is the steady state count of mitotic healthy cells. In the simulations, was set to . This choice implies that if bone marrow cell counts are three times higher than in the steady state, the additional death rate due to overcrowding is of the order of magnitude of mature cell clearance. The results remain unchanged qualitatively, even if values of vary within different orders of magnitude.
We apply chemotherapy on seven following days for 2 hours. Different treatment intervals lead to comparable results. In the depicted simulations has been set to values between and for less efficient therapy and to values between and for efficient chemotherapy. For different choices similar results are obtained. The higher , the stronger the selection for high self-renewal and slow proliferation and the lower the probability of relapse. The lower , the higher the probability that clones contributing to primary presentation are among clones contributing to relapse. For between 40 and 45, the obtained results are similar to the results obtained in experiments [1]. The parameters of the leukemic clones are chosen randomly from uniform distributions, assuming that cells divide at most twice per day and that self-renewal is between zero and one.
5.3 Calibration to patient examples
Both patients were treated within clinical trials at the University Hospital of Heidelberg after obtaining their written consent. Details on the patients’ characteristics and therapeutic regimens can be found in Supplemental Table 1. Model parameters can be found in Supplemental Tables 2 and 3. For both patients the presence of specific key mutations was assessed in clinical routine. We chose cases where mutations get lost due to treatment and new mutation are detected at relapse. We interpret this as the result of clonal evolution. Since the two patients harbour different mutations, their leukemic cells can have different properties. Chemotherapy is modeled by increasing death rates for mitotic cell types during the duration of each cycle. For simplicity, we did not model kinetics of single chemotherapeutic agents. Instead, the therapy-induced death rates are assumed to remain constant from the first to the last day of each treatment cycle. In pharmacology, the exposition to a drug is measured using the ’area under the curve’ (AUC). This is the integral of concentration (or drug effect) over time [82]. The AUC in our case is , where is the period of drug action. The AUC over one day of therapy is similar for the single patient examples and the simulations in Figure 3. Only myeloablative treatment before transplantation has a higher AUC. The presented results are based on Model 2. Model 1 is not compatible with remissions lasting less than 150 days. For simplicity we count all leukemic cell types as blasts.
5.4 Model with mutations
In the following we describe an extension of Model 1 which includes mutations. There is an evidence that a preleukemic HSC compartment serves as a reservoir of accumulated mutations [33]. This hypothesis is supported by the finding that some of the mutations recurrently observed in leukemia already exist in the HSC compartment of a majority of leukemia patients [33]. These preleukemic HSC seem to behave similarly to normal HSC [33]. The hypothesis is that a relatively small number of additional hits may transform these preleukemic HSC into LSC. Nevertheless details of the underlying dynamics are not well understood [33].
We make the following assumptions:
- •
-
•
For simplicity we assume that the influx of new LSC from the preleukemic compartment is constant in time. This assumption is made due to simplicity, since at the moment the dynamics of the preleukemic compartment is not well understood [33]. We neglect mutations leading from normal HSC, i.e. non-preleukemic HSC to LSC.
-
•
We assume that most mutations in LSC are acquired during replication of the genome and neglect other possible origins. In line with [7] we neglect mutations leading to dedifferentiation of non-LSC leukemic cells.
Let be the level of LSC of clone at time . The flux to mitosis is then . Out of mitosis we obtain , where is the fraction of LSC self-renewal of clone at time . We assume that the fraction of these cells is mutated, takes into account replication errors in relevant genes and is assumed to be constant. The influx of mutated LSCs due to new mutations occurring in clone at time is therefore .
We obtain the following set of equations describing dynamics of clone :
A similar system of equations has been obtained by Traulsen et al [83]. Since is considered to be postmitotic, we do not distinguish between cells that acquired a mutation during the divisions and those that did not.
The influx of mutated cells at time is given by
, where is the constant influx from the preleukemic compartment and the number of leukemic clones present at time .
We accept the rate as the rate of an inhomogeneous Poisson process. Poisson processes describe rare events [84, 85], therefore they are a suitable tool to model mutations. It is known from probability theory that, if is a jump time of the inhomogeneous Poisson with rate , then the next jump time can be generated by solving the equation for . Here is an uniformly distributed random variable [86]. We further know that if is uniformly distributed in then is exponentially distributed with parameter [85].
We simulate the system with mutations as follows: At time we draw an exponentially distributed random number with parameter . We simulate the system until the timepoint which fulfills . At timepoint a mutation occurs that gives rise to a new LSC. This is modelled by adding to the system a new LSC clone, consisting of one LSC and no less primitive leukemic cells. We assume that the mutation occurs in a random gene position therefore we assign random cell properties to the new clone, i.e. self-renewal and proliferation chosen randomly from uniform distributions (proliferation rate between and , self-renewal between and ). This choice is made for the sake of simplicity since details about the impact of mutations on cell behaviour and the underlying probability distributions are not known [1]. We then draw another random number and continue simulations until timepoint fulfilling , etc. We start simulations from the equilibrium of the hematopoietic system and one LSC with random properties.
The results obtained from these simulations are similar to the results from the model without mutations. At primary diagnosis cells show high self-renewal and high proliferation while at relapse cells show high self-renewal and reduced proliferation (Supplemental Figure 3). The proliferation rates differ significantly between diagnosis and relapse ( in Kruskal-Wallis Test), while self-renewal does not differ significantly ( in Kruskal-Wallis test).
| Patient 1 | Patient 2 | |
|---|---|---|
| Gender | Male | Male |
| Age at diagnosis | 63 | 60 |
| Diagnosis | AML | AML FAB M2 |
| Therapy |
Days 30-37 (Induction):
- Mitoxantron(10 ) (d 1-3) - AraC (2000 ) (d 1,3,5,7) Days 70-74 (Consolidation): - Mitoxantron(10 ) (d 1,2) - AraC (1000 ) (d 1,3,5) |
Days 1-7 (Induction I)
-AraC(100 )(d1-7) -DA(60)(d3-5) Days 23-29 (Induction II) -AraC(100 )(d1-7) -DA(60)(d3-5) Days 60-64 (Consolidation I) -AraC(6000 )(d1,3,5) Days 109-113 (Consolidation II) -AraC(6000 )(d1,3,5) Days 145-146 (Conditioning) -Allogeneic, HLA-identical HSCT (after Treosulfan/Fludarabin/ATG) |
| Cell Property | Clone 1 | Clone 2 | Clone 3 |
| Leukemic cell proliferation rate (1/days) | 0.25 | 0.25 | 1.2 |
| Leukemic cell self-renewal | 0.755 | 0.76 | 0.6 |
| Blast death rate (1/days) | 0.5 | 0.5 | 0.5 |
| (Induction) | 3 | 3 | 3 |
| (Consolidation) | 3 | 3 | 3 |
| Cell Property | Clone 1 | Clone 2 |
| Leukemic cell proliferation rate (1/days) | 0.45 | 1.2 |
| Leukemic cell self-renewal | 0.75 | 0.6 |
| Blast death rate (1/days) | 0.5 | 0.5 |
| (Induction I, II) | 3 | 3 |
| (Consolidation I, II) | 5 | 5 |
| (Conditioning) | 16 | 16 |


![[Uncaptioned image]](/html/1309.4246/assets/x3.png)