Charmonium-like states at BABAR
Abstract
We present new results on charmonium-like states from the BABAR experiment located at the PEP-II asymmetric energy collider at the SLAC National Accelerator Laboratory.
keywords:
1 Charmonium Spectroscopy
The charmonium spectrum consists of eight narrow states below the open charm
threshold (3.73 GeV/c2) and several tens of states above the threshold. Below the threshold almost
all states are well established. On the other hand, very little is known above the threshold, there are several new ”Charmonium-like” states that are very difficult to accommodate in the charmonium
spectrum.
The B-factories are an ideal place to study charmonium since charmonium states are
produced in four different processes:
-
1.
B decays, charmonium states of any quantum numbers can be produced
-
2.
Two photon production: in this process two virtual photons are emitted by the colliding pair ()), charmonium states with can be produced.
-
3.
Initial State Radiation (ISR): where a photon is emitted by the incoming electron or positron (), only states with are formed
-
4.
Double charmonium production: in this process a or a is produced together with another charmonium state.
2 Study of the process
The charmonium-like state Y(3940) was first seen by Belle [1] and then confirmed by BABAR [2] in the same B meson decay mode, but with lower mass and smaller width compared to the Belle results.
In a re-analysis [3] of the BABAR data which used the complete data sample, the precision of the Y(3940) measurements was improved and evidence for the decay X(3872) was reported. This confirmed an earlier unpublished Belle claim for the existence of this decay mode [4]. The latter was based on the behaviour of the invariant mass distribution near the X(3872), whereas the BABAR result is obtained directly from a fit the the mass distribution.
A subsequent paper from Belle [5] reports the observation in of a state, the X(3915), with mass and width values similar to those obtained for the Y(3940) in the BABAR analysis [2].
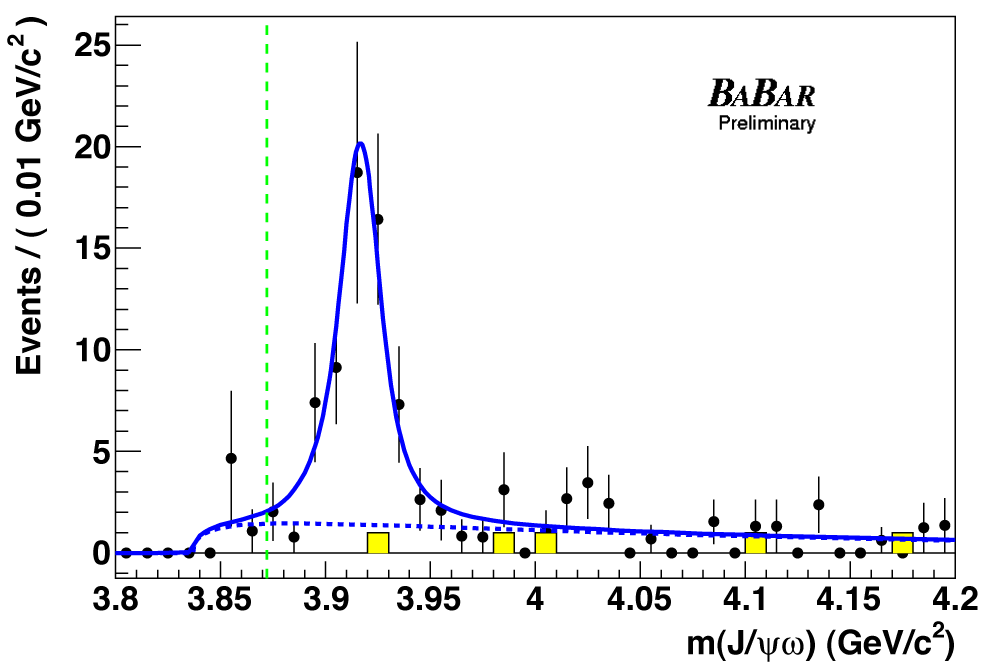
The BABAR analysis of the process has been performed in order to search for the X(3915) and the X(3872) resonances via the decay to , using a data sample of 519 fb-1. Figure 1 presents the reconstructed invariant mass distribution after all the selection criteria have been applied. We perform an extended maximum likelihood fit to the efficiency-corrected spectrum. A large peak at near 3915 MeV/c2 is observed with a significance of 7.6 . The measured resonance parameters are MeV/c2, MeV. The measured value of the two-photon width times the branching fraction, x is ( eV and eV for the spin hypotheses and , respectively, where the first error is statistical and the second is systematic. In addition, a Bayesian upper limit (UL) at 90% confidence level (CL) is obtained for the X(3872), x 1.7 eV, assuming J=2.

3 Search for the and
Belle reported the observation of two resonance-like structures, and in the study of , both decaying to [6].
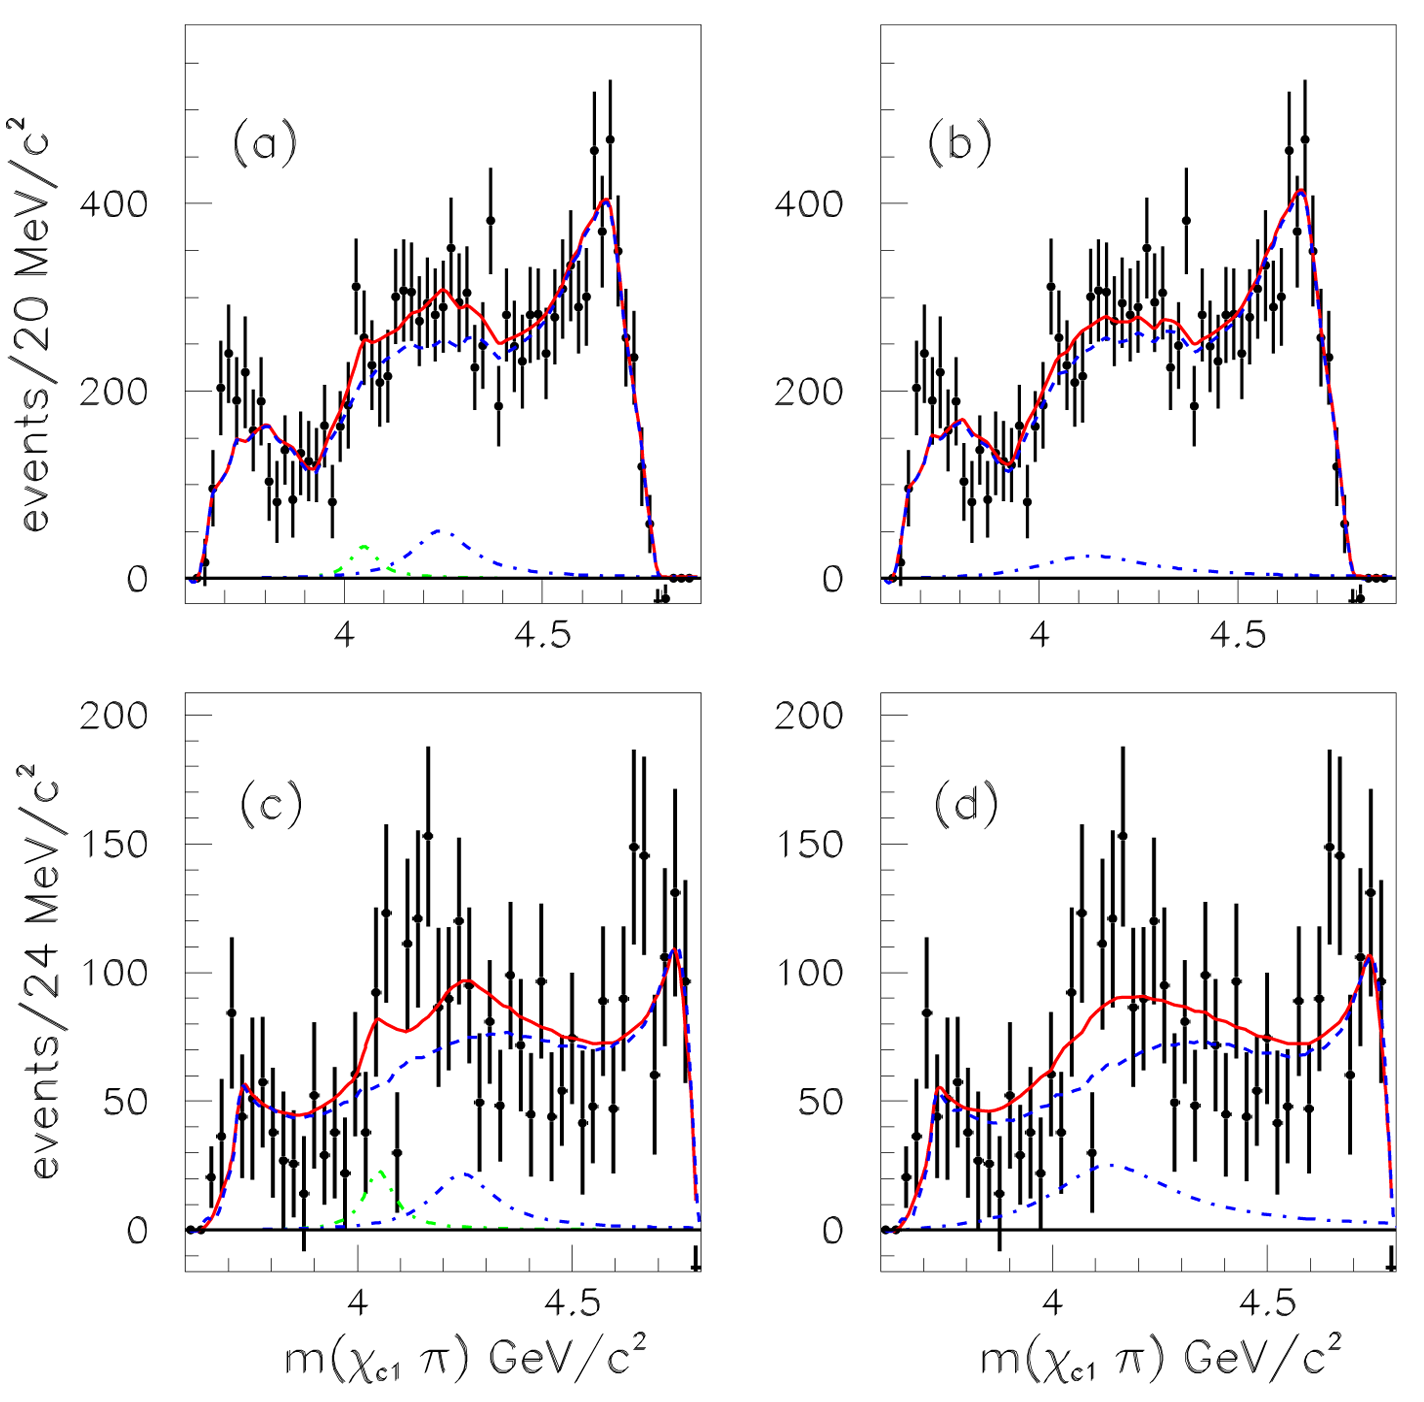
BABAR studied the same final states [7] to search for the and decay into in and (this mode is analyzed for the first time) where , using a data sample of 429 fb-1. The mass distribution, background-subtracted and efficiency-corrected, was modeled using the mass distribution and the corresponding normalized Legendre polynomial moments. Figure 2 shows the results of the fits to the mass spectra. The fit shown in Figure 2(a) includes both and resonances and the fit shown in Figure 2(b) includes a single broad resonance. Figures 2(c,d) show the mass spectrum fitted in the Dalitz plot region 1.0 1.75 GeV2/c4 in order to make a direct comparison to the Belle results [6] (this region is labeled as ”window” in Table 1). The results of the fits are summarized in Table 1 and in every case the yield significance does not exceed 2 . The ULs on the 90% CL on the branching fractions are: x 1.8 x 10⁻⁵; x 4.0 x 10-5 and x 4.7 x 10-5.
| Data | Resonances | Fraction (%) | ||
|---|---|---|---|---|
| a) Total | 1.1 | 1.61.4 | 57/57 | |
| 2.0 | 4.82.4 | |||
| b) Total | 1.1 | 4.03.8 | 61/58 | |
| a) Window | 1.2 | 3.53.0 | 53/46 | |
| 1.3 | 6.75.1 | |||
| b) Window | 1.7 | 1.378.0 | 53/47 |

4 Study of the system via Initial State Radiation (ISR)
The Y(4260) charmonium-like resonance was discovered by BABAR [8] in ISR production of . A subsequent Belle analysis [9] of the same final state suggested also the existence of an additional resonance around 4.1 GeV/c2 that they dubbed the Y(4008).
The BABAR analysis of the system produced in ISR has been repeated using a data sample of 454 fb-1 [10].
The mass region below 4 GeV/c2 is investigated for the first time.
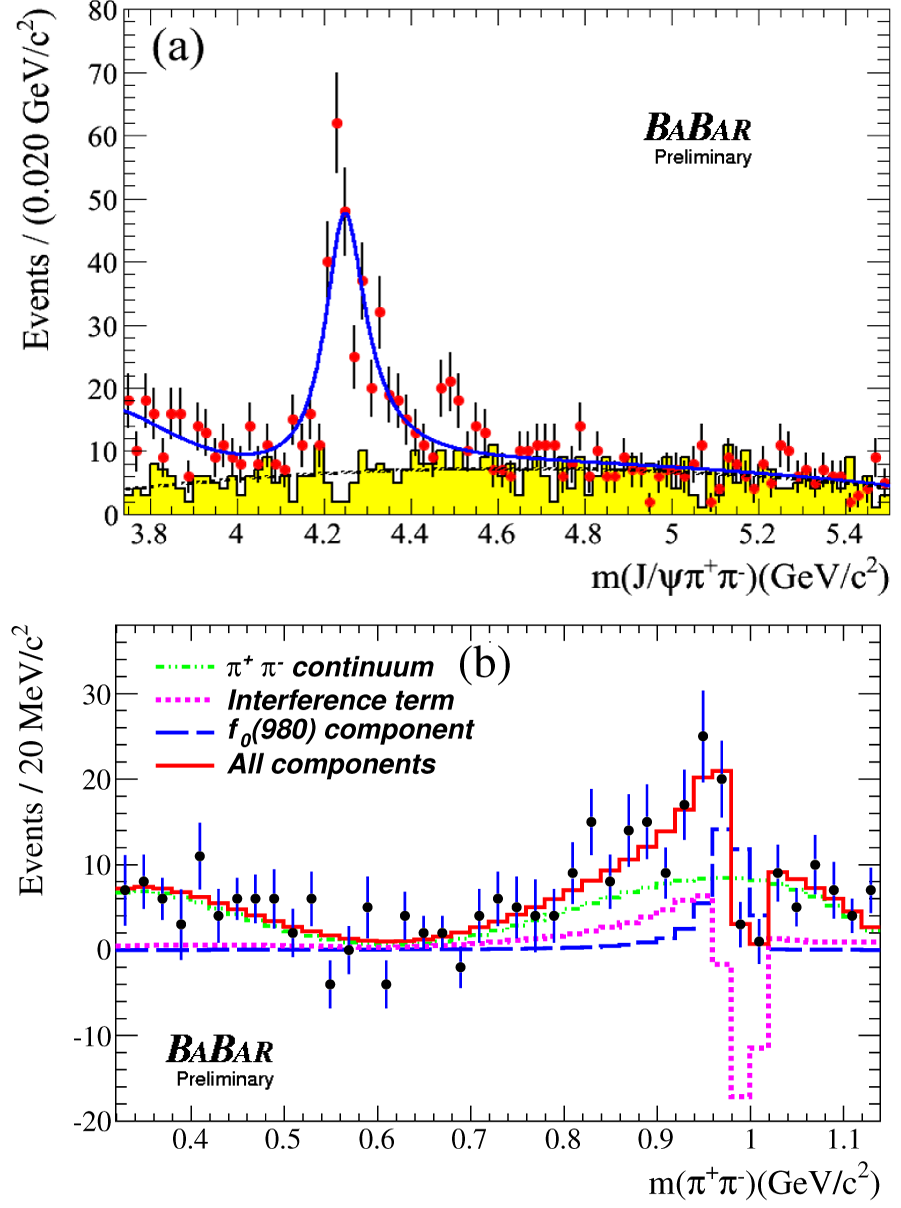
In that region an excess of events has been observed and the conclusion, after a detailed study of the lineshape (to estimate the tail contribution to that region), is that it is not possible to discount the possibility of a contribution from a continuum cross section in this region. From this study we obtain the cross section value 14.05 0.26 (stat) pb for radiative return to the and a measurement of the width (stat) keV. Figure 3(a) shows the fit to the distribution. A clear signal of the Y(4260) is observed for which the values obtained are MeV/c2, MeV and x (stat) 0.7 (syst) eV. No evidence for the state at 4 GeV/c2 reported by Belle [9] was seen. A study of the system from the Y(4260) decay to has been performed. The dipion system is in a predominantly S-wave state. The mass distribution exhibits an signal, for which a simple model indicates a branching ratio with respect to of 0.17 0.13 (stat). The fit to the dipion invariant mass distribution is shown in Figure 3(b).

5 Study of the system via ISR
The Y(4350) charmonium-like resonance was discovered by BABAR [11] in ISR production of . Belle, in [12] reported also the existence of an additional resonance around 4.660 GeV/c2.
The BABAR analysis studies the system produced via ISR using the full datasets collected at the , n=2,3,4; this corresponds to an integrated luminosity of 520 fb-1.
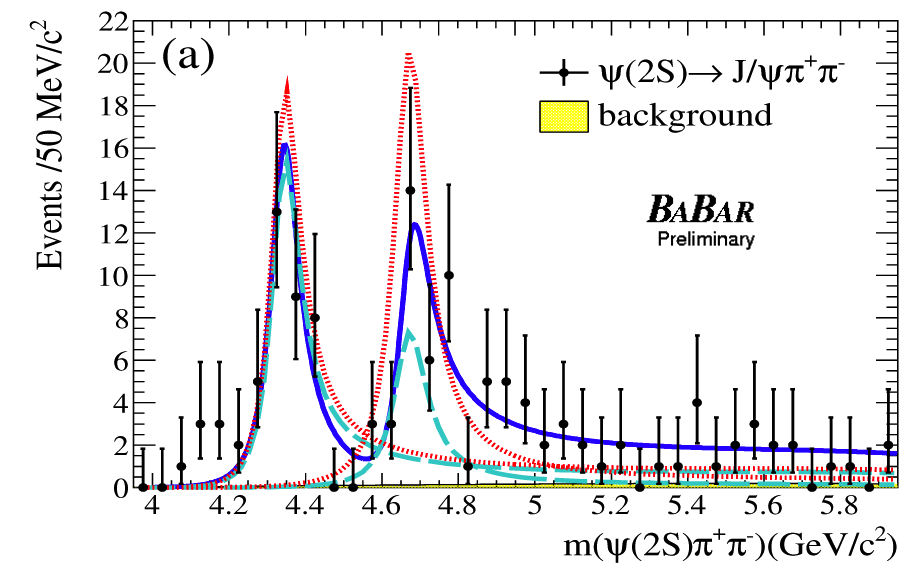
An unbinned extended-maximum-likelihood fit is performed to the invariant mass distribution and simultaneously to the background distribution. The result of the fit is shown in Figure 4.

In Table 2 the mass and width values obtained for the two resonances are reported.
| Resonance | Mass (MeV/c2) | (MeV) |
|---|---|---|
| Y(4360) | 4340169 | 943213 |
| Y(4660) | 4669213 | 1044810 |
References
- [1] S.-K. Choi et al. (Belle Collaboration), Phys. Rev. Lett. 94, 182002 (2005).
- [2] B. Aubert et al. (BABAR Collaboration), Phys. Rev. Lett. 101, 082001 (2008).
- [3] P. del Amo Sanchez et al. (BABAR Collaboration), Phys. Rev. D. 82, 011101(R) (2010).
- [4] Belle Collaboration, hep-ex/0505037.
- [5] S. Uehara et al. (Belle Collaboration), Phys. Rev. Lett. 104, 092001 (2010).
- [6] R. Mizuk et al. (Belle Collaboration), Phys. Rev. D 78, 072004 (2008).
- [7] J. P. Lees et al. (BABAR Collaboration), Phys. Rev. D 85, 052003 (2012).
- [8] B. Aubert et al. (BABAR Collaboration), Phys. Rev. Lett. 95, 142001 (2005).
- [9] C. Z. Yuan et al. (Belle Collaboration), Phys. Rev. Lett. 99, 182004 (2007).
- [10] BABAR Collaboration, http://arxiv.org/abs/1204.2158v1 hep-ex/1204.2158v1.
- [11] B. Aubert et al. BABAR Collaboration, Phys. Rev. Lett. 98, 212001 (2007).
- [12] X. L. Wang et al. (Belle Collaboration), Phys. Rev. Lett. 99, 142002 (2007).