The Innermost Regions of Relativistic Jets and Their Magnetic Fields
Magnetic Field Amplification and Blazar Flares
Abstract
Recent multiwavelength observations of PKS 0208-512 by SMARTS, Fermi, and Swift revealed that -ray and optical light curves of this flat spectrum radio quasars are highly correlated, but with an exception of one large optical flare having no corresponding gamma-ray activity or even detection. On the other hand, recent advances in SNRs observations and plasma simulations both reveal that magnetic field downstream of astrophysical shocks can be largely amplified beyond simple shock compression. These amplifications, along with their associated particle acceleration, might contribute to blazar flares, including the peculiar flare of PKS 0208-512. Using our time dependent multizone blazar emission code, we evaluate several scenarios that may represent such phenomena. This code combines Monte Carlo method that tracks the radiative processes including inverse Compton scattering, and Fokker-Planck equation that follows the cooling and acceleration of particles. It is a comprehensive time dependent code that fully takes into account the light travel time effects. In this study, both the changes of the magnetic field and acceleration efficiency are explored as the cause of blazar flares. Under these assumption, synchrotron self-Compton and external Compton scenarios produce distinct features that favor the external Compton scenario. The optical flares with/without gamma-ray counterparts can be explained by different allocations of energy between the magnetization and particle acceleration, which in turn can be affected by the relative orientation between the magnetic field and the shock flow. We compare the details of the observations and simulation, and highlight what implications this study has on our understanding of relativistic jets.
1 Introduction
As an extreme class of Active Galactic Nuclei (AGNs), blazars are known to emit electromagnetic waves in almost all frequencies that are currently being observed, extending from radio to -ray. They are also famous for being highly variable in an unpredictable manner. An immediate interesting question people begin to ask is whether blazar variations in different frequencies are correlated. If yes, how. For example, whether there are any time lags, what the amplitude relations are. The answers to these questions can identify important physical origins of those emission, including its location and mechanism. For one type of blazars, namely, flat spectrum radio quasars (FSRQs), the correlation between optical emission and GeV -rays is particularly interesting. These two energy bands represent the energies either at or beyond the peaks of the two components of their spectral energy distributions (SEDs). The photons in these energies are probably emitted by the most energetic particles, and hence exhibit most violent variations. Identification of these correlation became possible following the launch of Fermi, as well as the implementation of its supporting optical monitoring programs, such as the Yale/SMARTS program. In most cases the correlation between these two bands are established bonning_2012:smarts_blazar ; chatterjee_2012:smarts_similarity . However, chatterjee_2013:0208_opticalonly identified at least one case of such correlation breaking down (see also Fig. 2 of hess_2013:1510 ). In contrast to the "orphan" -ray flares occasionally found in BL lac objects krawczynski_etal:2004:1es1959 , these FSRQs show strong optical flares without -ray counterparts. The authors of chatterjee_2013:0208_opticalonly identified three major optical flares from PKS 0208-512, with highly correlated -ray activity in flares 1 and 3. But in flare 2, -ray remains at a low level. The question arises as why the same source exhibits correlated optical/-ray flares sometimes, but orphan optical flares at other times.
Since the optical emission is generally accepted to be produced by synchrotron emission urry_mushotzky:1982 , it is sensible to postulate that if the flare is caused by a change of the magnetic field, it may not have a direct effect on the higher energy emission. As a turbulent dynamo effect, it is known that magnetic field can be amplified by astrophysical shocks beyond simple shock compression. This has been proved both numerically guo_2012:mhd_bampli and analytically fraschetti_2013:analytical_bampli , and has been applied to explain observations of supernovae remnants (SNRs) parizot_2006:snr_bampli and -ray bursts (GRBs) mizuno_2011:mhd_bampli . If this kind of amplification is also at work in the shocks in the relativistic jets which presumably cause the blazar flares, it can be expected to explain the orphan optical flares.
chatterjee_2013:0208_implication studied these anomalous flares of PKS 0208-512 with non-time-dependent modeling. However, since blazar flares are naturally time-dependent phenomena, it is important to account for the timing information with time-dependent modeling. We will briefly describe the data handling in 2. The comparison between time-dependent modeling and the observation are presented in 3, followed by discussion in 4.
2 Multiwavelength data of PKS 0208-512
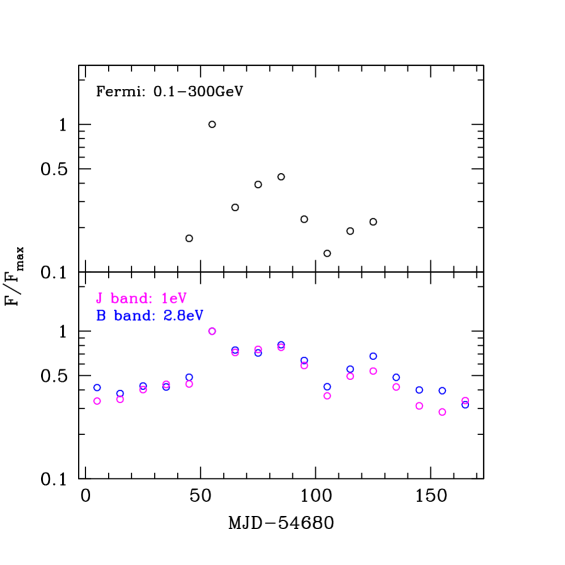
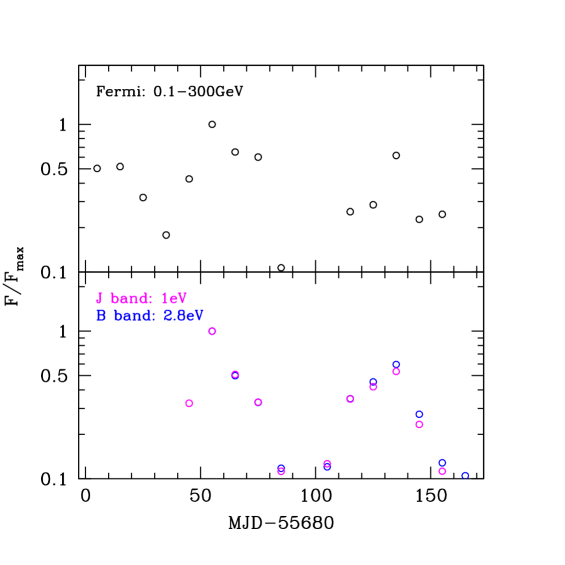
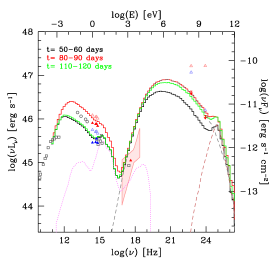
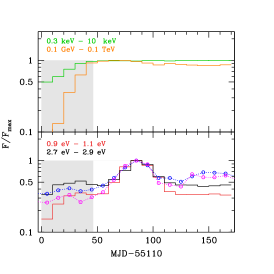
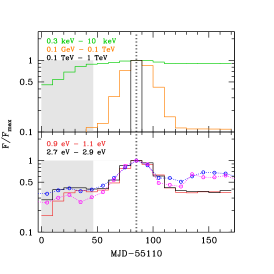
chatterjee_2013:0208_opticalonly presented the multiwavelength light curves of PKS 0208-512. Here we follow similar procedures, but keep the spectral index variable, and process the data in 10 day time bins. All the -ray data shown have test statistic larger than 25, which is comparable to 5 detections. The optical-infrared data are averages of the daily flux within 10 day bins. The high- and low- state SEDs from flares 1 and 2 are shown with the simulation results in Fig. 2-4. In Fig. 1 we show the light curves of flares 1 and 3 as identified by chatterjee_2013:0208_opticalonly . The light curves in optical and -rays show striking similarity with no apparent delay between the peaks in different energy. Flare 2 is not detected significantly in -rays in 10 day bins. We show its optical light curves together with the simulation results.
The X-ray data is obtained through the Swift-XRT data products generator evans_2009:swiftxrt_web , and fitted with the X-ray spectral fitting package XSPEC. During the time interval of interet (MJD 55190-55200), Swift-XRT only observed the source for one 1351s period on MJD 55195.
3 Modeling Results
We use the time-dependent inhomogeneous blazar model built by chen_etal:2011:multizone_code_mrk421 ; chen_etal:2012:424.789 to study the multiwavelength data set of PKS 0208-512. This model takes a axisymmetric cylindrical geometry. The volume is divided into many zones in radial and longitudinal directions to account for the inhomogeneity. This inhomogeneous blob travels relativistically in the AGN frame, and encounters a stationary shock structure. In the blob frame, it is the shock that travels through the blob and causes a change in the plasma condition, hence initiating the flare. For simplicity, this shock is treated as a flat structure. Monte Carlo method is used for the radiative transfer, so that all the light travel time effects (LTTEs) are taken into account. Fokker-Planck equation is used to follow the evolution of electrons, where synchrotron and inverse Compton (IC) cooling, as well as stochastic particle accleration and particle escape are present. The acceleration process is similar to those described by katarzynski_etal:2006:stochastic . It is a result of particle diffusion in momentum space, which mainly represents the second order Fermi process. The acceleration time scale is assumed to be independent of particle energy, while its spatial and time variations are treated manually, if any.
3.1 Pure SSC scenario
3.1.1 Brief change of magnetic field
We begin the investigation with a pure SSC scenario. In this case, five key parameters (magnetic field , electron density , volume length (or radius ), beaming Doppler factor , Lorentz factor of the injected low energy particle ) are constrained by 5 observables (synchrotron and IC peak frequencies , synchrotron and IC apparent luminosity , and variability time scale ). The parameters used are summarized in Table 1.
The flare is assumed to be caused by an increase of magnetic field energy density (by a factor of 20) immediately downstream of the stationary shock. The thickness of the region with increased magnetic field is of the length of the emitting blob. The same thickness is used in subsequent cases.
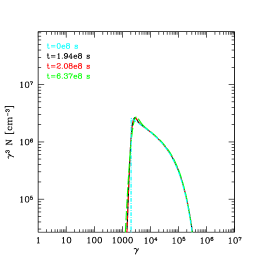
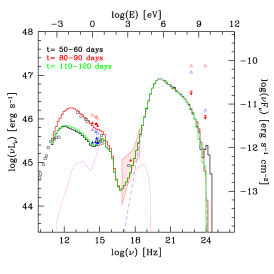
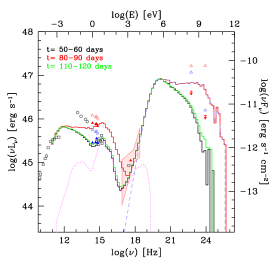
The results (SEDs, light curves, and electron distributions) of the modeling are shown in Fig. 2. In both optical and -ray bands, the blazar shows flaring behaviors, although the -ray flares seem to be more smoothed and spread out. The peak of the Fermi -ray light curve has a prominent delay compared to the peak of the optical light curve. The delay is roughly 10 days in this case, which is about 1/5 of the variability time scale. Both the delay and smoothing of the -ray light curve are caused by the internal LTTE of the SSC emission. The inconsistency between this delay and the lack of time delays in observations such as those shown in Fig. 1 indicate that the SSC with magnetic field strength change scenario does not explain the correlated flares in FSRQs for the geometries studied here. Neither does it explain the optical only flares obviously.
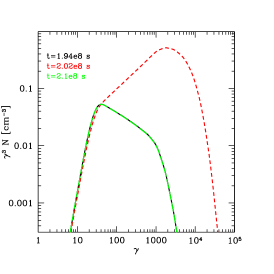
If the flare is not caused by a change in the magnetic field strength, but by some intrinsic change to the electrons, the time delay property might be different. However, in this constrained SSC scenario, the deduced strength of magnetic field is only in the quiescent state, making the cooling of the electrons quite slow compared to the flare time scale (see Fig. 2 right). One result of this slow cooling is that any change of the electrons (e.g. injection of new high energy electrons) will not be able to cool down to the quiescent state soon. The resulted light curves would have sharp rising time, but much longer decay time.
Another interesting implication of Fig. 2 is the presence of second order SSC emission above tens of GeV. Despite being largely suppressed by Klein-Nishina (KN) effect, the second order SSC does show up as an additional bump in the SED. Since the SEDs of some high redshift blazars such as 3C 279 albert_etal:2008:3C279_magic_detection and PKS 1424+240 furniss_2013:1424_redshift appear to have an up-curving shape at VHE after the correction of extragalactic background light (EBL) absorption, it is tempting to explain those SEDs with the second order SSC emission. However, PKS 1424+240 is classified as an intermediate-frequency peaked BL Lac (IBL) or high-frequency peaked BL Lac (HBL). The higher energy synchrotron peak of this source means it is very unlikely to show significant second order SSC emission due to strong KN suppression. Since these different types of blazars show similar up-curving SED only after EBL de-absorption, it is more natural to explain these curves as a result of the uncertainty in the EBL models used.
3.2 Dusty torus EC scenarios
With the difficulty met in a pure SSC scenario, we turn to external Compton (EC) process as the mechanism responsible for the -ray emission. We chose the emission from the dusty torus as the source of the external emission. The detection of FSRQs by imaging atmospheric Cherenkov telescopes (IACT) above 100GeV albert_etal:2008:3C279_magic_detection ; alksic_2011:1222_magic_detection:730.8 ; hess_2013:1510 locates the -ray emission site to be outside of the broad line region (BLR), otherwise the -rays would not be able to escape the absorption by the BLR photons tavecchio_2012:flat_blr . Compared to the pure SSC scenario, the EC scenario has one additional parameter, that is the energy density of the external photons. This parameter is connected to luminosity of the quasar thermal emission. However, the large uncertainty in the torus radius and covering factor means it is poorly constrained. So in the EC scenario, we fix the bulk Lorentz factor (and hence the Doppler factor , because we always use the line of sight to jet axis angle ) to 40, which is the value used in the SSC scenario. This is also close to the largest value determined in VLBI observation of quasar jets jorstad_etal:2005:VLBA .
3.2.1 Brief change of magnetic field
Fig. 3 shows the results of the EC case with the brief change of magnetic field strength as the cause of the flare. The magnetic field energy density is increased by a factor of 27 downstream of the shock. The results show that the optical emission is strongly variable, but the IC emissions remain relatively quiet. This is a fair reproduction of the orphan optical flare observed. However, this alone can not yet explain the co-existence of the orphan optical flares and the optical/-ray correlated flares. There must be other processes that are involved in the correlated flares.
| SSC | EC | |
|---|---|---|
| B(G) | 2 | |
| 40 | 40 | |
| 20 | ||
| 0.3 | ||
| 120 |
3.2.2 Brief change of acceleration efficiency
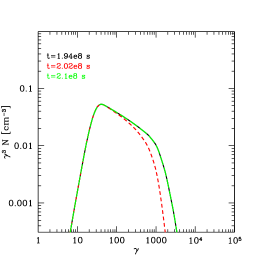
All current theories of magnetic field amplification involve the generation of strong turbulence. These strong turbulence can be expected to cause strong stochastic particle acceleration. Keeping this in mind, we also evaluate the effect of changing the particle acceleration efficiency ( shortened by a factor of 2.2) in a thin shocked layer. The results are shown in Fig. 4.
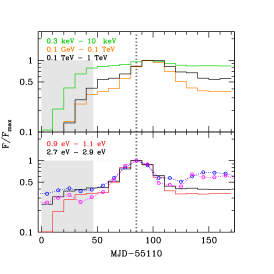
As seen in Fig. 4, the optical and -ray activities are well correlated, with no apparent delay. This proves that in the same EC scenario, optical/-ray correlated flares are also possible.
Another prominent feature of the results is the spectral hardening during the flare, both in synchrotron and IC emission. These spectral hardening is observed in Fermi monitored FSRQs abdo_etal:2010:spectral_properties_of_blazars . But in the narrow optical and infrared band, observation reveals a redder when brighter trend bonning_2012:smarts_blazar , most likely due to the contamination from the quasar thermal emission. This is also consistent with the simulated light curves in Fig. 4. Observations in a wider far-infrared band can better resolve the spectral behavior of the synchrotron component (see nalewajko_2012:1510_herschel , where Herschel sees a harder when brighter trend in PKS 1510-089).
Moreover, the simulation indicates that the SED extends to higher energy during the flare, causing a VHE -ray flare that is observable to ground based Cherenkov telescopes. This is because when the particle acceleration efficiency increases, the electron distribution does not only become harder, but also reaches larger maximum electron energy (see Fig. 4 right). For the same reason, the synchrotron emission also extends to higher energy, causing an ultrviolet flare and the intrusion of the synchrotron emission to the soft X-ray energy. The simultaneous multi-wavelength data we have for PKS 0208-512 are not sufficient to confirm these ultrviolet, X-ray and VHE behaviors. However, 3 other FSRQs have already been observed by Cherenkov Telescopes during flaring states albert_etal:2008:3C279_magic_detection ; alksic_2011:1222_magic_detection:730.8 ; hess_2013:1510 . The upcurving X-ray SED was recently observed in one FSRQ (PNM J2345-1555) during a major flare, accompanied by spectral hardening in GeV -ray gg_2013:2345_redblue . Our simulation suggests that these X-ray softening, ultraviolet/VHE -ray flaring, and far-infrared/-ray spectral hardening are related features of correlated optical/-ray flares. We suggest that strong spectral softening in X-ray monitoring and ultraviolet flares can be used as triggers for IACT observations in search of VHE emission from FSRQs.
4 Discussion
With our time dependent inhomogeneous blazar model, we studied blazar flares caused by changes of magnetic field and particle acceleration efficiency, in both SSC and EC scenarios. SSC was disfavored mainly because the model predicts a delay of the -ray emission, while observations show on average such delays are not prefered in FSRQs. In the EC scenario, change of particle acceleration efficiency can explain, during -ray flares of FSRQs, the spectral hardening of -rays, the rare detections at VHE -rays, and the upcurving X-ray SEDs. Based on this result, we recommend to include the softness of X-ray spectrum as an indicator in the search of VHE emission from FSRQs by IACTs.
We reproduced both orphan optical and optical/-ray correlated flares with the same quiescent-state emission setup in the EC scenario. The difference lies in the causes of the flares, i.e. whether the flare is caused by a change of magnetic field strength or particle acceleration efficiency. This difference can be attributed to the allocation of shock energy between magnetization and turbulence. This allocation further depends on the initial orientation of the magnetic field. mizuno_2011:mhd_bampli showed with MHD simulation that with magnetic field perpendicular to the shock flow, more energy is partitioned to the magnetic field, because the initial magnetic field is already compressed by the shock before any further turbulence induced amplification. We argue that this corresponds to the orphan optical flares, and the parallel magnetic field case corresponds to the optical/-ray correlated flares. At the same time, this perpendicular magnetic field case has a larger portion of compressed ordered magnetic field downstream of the shock, so we can expect the emission to have stronger optical polarization. Based on this interpretation, the increase in polarization will be accompanied by the increase in optical flux while its correlation with -ray flux will be weak. Hence the degree of polarization should correlate with the optical/-ray flux ratio. Whether this correlation exists awaits further confirmation from observations.
4.1 External Radiation Field
The source of external radiation in this study is assumed to be the dusty torus. However, the results in this study is qualitatively applicable to most other kinds of external radiation field. The size of the emission blob deduced from this study is comparable to the size of the dusty torus (). This implies that while the blob travels on the time scale under consideration, it may experience considerable change of the external radiation energy density. This change is not included in our current simulations. We can expect that the changes in the external field will lead to -ray variations which do not have optical counterparts. Since the occurrence of such variation in FSRQs is still unclear, we leave these considerations to future work.
4.2 Particle Escape
The rate of particle escape required for PKS 0208-512 in our EC scenario is very fast (). This is required because of the similarly fast particle acceleration that is needed to balance the efficient radiative cooling in this case. This particle escape is too fast to be explained by particle streaming out of the emission region.
One possible explanation is that the particles are accelerated in much smaller turbulent cells (see marscher_2013:fermi_symp_turb for discussion of the idea of turbulent cells) that are distributed across the emission region. So the ‘escape’ used in our model does not represent escape from the emission region, but rather escape from the accelerators. For example, if the size of the turbulent cells is , . These escaped particles are no longer being accelerated, but they still contribute to both synchrotron and IC emission. Let us assume the external radiation and its associated IC cooling are homogenous. As particles are being cooled in the larger volume and being injected from the cells, the particle number outside of the cells reaches a steady state , at sections where it can be described by a power-law with slope . With particle number inside the cells having a power-law distribution, will form a broken power-law distribution with the break energy equal to . Below the break , while above the break , where is the power-law slope of . There is an energy where . For , this happens close to the energy where (). Below the number of escaped particles is greater than that of the unescaped particles (at energy , ). If the magnetic field is also homogeneous, both the synchrotron and IC emission of the escaped particles will dominate. Under this scenario, the particle density listed in Table 1 () represents the escaped particle density above , while the total escaped non-thermal particle density when . In the whole volume the unescaped particles have averaged density of about when . The time dependent behavior of the escaped particles above will follow those of the unescaped ones. With a change of the normalization, and the power-law slope by 1, the emission of the unescaped particles can represent those of the escaped ones.
For the sake of universality, in this work we do not directly model the escaped particle population, because there are other possible explanations. For example the energy independence of the acceleration time scale used in this study may be a poor approximation, and a more realistic treatment of the energy dependence of the acceleration may result in very different particle escape rate to maintain the same electron distribution.
Acknowledgements
XC and MP acknowledge support by the Helmholtz Alliance for Astroparticle Physics HAP funded by the Initiative and Networking Fund of the Helmholtz Association.
References
- (1) E. Bonning, C.M. Urry, C. Bailyn, M. Buxton, R. Chatterjee, P. Coppi, G. Fossati, J. Isler, L. Maraschi, ApJ756, 13 (2012), 1201.4380
- (2) R. Chatterjee, C.D. Bailyn, E.W. Bonning, M. Buxton, P. Coppi, G. Fossati, J. Isler, L. Maraschi, C.M. Urry, ApJ749, 191 (2012), 1101.3815
- (3) R. Chatterjee, G. Fossati, C.M. Urry, C.D. Bailyn, L. Maraschi, M. Buxton, E.W. Bonning, J. Isler, P. Coppi, ApJ763, L11 (2013), 1212.2629
- (4) H.E.S.S. Collaboration, A. Abramowski, F. Acero, F. Aharonian, A.G. Akhperjanian, G. Anton, S. Balenderan, A. Balzer, A. Barnacka, Y. Becherini et al., A&A554, A107 (2013), 1304.8071
- (5) H. Krawczynski, S.B. Hughes, D. Horan, F. Aharonian, M.F. Aller, H. Aller, P. Boltwood, J. Buckley, P. Coppi, G. Fossati et al., ApJ601, 151 (2004)
- (6) C.M. Urry, R.F. Mushotzky, ApJ253, 38 (1982)
- (7) F. Guo, S. Li, H. Li, J. Giacalone, J.R. Jokipii, D. Li, ApJ747, 98 (2012), 1112.6373
- (8) F. Fraschetti, ApJ770, 84 (2013), 1304.4956
- (9) E. Parizot, A. Marcowith, J. Ballet, Y.A. Gallant, A&A453, 387 (2006), arXiv:astro-ph/0603723
- (10) Y. Mizuno, M. Pohl, J. Niemiec, B. Zhang, K.I. Nishikawa, P.E. Hardee, ApJ726, 62 (2011)
- (11) R. Chatterjee, K. Nalewajko, A.D. Myers, ApJ771, L25 (2013), 1306.1531
- (12) P.A. Evans, A.P. Beardmore, K.L. Page, J.P. Osborne, P.T. O’Brien, R. Willingale, R.L.C. Starling, D.N. Burrows, O. Godet, L. Vetere et al., MNRAS397, 1177 (2009), 0812.3662
- (13) X. Chen, G. Fossati, E.P. Liang, M. Böttcher, MNRAS416, 2368 (2011), 1106.1865
- (14) X. Chen, G. Fossati, M. Böttcher, E. Liang, MNRAS424, 789 (2012), 1205.2344
- (15) K. Katarzyński, G. Ghisellini, A. Mastichiadis, F. Tavecchio, L. Maraschi, A&A453, 47 (2006)
- (16) P. Giommi, G. Polenta, A. Lähteenmäki, D.J. Thompson, M. Capalbi, S. Cutini, D. Gasparrini, J. González-Nuevo, J. León-Tavares, M. López-Caniego et al., A&A541, A160 (2012), 1108.1114
- (17) M. Elvis, B.J. Wilkes, J.C. McDowell, R.F. Green, J. Bechtold, S.P. Willner, M.S. Oey, E. Polomski, R. Cutri, ApJS95, 1 (1994), provided by the NASA Astrophysics Data System, 1994ApJS…95….1E
- (18) MAGIC Collaboration, J. Albert, E. Aliu, H. Anderhub, L.A. Antonelli, P. Antoranz, M. Backes, C. Baixeras, J.A. Barrio, H. Bartko et al., Science 320, 1752 (2008)
- (19) A. Furniss, D.A. Williams, C. Danforth, M. Fumagalli, J.X. Prochaska, J. Primack, C.M. Urry, J. Stocke, A.V. Filippenko, W. Neely, ApJ768, L31 (2013)
- (20) J. Aleksić, L.A. Antonelli, P. Antoranz, M. Backes, J.A. Barrio, D. Bastieri, J. Becerra González, W. Bednarek, A. Berdyugin, K. Berger et al., ApJ730, L8 (2011), 1101.4645
- (21) F. Tavecchio, G. Ghisellini, ArXiv e-prints (2012), 1209.2291
- (22) S.G. Jorstad, A.P. Marscher, M.L. Lister, A.M. Stirling, T.V. Cawthorne, W.K. Gear, J.L. Gómez, J.A. Stevens, P.S. Smith, J.R. Forster et al., AJ130, 1418 (2005), arXiv:astro-ph/0502501
- (23) A.A. Abdo, M. Ackermann, M. Ajello, W.B. Atwood, M. Axelsson, L. Baldini, J. Ballet, G. Barbiellini, D. Bastieri, K. Bechtol et al., ApJ710, 1271 (2010)
- (24) K. Nalewajko, M. Sikora, G.M. Madejski, K. Exter, A. Szostek, R. Szczerba, M.R. Kidger, R. Lorente, ApJ760, 69 (2012), 1210.4552
- (25) G. Ghisellini, F. Tavecchio, L. Foschini, G. Bonnoli, G. Tagliaferri, MNRAS432, L66 (2013), 1302.4444
- (26) A.P. Marscher, ArXiv e-prints (2013), 1304.2064