Multidimensional Coherent Photocurrent Spectroscopy of a Semiconductor Nanostructure
Abstract
Multidimensional Coherent Optical Photocurrent Spectroscopy (MD-COPS) is implemented using unstabilized interferometers. Photocurrent from a semiconductor sample is generated using a sequence of four excitation pulses in a collinear geometry. Each pulse is tagged with a unique radio frequency through acousto-optical modulation ; the Four-Wave Mixing (FWM) signal is then selected in the frequency domain. The interference of an auxiliary continuous wave laser, which is sent through the same interferometers as the excitation pulses, is used to synthesize reference frequencies for lock-in detection of the photocurrent FWM signal. This scheme enables the partial compensation of mechanical fluctuations in the setup, achieving sufficient phase stability without the need for active stabilization. The method intrinsically provides both the real and imaginary parts of the FWM signal as a function of inter-pulse delays. This signal is subsequently Fourier transformed to create a multi-dimensional spectrum. Measurements made on the excitonic resonance in a double InGaAs quantum well embedded in a p-i-n diode demonstrate the technique.
I Introduction
Multi-Dimensional Coherent Spectroscopy (MDCS) is an ultra-fast spectroscopy technique that unfolds spectral information onto several dimensions to correlate absorption, mixing, and emission frequencies. Originally developed for nuclear magnetic resonance experiments ernst_principles_1987 , MDCS was brought to the optical domain jonas_two-dimensional_2003 . In addition to molecules, this powerful technique has been very successfully applied to semiconductor heterostructures such as quantum wells li_many-body_2006 ; singh_anisotropic_2013 , or atomic vapors dai_two-dimensional_2010 ; li_unraveling_2013 . MDCS enables the separation of homogeneous and inhomogeneous line widths of a resonance singh_anisotropic_2013 ; siemens_resonance_2010 ; moody_exciton-exciton_2011 , the characterization of single and two-quantum coherences stone_two-quantum_2009 ; karaiskaj_two-quantum_2010 , and the study of the role played by many-body interactions li_many-body_2006 . It is also an ideal tool to study coupling between transitions, such as excitons confined in separated QWs davis_three-dimensional_2011 ; nardin_coherent_2013_arXiv or Quantum Dots (QDs) moody_exciton-exciton_2011 ; kasprzak_coherent_2011 ; albert_microcavity_2013 . However, conventional MDCS techniques rely on the wave-vector selection of the FWM signal based on phase matching. This selection only applies in 2D or 3D systems such as atomic vapors, semiconductor QWs, or dense ensembles of nano-objects moody_exciton-exciton_2011 . Thus, conventional techniques cannot be applied to sub-wavelength structures where the translational symmetry is broken, such as individual (or small ensembles of) QDs, or other single nano-objects. In this case, radiation by point sources prevents the formation of a well defined FWM beam in the phase matched direction. So far, only a sophisticated heterodyne mixing technique has been demonstrated to provide access to FWM of single QDs kasprzak_coherent_2011 , relying on assumptions made about the phase evolution of a reference resonance in order to phase individual one-dimensional spectra.
Here we present a MDCS technique that enables measurement of FWM signals from nanostructures without relying on wave-vector selection of the signal. The approach measures the FWM signal via photocurrent readout and is suitable for any sample with which electrical contacts can be made, including single nano-objects. Advantages of the method include the intrinsic measurement of the FWM amplitude and phase, and a natural reduction of the impact of mechanical fluctuations, allowing us to achieve sufficient phase stability without active stabilization. As a proof of principle, 2D photocurrent spectra of excitons confined in a double InGaAs QW are presented.
II Experiment
MDCS is an extension of FWM experiments. In conventional MDCS a sequence of three pulses is sent to the sample, and the radiated FWM is heterodyned with a local oscillator for phase resolution and detected by a spectrometer. Inter-pulse delays are precisely stepped, and the data is then Fourier transformed with respect to these delays to obtain multi-dimensional spectra. This scheme has been implemented in various geometries. A common one is the pump-probe geometry, where the phase-locked delay between first and second pulses is achieved using pulse-shaping methods, and the signal is self-heterodyned with the transmitted probe serving as the local oscillator grumstrup_facile_2007 . The drawbacks of the pump-probe method are that only the real part (not the amplitude) of the correlation spectrum can be obtained, and delays are limited to about 10 ps (shorter than coherence and population times in semiconductor materials). Another implementation of conventional MDCS is the box geometry bristow_versatile_2009 . This geometry enables separation of rephasing and non-rephasing contributions li_many-body_2006 , the characterization of two-quantum coherences stone_two-quantum_2009 ; karaiskaj_two-quantum_2010 , and can provide longer inter-pulse delays if active stabilization is used bristow_versatile_2009 . However, MDCS in the box geometry requires additional procedures to obtain real and imaginary parts of the multidimensional spectra zhang_optical_2005 ; bristow_all-optical_2008 . Moreover, as mentioned above, non-collinear geometries cannot be used to study single or few zero-dimensional objects.
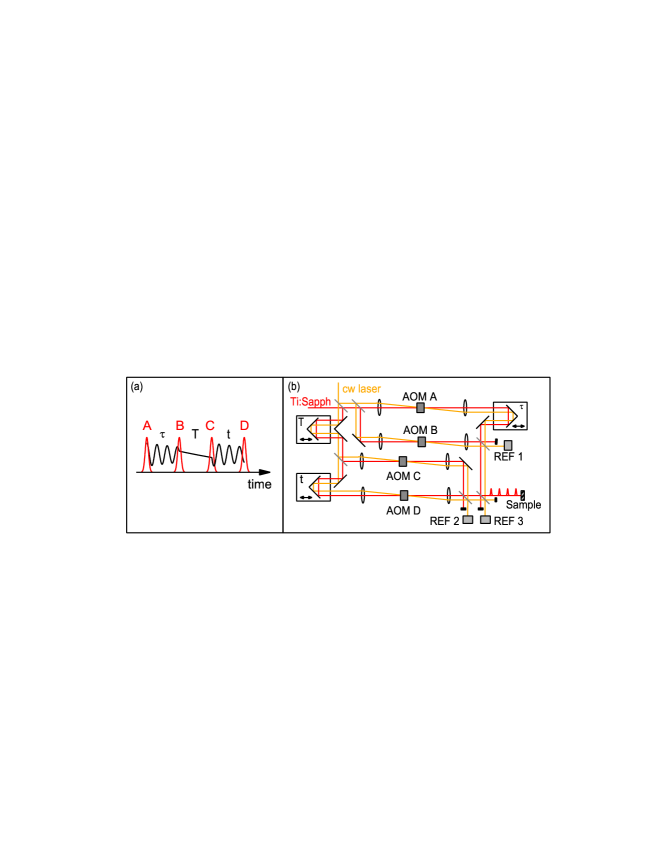
MDCS using collinear geometry has been demonstrated, based either on phase cycling algorithms tian_femtosecond_2003 ; aeschlimann_coherent_2011 or selection of the FWM signal in the frequency domain tekavec_fluorescence-detected_2007 . In the present work, we use a collinear geometry where four pulses are sent to the sample. Pulses are denoted A, B, C, and D (in the chronological order at which they hit the sample) and the corresponding inter-pulse delays are denoted , and . (Fig. 1 (a)). The role of the fourth pulse is to convert the third order polarization into a fourth order population that we detect in the form of a photocurrent signal. The FWM signal is isolated in the frequency domain, using an approach similar to that developed by Tekavec et al, where the fourth order population generated in an atomic vapor was detected in the form of a fluorescence signal tekavec_fluorescence-detected_2007 . The four-pulse sequence is generated by sending the beam of a mode-locked Ti:Sapph oscillator (Coherent MIRA - 76 MHz repetition rate NIST_disclaimer ) into a set of two Mach-Zehnder interferometers nested within a larger Mach-Zehnder interferometer (Fig. 1 (b)). Three translation stages are used to control inter-pulse delays , and . Each interferometer arm contains an Acoustic Optical Modulator (AOM) (Isomet 1205c-1) driven by a phase-locked direct digital synthesizer (Analog Devices AD9959). In each arm the 0th diffraction order of the AOM is spatially blocked and the 1st order beam is used. Each AOM tags the beams with a unique radio frequency , with . The resulting non-linear signals oscillate at radio frequencies given by sums and differences of the AOM frequencies.
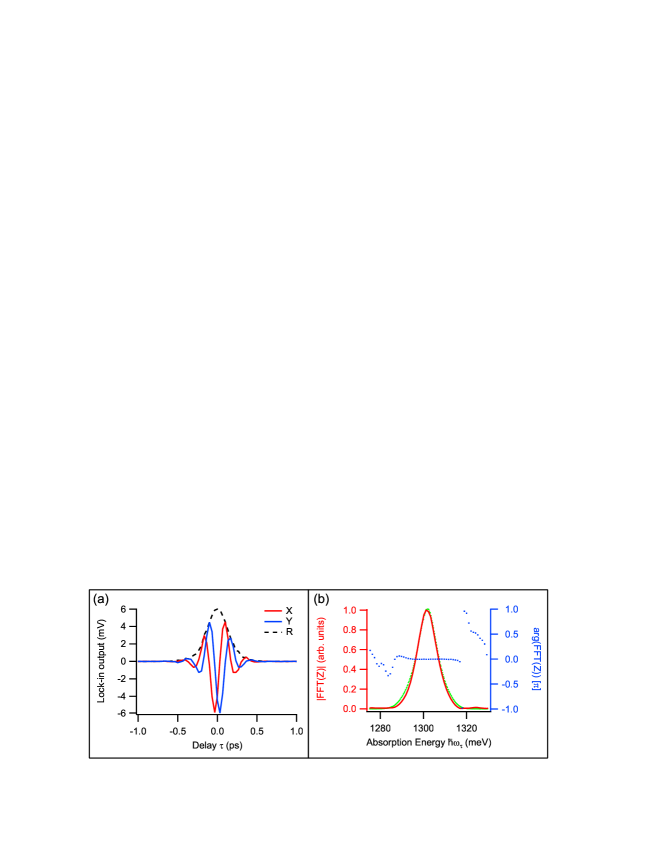
As a simple example, the photocurrent signal obtained from a combination of pulses A and B oscillates at the difference frequency (beat note) . Dual phase lock-in detection is used to isolate and demodulate this signal. A continuous wave (cw) laser (external cavity diode laser, = 941.5) runs through the same optics as the excitation laser, but is vertically offset from the path of the excitation laser. The beat note resulting from its interference, recorded by reference photodetectors (REF1 for arms A and B on Fig. 1 (b)) serves as a reference for lock-in detection of the signal. This detection scheme provides several advantages: (1) The bandpass filtering around the beat note frequency achieved by the lock-in ensures that detected signal results from a wave-mixing process where pulses A and B contribute once each. Other contributions (single pulse contributions, noise at mechanical vibration frequencies, dark current) are filtered out by the lock-in. (2) The phase of the signal is correlated to the phase of the excitation pulses, providing a direct, intrinsic access to the complex signal Z = X + iY from the dual phase lock-in amplifier output. (3) When stepping delay , the signal phase at the lock-in output does not evolve at an optical frequency, but at a reduced frequency given by the difference between the signal and cw laser optical frequencies. This “physical undersampling” of the signal results in a smaller number of points required to sample the signal, and in an improvement of the signal-to-noise ratio: the impact of a mechanical fluctuation in the setup, corresponding to a delay fluctuation , scales as tekavec_fluorescence-detected_2007 ; tekavec_wave_2006 . In other words, the cw laser senses and partially compensates for phase noise resulting from optical path fluctuations occurring in the setup. As a consequence, it is important to choose a cw laser wavelength as close as possible to the signal wavelength. With this technique, large inter-pulse delays are achievable (limited only by the coherence length of the cw laser or, as in our case, by the length of the delay stages). This is particularly useful for the spectroscopy of semiconductor nanostructures such as QDs, where coherence times can be of the order of the nanosecond borri_ultralong_2001 ; birkedal_long_2001 . We show in Fig. 2 the measurement to determine zero delay between pulses A and B. For this, we substitute for the sample with a broadband commercial detector (Thorlabs DET10A Si detector NIST_disclaimer ). Stepping the delay , we perform a field auto-correlation of the excitation pulse. The signal, oscillating in real time at the frequency , is demodulated by the lock-in detection scheme. Figure 2 (a) shows the in-phase and in-quadrature components of the signal, provided by the lock-in outputs X and Y, respectively, and the signal amplitude R. X and Y, shifted by 90∘, evolve with the stepping of at the reduced frequency 3.5 THz. Since the phase and amplitude of the signal are known, a Fourier transform with respect to provides us with the one-dimensional power spectrum and spectral phase of the excitation laser (Fig. 2 (b)).
In a similar way, the four pulses can be used to generate a FWM signal, and the delays , and can be stepped to record 2D or 3D data, which can be Fourier transformed with respect to each delay to produce multi-dimensional spectra. The most typical 2D spectrum in conventional MDCS is obtained by stepping delays and while keeping at a constant value. To produce the appropriate lock-in reference for the FWM signal, we detect the beat notes and on two separate photodetectors (REF1 and REF2 in Fig. 1 (b)). These beat frequencies are mixed digitally using a digital signal processor (DSP) (SigmaStudios ADAU1761Z NIST_disclaimer ). The mixing algorithm (in-quadrature mixing) is as follows: the beat notes are input into the DSP, where they independently undergo a Hilbert transform. Then we make use of the identity . This provides reference frequencies and for the lock-in detection of the photocurrent FWM signal. These frequencies are analogous to the phase-matched directions and of non-collinear MDCS, corresponding to the so-called rephasing (or ) and non-rephasing (or ) pulse sequences, respectively. In the box geometry, and need to be recorded separately since they correspond to a different pulse sequence, while with frequency domain selection and can be recorded simultaneously on two separate lock-in amplifiers. It is also possible to detect two-quantum (or ) signals that oscillate at the radio frequency . The reference frequency that allows demodulation of such a signal cannot be generated from reference detectors REF1 and REF2. It can be extracted from detector REF3 at the output of the nested Mach-Zehnder interferometer (see Fig. 1), and separated out from other frequency components using appropriate filters in the DSP.
III Results

We demonstrate the working principle of our setup on a double In0.2Ga0.8As/GaAs QW, embedded within the intrinsic region of a p-i-n diode. The double QW consists in a 4.8 nm thick QW and a 8 nm thick QW, separated by a barrier of 4 nm thickness. An Au-Ni-Ge bottom contact was deposited on the n-doped substrate. A top contact (5nm Ti and 200nm Au) was deposited on part of the sample surface. The sample was kept at a temperature of 15.5K in a cold finger liquid Helium cryostat. In order to deal with the sample capacitance, a “bootstrap” trans-impedance circuit graeme_photodiode_1996 ; LTC6244 was used to convert the photocurrent from the sample into a voltage that is read by the lock-in amplifiers (Stanford Research SRS830 NIST_disclaimer ) input (Fig. 3).
The AOM frequencies that we use are = 80.109 MHz, = 80.104 MHz, = 80.019 MHz, = 80 MHz. The beat notes recorded by reference detectors REF1 and REF2 as a result of the cw laser interference are then = 5 kHz and = 19 kHz, respectively. As a result of in-quadrature mixing by the DSP, the reference frequencies provided to the lock-in amplifiers for the and FWM signal are = 14kHz and = 24kHz.
Let us underline that thanks to the “physical undersampling” phenomenon mentioned above, we do not need to implement active stabilization, a major advantage compared to conventional MDCS techniques bristow_versatile_2009 .
Figure 4 shows 2D spectra that were recorded from the sample. A forward bias = 0.5 V, for which we obtain the strongest FWM signal, was applied through the bootstrap circuit (see Fig. 3). The laser spectrum was the same as shown in Fig. 2 (b), exciting the lowest energy excitonic resonance of the double QW structure. The total excitation power (four pulses) was 250 . The pulse sequence was focused on the sample using a microscope lens (Nikon EPI ELWD CF Plan 20x, NA = 0.4 NIST_disclaimer ), providing an excitation spot of 5 m diameter. While delays and were stepped, delay was kept at 200 fs. A fast Fourier transform with respect to delays and provides 2D spectra as a function of and . Non-rephasing ( - Fig.4 (a)-(b)) and rephasing (( - Fig.4 (c)-(d)) spectra were obtained simultaneously from two separate lock-in amplifiers.
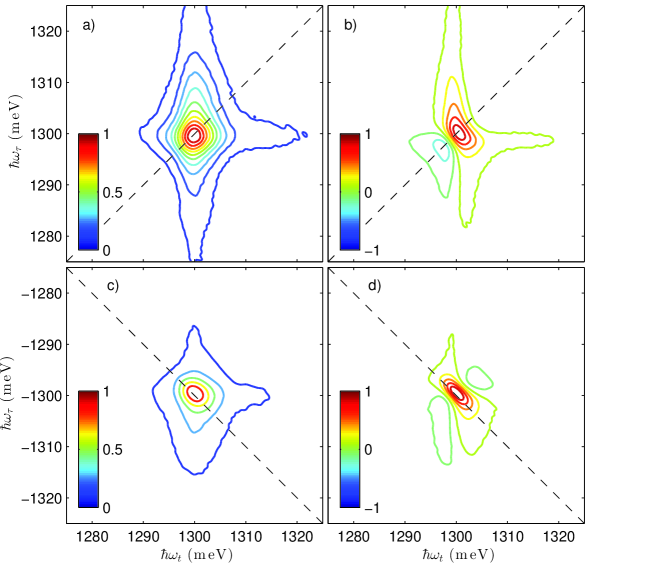
The absolute value of and spectra (Fig.4 (a) and (c)) show a peak on the diagonal corresponding to the lowest energy exciton of the double QW. In the spectrum the peak is slightly elongated along the diagonal, a sign of slight inhomogeneous broadening of the excitonic resonance. Thanks to the intrinsic phase resolution of the technique, real and imaginary parts of the data are directly obtained as well. To determine the absolute phase offset of the signal, we set the phase of the time domain data to be zero at zero and delays tekavec_fluorescence-detected_2007 : . We show in Fig. 4 (b) and (d) the real parts of the and spectra, respectively, exhibiting a typical absorptive line shape.
IV Conclusion
We have implemented and demonstrated a robust, versatile platform for the MDCS of nanostructures. In a collinear geometry, the FWM signal is detected as a photocurrent and isolated in the frequency domain. This method provides an intrinsic phase resolution of the signal, and enables the recording of rephasing and non-rephasing FWM signals simultaneously. An auxiliary cw laser runs through the same optics as the excitation laser to partially compensate for mechanical fluctuations occurring in the setup, enabling optical MDCS without the need of active stabilization. Long inter-pulse delays can be achieved (only limited by the coherence length of the cw laser or the length of the delay stages), particularly adapted to the long coherence and population times of excitations in semiconductor materials. Demonstrated on an InGaAs double QW structure, the technique can be extended to the MDCS of single nano-objects, since it does not rely on the wave-vector selection of the FWM signal. Considering that photocurrent measurements have been reported in single QDs zrenner_coherent_2002 ; zecherle_ultrafast_2010 , carbon nanotubes bao_mapping_2012 , and nanowires wang_highly_2001 ; cao_engineering_2009 ; krogstrup_single-nanowire_2013 , the Multidimensional Coherent Optical Photocurrent Spectroscopy (MD-COPS) technique can be applied on all of these types of single nanostructures. Let us finally note that, while we have shown 2D rephasing and non-rephasing spectra, the MD-COPS setup can realize 3D spectra li_unraveling_2013 , as well as two-quantum 2D spectra, without any technical modification.
We acknowledge Terry Brown, Andrej Grubisic and David Alchenberger for technical help and fruitful discussions, and Richard Mirin for the epitaxial growth of the QW sample. The work at JILA was primarily supported by the Chemical Sciences, Geosciences, and Energy Biosciences Division, Office of Basic Energy Science, Office of Science, U.S. Department of Energy under Award# DE-FG02-02ER15346, as well NIST. G.N. acknowledges support by the Swiss National Science Foundation (SNSF).
References
- (1) R. Ernst, G. Bodenhausen, and A. Wokaun, Principles of nuclear magnetic resonance in one and two dimensions (Oxford Uni. Press, London/New York, 1987).
- (2) D. M. Jonas, “Two-dimensional femtosecond spectroscopy,” Annu. Rev. Phys. Chem. 54, 425–463 (2003).
- (3) X. Li, T. Zhang, C. N. Borca, and S. T. Cundiff, “Many-body interactions in semiconductors probed by optical two-dimensional fourier transform spectroscopy,” Phys. Rev. Lett. 96, 057406 (2006).
- (4) R. Singh, T. M. Autry, G. Nardin, G. Moody, H. Li, K. Pierz, M. Bieler, and S. T. Cundiff, “Anisotropic homogeneous linewidth of the heavy-hole exciton in (110)-oriented GaAs quantum wells,” Phys. Rev. B 88, 045304 (2013).
- (5) X. Dai, A. D. Bristow, D. Karaiskaj, and S. T. Cundiff, “Two-dimensional fourier-transform spectroscopy of potassium vapor,” Phys. Rev. A 82, 052503 (2010).
- (6) H. Li, A. D. Bristow, M. E. Siemens, G. Moody, and S. T. Cundiff, “Unraveling quantum pathways using optical 3D fourier-transform spectroscopy,” Nat. Commun. 4, 1390 (2013).
- (7) M. E. Siemens, G. Moody, H. Li, A. D. Bristow, and S. T. Cundiff, “Resonance lineshapes in two-dimensional fourier transform spectroscopy,” Opt. Express 18, 17699–17708 (2010).
- (8) G. Moody, M. E. Siemens, A. D. Bristow, X. Dai, D. Karaiskaj, A. S. Bracker, D. Gammon, and S. T. Cundiff, “Exciton-exciton and exciton-phonon interactions in an interfacial GaAs quantum dot ensemble,” Phys. Rev. B 83, 115324 (2011).
- (9) K. W. Stone, K. Gundogdu, D. B. Turner, X. Li, S. T. Cundiff, and K. A. Nelson, “Two-quantum 2D FT electronic spectroscopy of biexcitons in GaAs quantum wells,” Science 324, 1169 –1173 (2009).
- (10) D. Karaiskaj, A. D. Bristow, L. Yang, X. Dai, R. P. Mirin, S. Mukamel, and S. T. Cundiff, “Two-quantum many-body coherences in two-dimensional fourier-transform spectra of exciton resonances in semiconductor quantum wells,” Phys. Rev. Lett. 104, 117401 (2010).
- (11) J. A. Davis, C. R. Hall, L. V. Dao, K. A. Nugent, H. M. Quiney, H. H. Tan, and C. Jagadish, “Three-dimensional electronic spectroscopy of excitons in asymmetric double quantum wells,” The Journal of Chemical Physics 135, 044510–044510–9 (2011).
- (12) G. Nardin, G. Moody, R. Singh, T. M. Autry, H. Li, F. Morier-Genoud, and S. T. Cundiff, “Coherent excitonic coupling in an asymmetric double InGaAs quantum well,” arXiv e-print 1308.1689 (2013).
- (13) Kasprzak, J., Patton, B., Savona, V., and Langbein, W., “Coherent coupling between distant excitons revealed by two-dimensional nonlinear hyperspectral imaging,” Nat Photon 5, 57–63 (2011).
- (14) F. Albert, K. Sivalertporn, J. Kasprzak, M. Strauß, C. Schneider, S. Höfling, M. Kamp, A. Forchel, S. Reitzenstein, E. A. Muljarov, and W. Langbein, “Microcavity controlled coupling of excitonic qubits,” Nat Commun 4, 1747 (2013).
- (15) E. M. Grumstrup, S.-H. Shim, M. A. Montgomery, N. H. Damrauer, and M. T. Zanni, “Facile collection of two-dimensional electronic spectra using femtosecond pulse-shaping technology,” Opt. Express 15, 16681–16689 (2007).
- (16) A. D. Bristow, D. Karaiskaj, X. Dai, T. Zhang, C. Carlsson, K. R. Hagen, R. Jimenez, and S. T. Cundiff, “A versatile ultrastable platform for optical multidimensional fourier-transform spectroscopy,” Rev. Sci. Instrum. 80, 073108 (2009).
- (17) T. Zhang, C. Borca, X. Li, and S. Cundiff, “Optical two-dimensional fourier transform spectroscopy with active interferometric stabilization,” Opt. Express 13, 7432–7441 (2005).
- (18) A. D. Bristow, D. Karaiskaj, X. Dai, and S. T. Cundiff, “All-optical retrieval of the global phase for two-dimensionalFourier-transform spectroscopy,” Opt. Express 16, 18017–18027 (2008).
- (19) P. Tian, D. Keusters, Y. Suzaki, and W. S. Warren, “Femtosecond phase-coherent two-dimensional spectroscopy,” Science 300, 1553 –1555 (2003).
- (20) M. Aeschlimann, T. Brixner, A. Fischer, C. Kramer, P. Melchior, W. Pfeiffer, C. Schneider, C. Strüber, P. Tuchscherer, and D. V. Voronine, “Coherent two-dimensional nanoscopy,” Science 333, 1723–1726 (2011).
- (21) P. F. Tekavec, G. A. Lott, and A. H. Marcus, “Fluorescence-detected two-dimensional electronic coherence spectroscopy by acousto-optic phase modulation,” J. Chem. Phys. 127, 214307 (2007).
- (22) Mention of commercial products is for information only ; it does not imply NIST recommendation or endorsment, nor does it imply that the products mentioned are necessarily the best available for the purpose.
- (23) P. F. Tekavec, T. R. Dyke, and A. H. Marcus, “Wave packet interferometry and quantum state reconstruction by acousto-optic phase modulation,” J. Chem. Phys. 125, 194303 (2006).
- (24) P. Borri, W. Langbein, S. Schneider, U. Woggon, R. L. Sellin, D. Ouyang, and D. Bimberg, “Ultralong dephasing time in InGaAs quantum dots,” Phys. Rev. Lett. 87, 157401 (2001).
- (25) D. Birkedal, K. Leosson, and J. M. Hvam, “Long lived coherence in self-assembled quantum dots,” Phys. Rev. Lett. 87, 227401 (2001).
- (26) J. G. Graeme, Photodiode Amplifiers: OP AMP Solutions (McGraw Hill Professional, 1996).
- (27) See also application note from http://cds.linear.com/docs/en/datasheet/6244fb.pdf.
- (28) A. Zrenner, E. Beham, S. Stufler, F. Findeis, M. Bichler, and G. Abstreiter, “Coherent properties of a two-level system based on a quantum-dot photodiode,” Nature 418, 612–614 (2002).
- (29) M. Zecherle, C. Ruppert, E. C. Clark, G. Abstreiter, J. J. Finley, and M. Betz, “Ultrafast few-fermion optoelectronics in a single self-assembled InGaAs/GaAs quantum dot,” Phys. Rev. B 82, 125314 (2010).
- (30) W. Bao, M. Melli, N. Caselli, F. Riboli, D. S. Wiersma, M. Staffaroni, H. Choo, D. F. Ogletree, S. Aloni, J. Bokor, S. Cabrini, F. Intonti, M. B. Salmeron, E. Yablonovitch, P. J. Schuck, and A. Weber-Bargioni, “Mapping local charge recombination heterogeneity by multidimensional nanospectroscopic imaging,” Science 338, 1317–1321 (2012).
- (31) J. Wang, M. S. Gudiksen, X. Duan, Y. Cui, and C. M. Lieber, “Highly polarized photoluminescence and photodetection from single indium phosphide nanowires,” Science 293, 1455–1457 (2001).
- (32) L. Cao, J. S. White, J.-S. Park, J. A. Schuller, B. M. Clemens, and M. L. Brongersma, “Engineering light absorption in semiconductor nanowire devices,” Nat Mater 8, 643–647 (2009).
- (33) P. Krogstrup, H. I. Jørgensen, M. Heiss, O. Demichel, J. V. Holm, M. Aagesen, J. Nygard, and A. Fontcuberta i Morral, “Single-nanowire solar cells beyond the shockley-queisser limit,” Nat Photon 7, 306–310 (2013).